
The Market Breadth Summary
- Oil rebounded as renewed geopolitical tensions briefly lifted prices, but the stock market bulls barely blinked and quickly resumed buying, reinforcing the prevailing bullish trend.
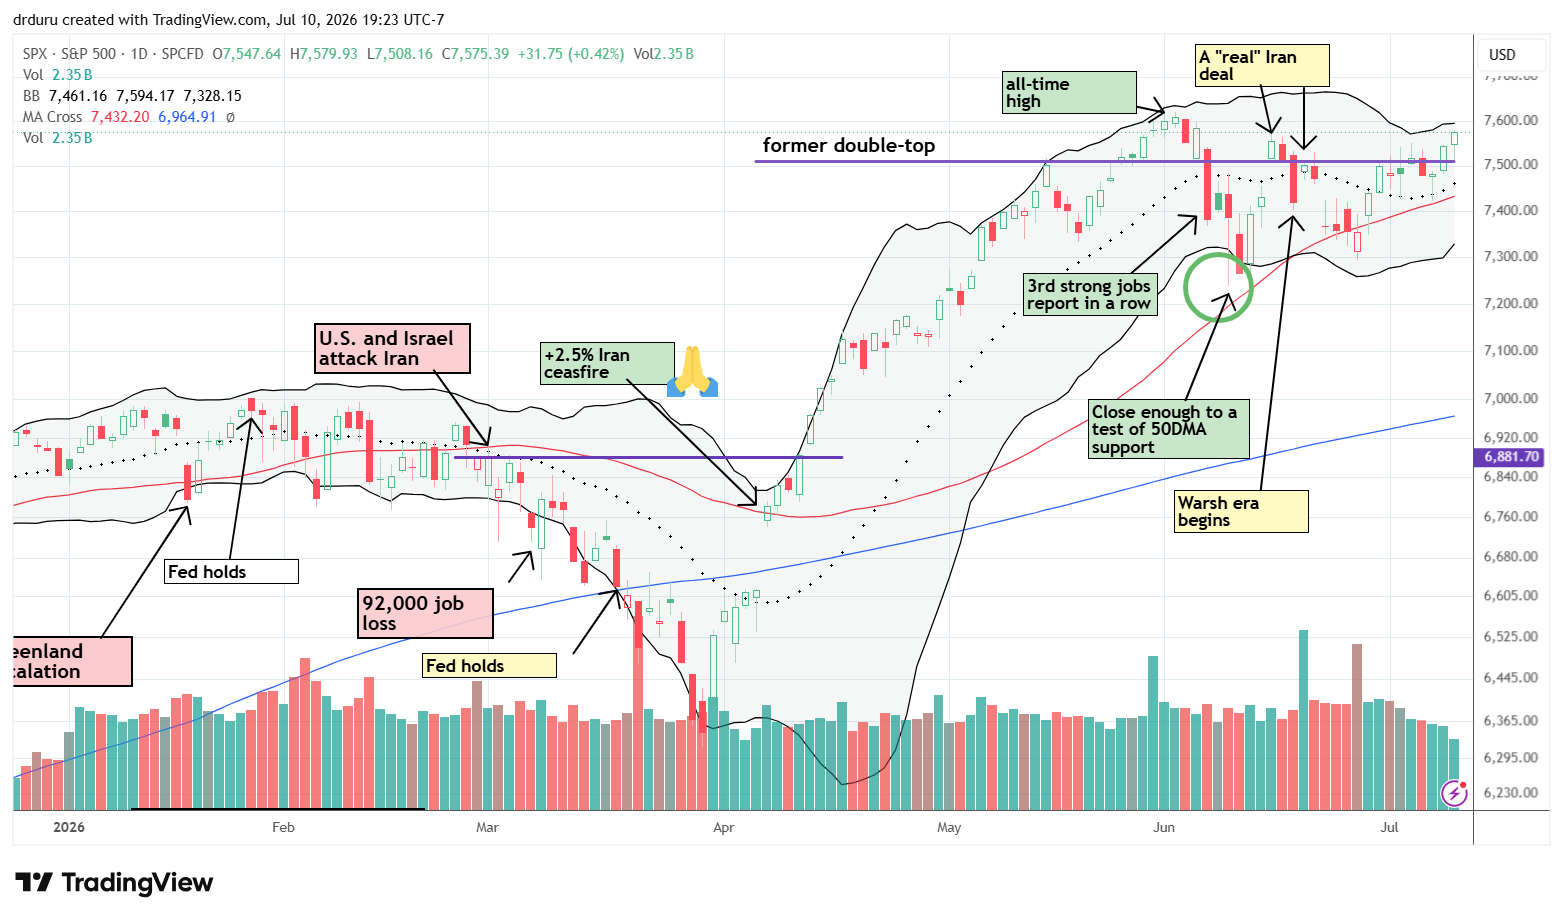
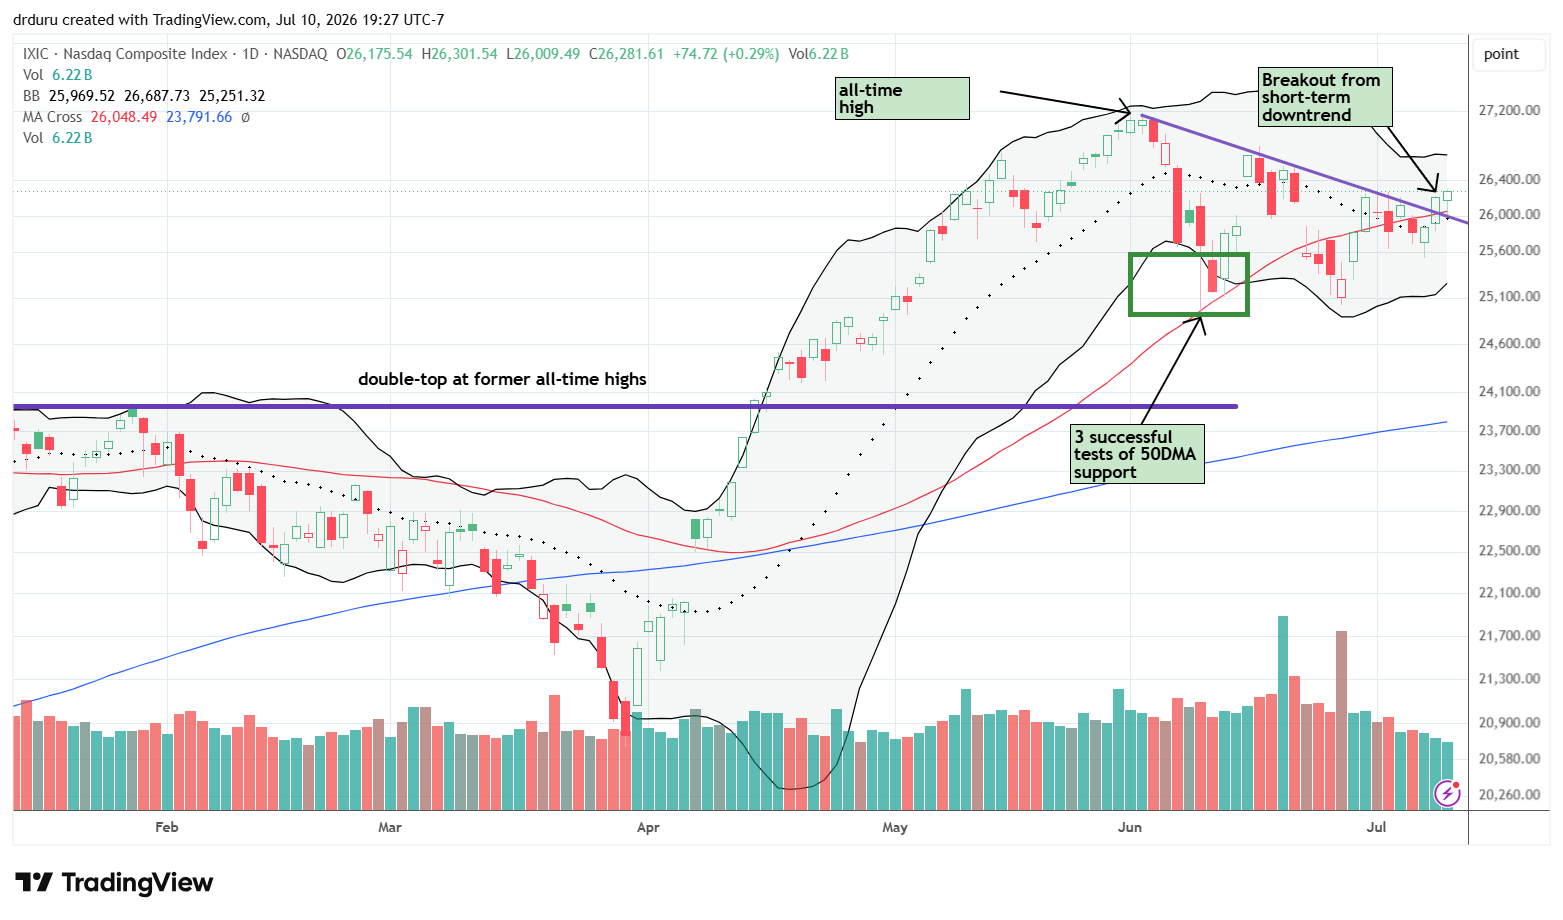
- The S&P 500 broke above its former double top, while the NASDAQ broke out above its short-term downtrend despite growing instability in AI-related stocks.
- Market breadth and the volatility index remained constructive for bullish sentiment.
- The cautiously bullish trading outlook remained intact as rotation away from the AI trade retains overall market momentum.
The Stock Market Summary
I focused on two major developments during the past week of trading: the reemergence of oil and the skittishness of the AI trade. The resumption of the war against Iran nudged oil higher after multiple attacks against oil tankers had already brought an end to oil’s weeks-long decline. While oil rebounded, the bulls barely blinked. The war-driven dip in the market on Wednesday, July 8, was just enough to gently tap a key support level before the buying resumed. More importantly, oil quickly resumed drifting lower after the war officially restarted.
The end of a ceasefire that never seemed to generate meaningful negotiations reopens the possibility of an extended conflict. While attempting to predict war outcomes is nearly fruitless, I do recognize that this war creates incremental uncertainty that the stock market is still willing to ignore. The uncertainty remains a wild card capable of producing sharp market gyrations at any time and for any reason. However, since the market remains in a bullish mode that ignores almost any bad news, those dips have continued to provide buying opportunities, especially for short-term traders.
I also see a growing shakiness in the AI trade. Several stocks produced strong rebounds, but I am suspicious of the pattern of a large gain one day, followed by a large loss the next day, and then rinse and repeat. The volatility creates opportunities for day traders and may reflect increasing eagerness to exit the trade and take profits. I do not know how the instability will resolve, but I remain alert for a proliferation of breakdowns.
S&P 500 (SPY)
The S&P 500 finally (SPY) jumped above its former double top and returned to clear bullish territory. The eventual move higher encouraged me to maintain a bullish position. I expect the index to challenge new all-time highs soon like a coiled spring freeing up to move again. The midweek test of support at the 50-day moving average (DMA) (the red line) set up the two days of gains to end the week. Bulls barely blinked long enough to allow the 50DMA test.
NASDAQ (COMPQ)
The NASDAQ became more constructive after breaking out above its short-term downtrend and bouncing off 50DMA support. The tech-laden index has more work to do than the S&P 500 to set a new all-time high. The NASDAQ is weighed down more by the relative topping out in the AI-related trade.
iShares Russell 2000 ETF (IWM)
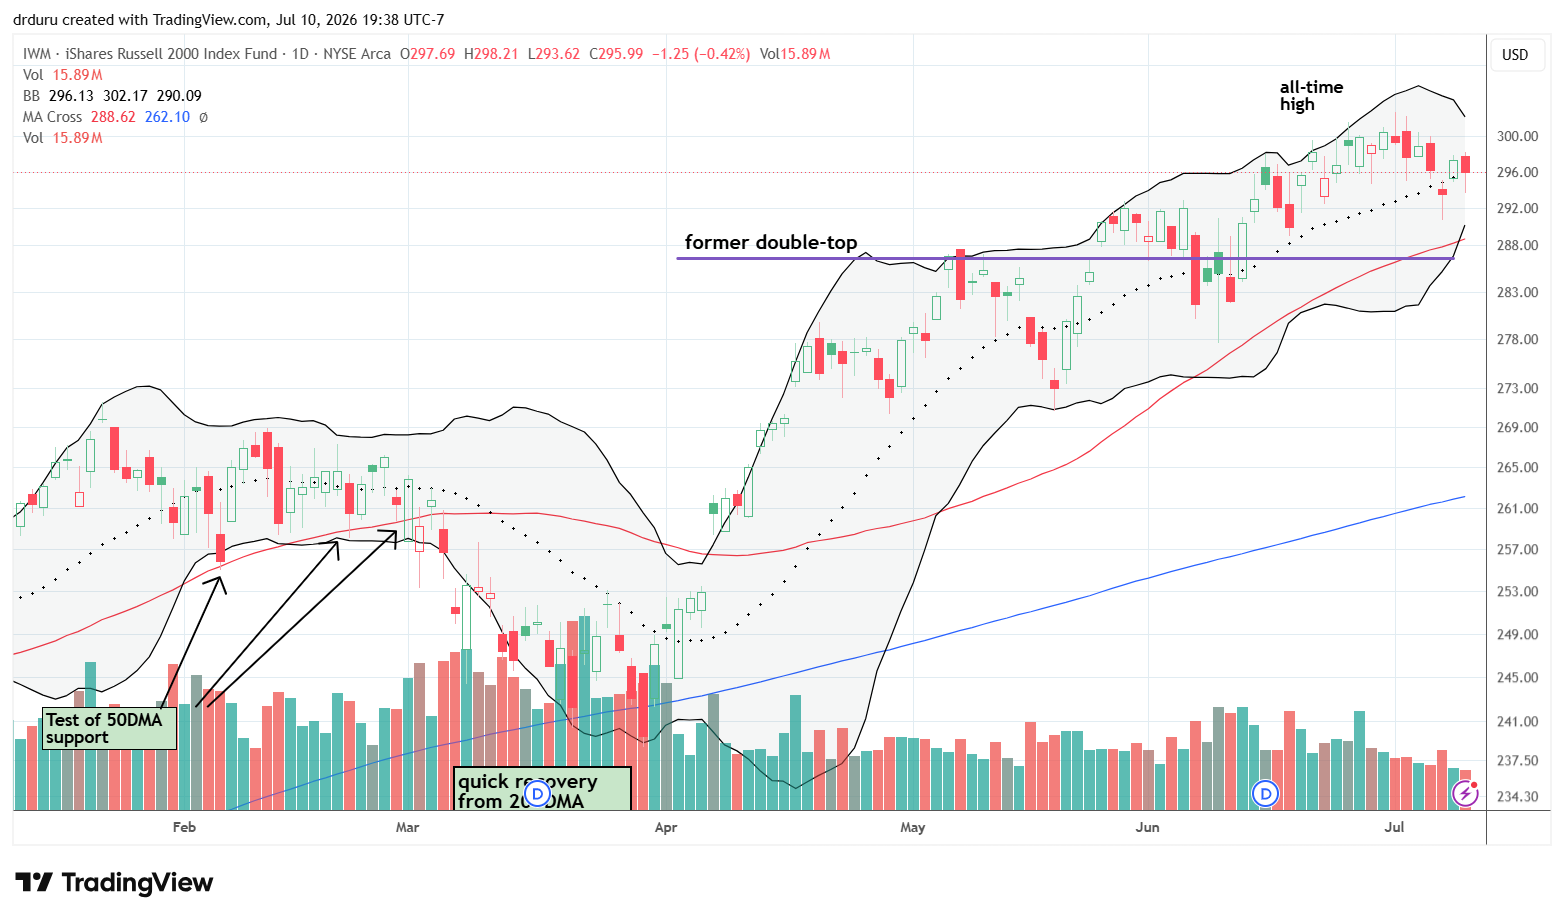
The iShares Russell 2000 ETF (IWM) churned for the week and stayed close to its all-time high. Wednesday’s war-driven breach of 20DMA support (the dashed line) was brief. The ETF of small caps bounced above its 20DMA the next day and held support on Friday’s tiny pullback.
The Bollinger Bands have also started pinching inward. This Bollinger Band squeeze often precedes a large and sustained move in either direction. I am on alert for the resolution. In the meantime, I go into the coming week with the long side of a $300 weekly calendar call spread.
The Short-Term Trading Call With Bulls Barely Blinking
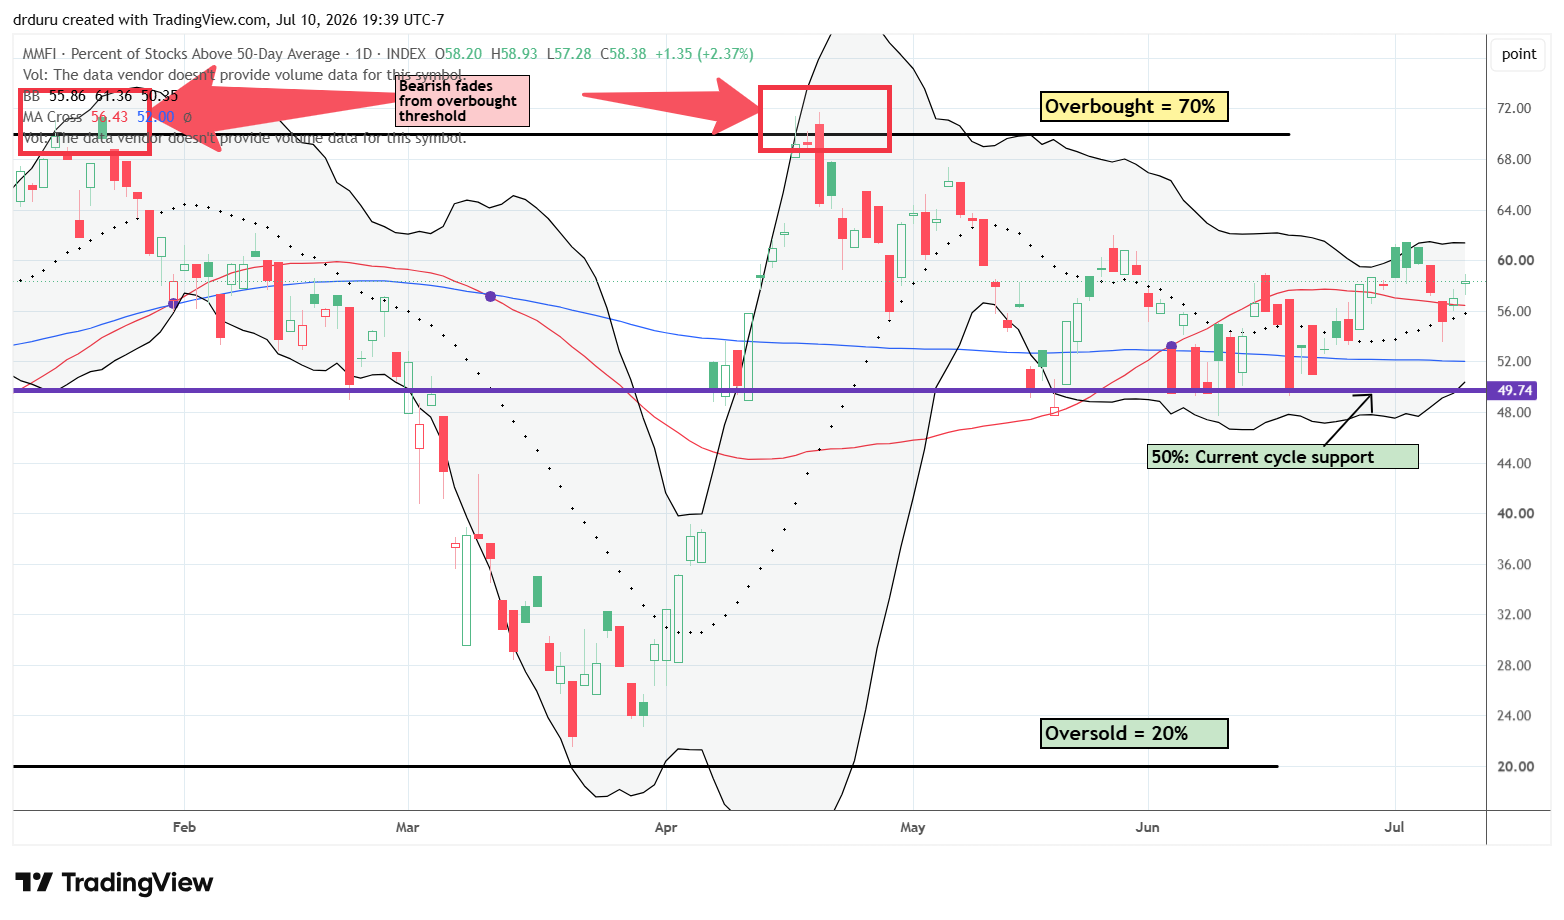
- AT50 (MMFI) = 58.4% of stocks are trading above their respective 50-day moving averages
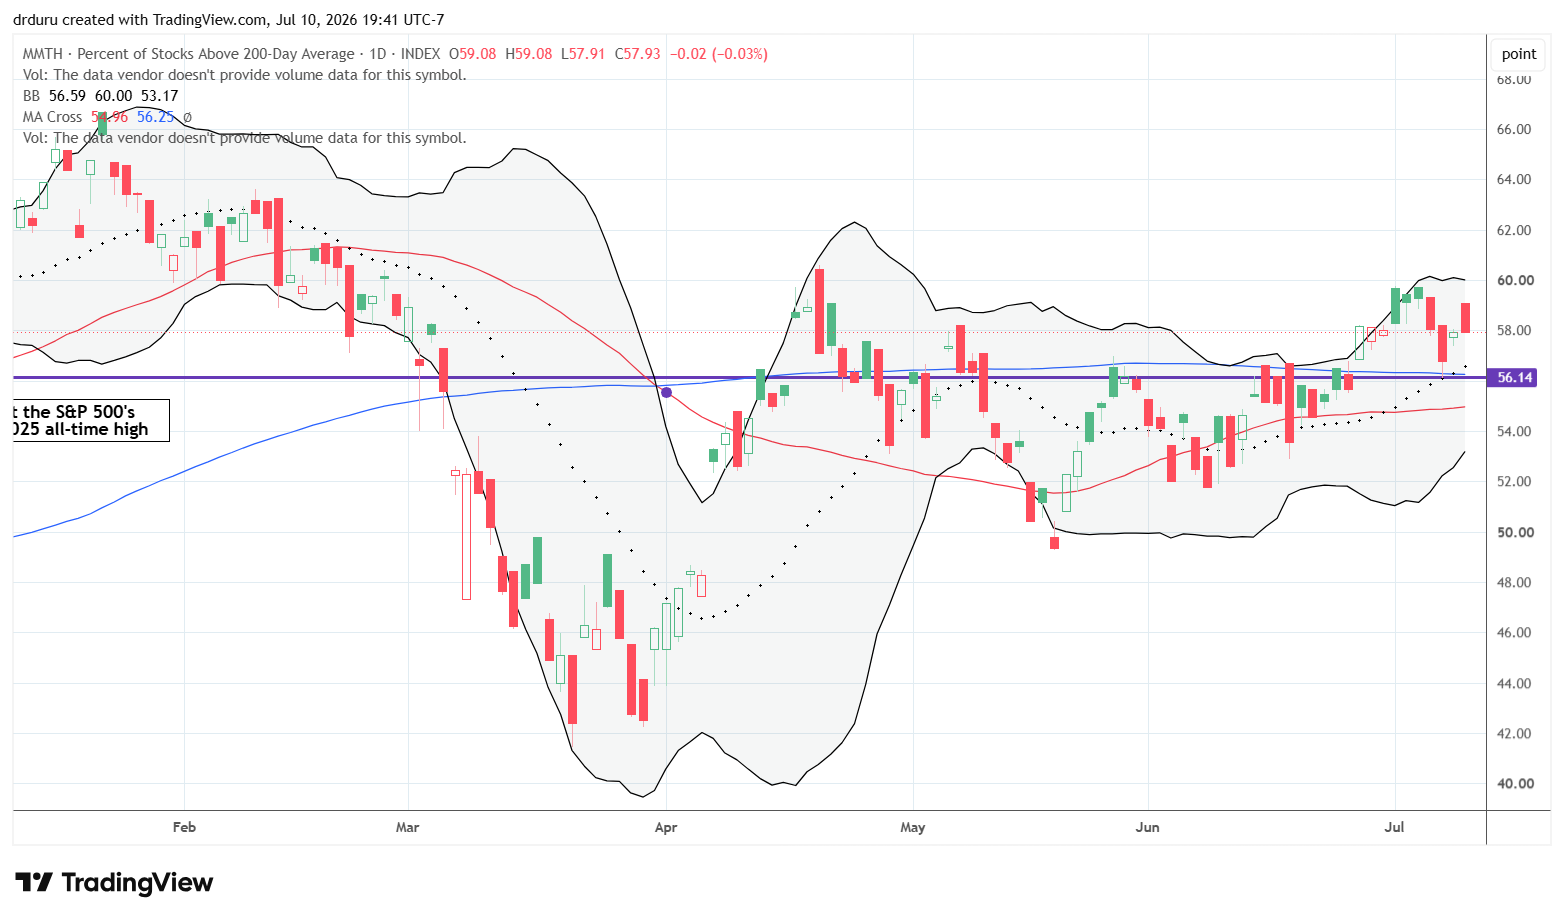
- AT200 (MMTH) = 57.9% of stocks are trading above their respective 200-day moving averages
- Short-term Trading Call: cautiously bullish
AT50 (MMFI), the percentage of stocks trading above their respective 50DMAs, closed the week at 58.4%. AT50 continued to hang above the 50% level and is churning as I hoped. There is no signal here except that the bearish phase of market breadth is still over. However, once the major indices hit new all-time highs, I want to see AT50 trending upward to confirm participation in the bullish move.
AT200, the percentage of stocks trading above their respective 200DMAs, closed the week at 57.9%. Like AT50, AT200 is also churning. I remain comfortable with the market breadth signal as long as AT200 stays above its approximately 56% cycle pivot or support level.
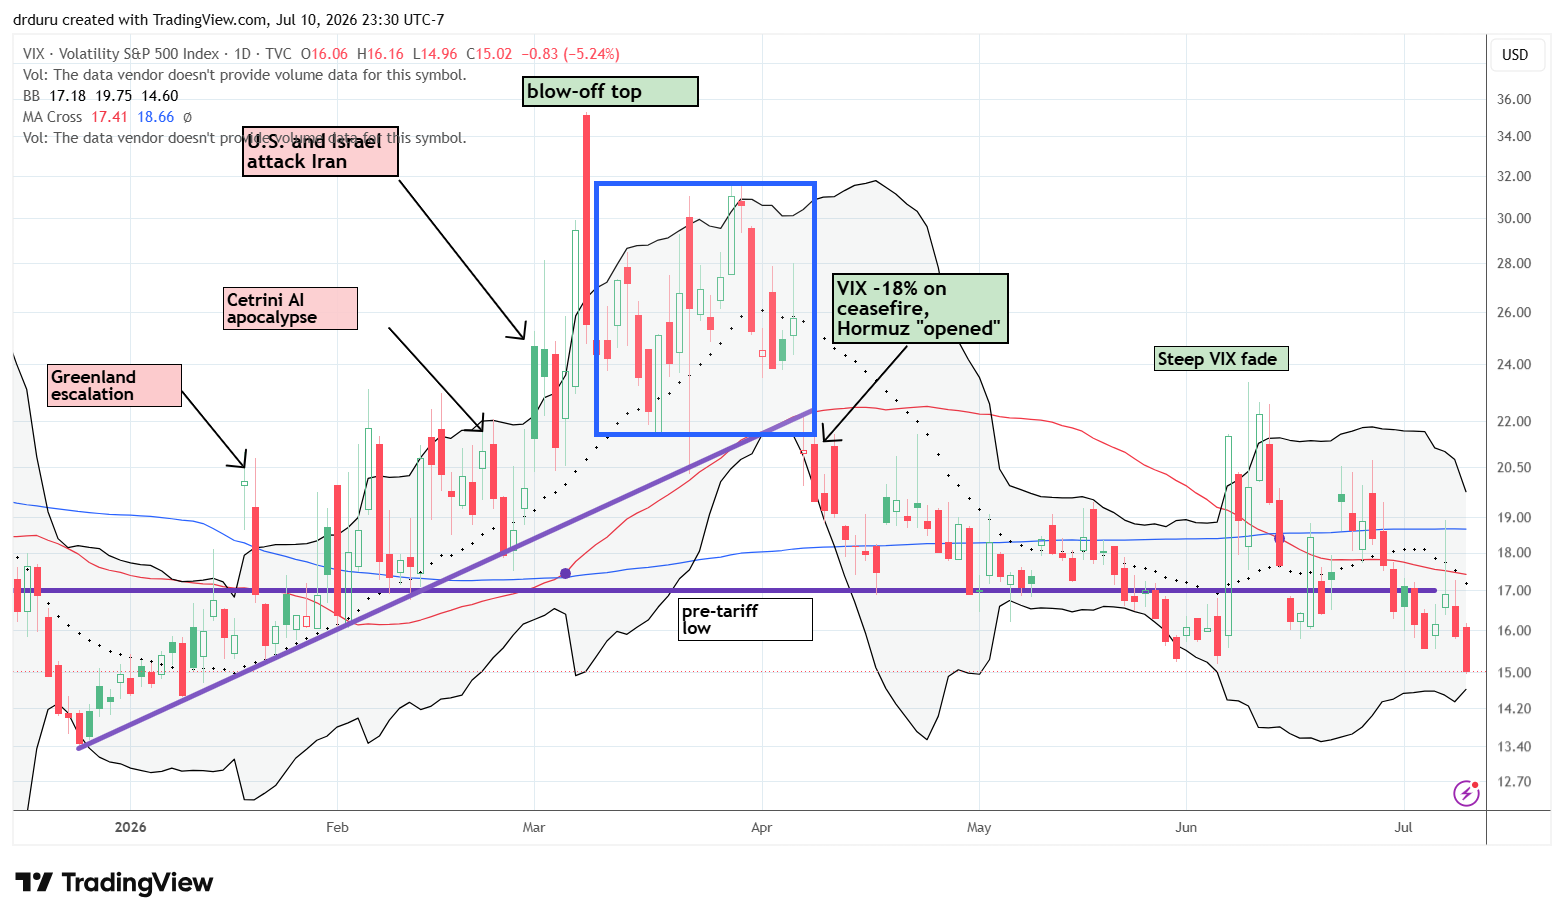
The volatility index (VIX) confirmed the market’s bullishness (complacency) with its fourth lowest close of the year. The VIX closed at 15.02, a near low for the year that minimizes everything the market has experienced in 2026 in the rear view mirror. While this fresh breakdown in the VIX supports a bullish environment, the move also creates fragility. As soon as the market receives bad news that investors care about, the VIX will likely spike along with a sharp dislocation in the stock market. Such a mini-shock occurred on June 5th when an unexpectedly strong jobs report sent worried sellers scurrying to get ahead of higher interest rates.
In case you missed it…
Last week I realized that retailer TJX Companies (TJX) had weakened again. I was surprised to see the stock fall so sharply from all-time highs with no direct news to explain the sudden shift in market sentiment. Intel Corporation (INTC) created a classic bottoming pattern, but the stock needs to confirm the bottom with a fresh 50DMA breakout.
The Equities
United States Oil Fund (USO)
Description: The United States Oil Fund is an exchange-traded commodity pool designed to reflect daily percentage changes in the spot price of light sweet crude oil through a benchmark oil futures contract, collateral interest, and expenses.
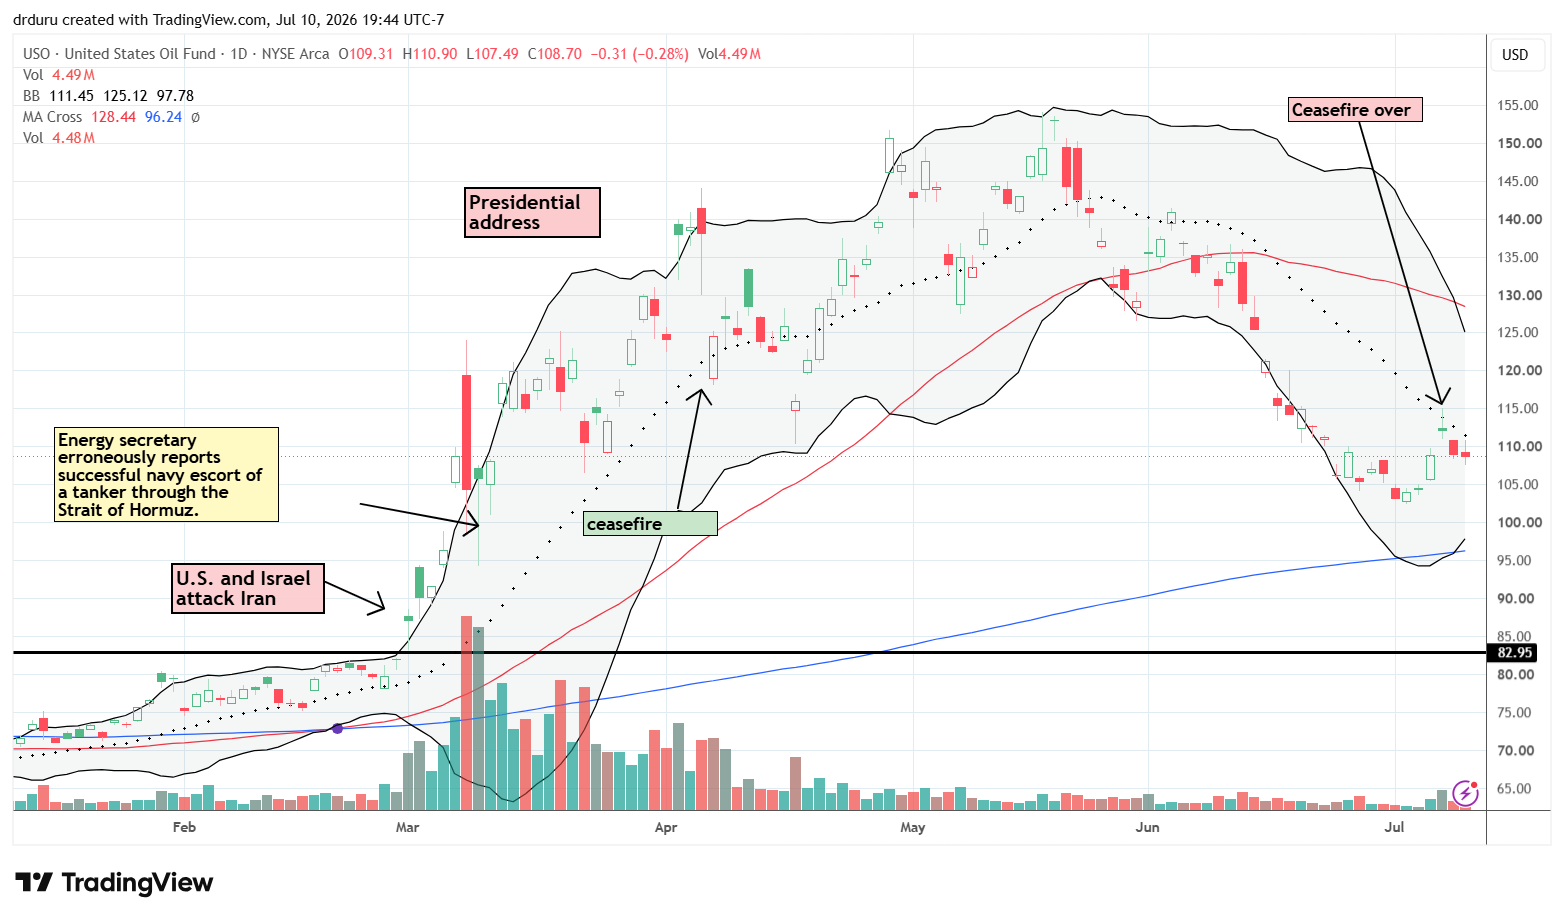
Technical status: The United States Oil Fund (USO) rebounded after falling almost straight down from the middle of May through early July. The declining 20DMA held as resistance for three consecutive sessions.
Trade commentary: I find it remarkable that a market as large as oil can still be traded from technical levels through a proxy such as USO. The renewed war initially pushed oil higher, but repeated resistance at the downtrending 20DMA suggested that the market had already started caring less about the rebound. The price action also suggested that traders still anticipate lower oil prices in the future. Still, with persistent selling in oil apparently over for now, the commodity could become a more direct catalyst in certain trades.
iShares 20+ Year Treasury Bond ETF (TLT)
Description: The iShares 20+ Year Treasury Bond ETF seeks to track an index of U.S. Treasury bonds with remaining maturities greater than 20 years.
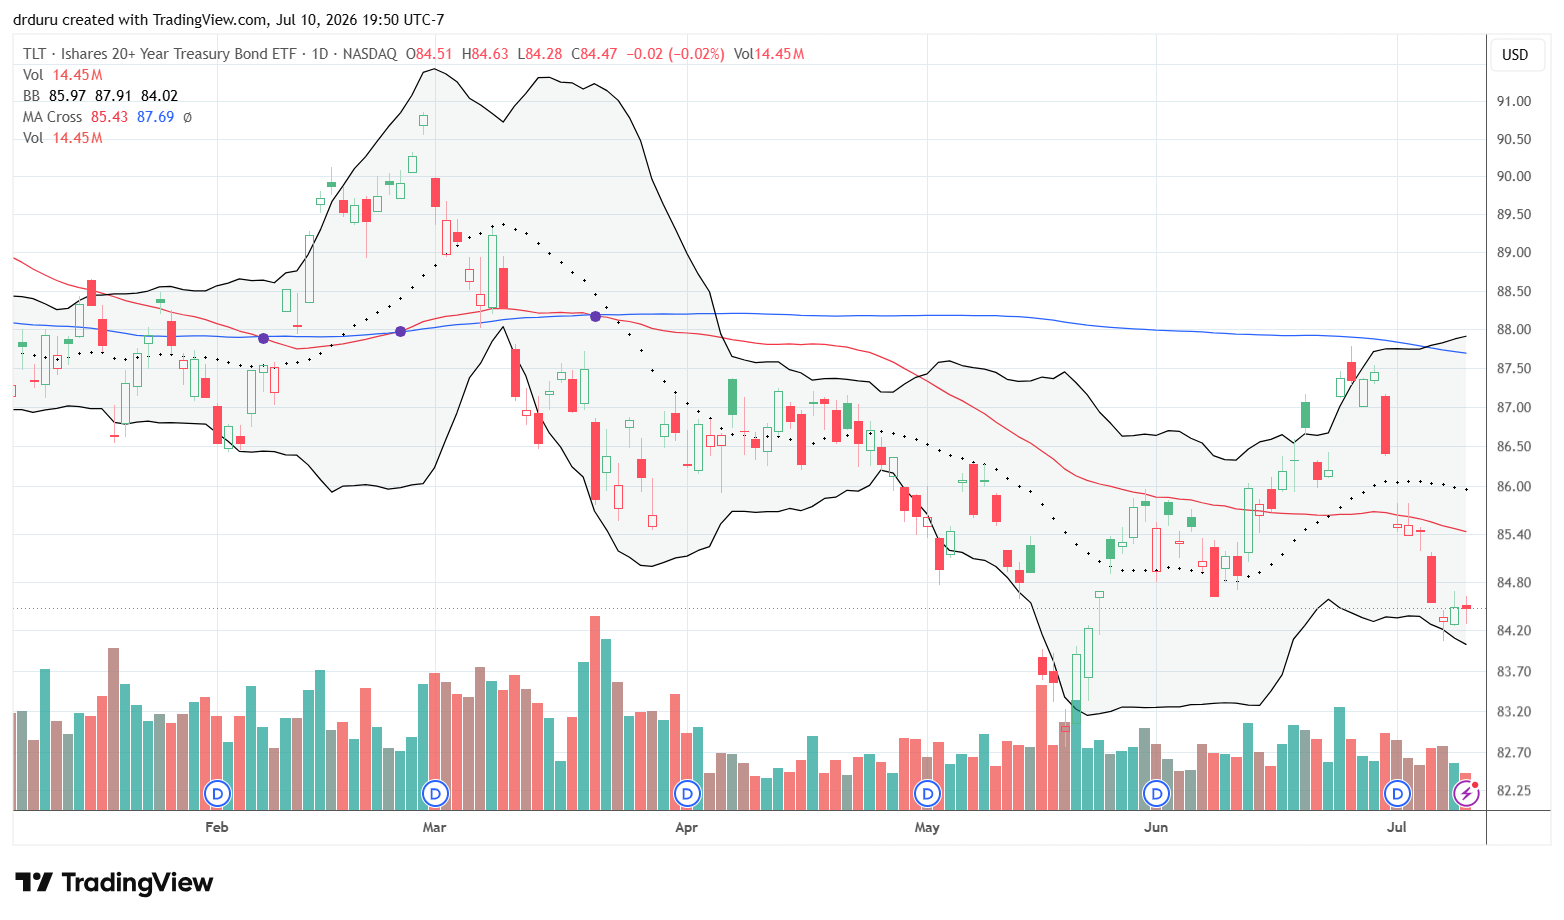
Technical status: The iShares 20+ Year Treasury Bond ETF (TLT) fell toward the lows it reached in May when oil was near its peak. Lower bond prices reflected rising long-term yields.
Trade commentary: Higher oil prices brought inflation concerns back to the fore, but TLT was already declining sharply (lower prices equals higher yields). Given the muted response to the official resumption of war, I suspect the ETF is near the lower end of its decline. I remain concerned about inflation, but the bond market appears to be the only part of the market that cares at all.
Brinker International (EAT)
Description: Brinker International owns, operates, and franchises casual-dining restaurants under the Chili’s Grill & Bar and Maggiano’s Little Italy brands.
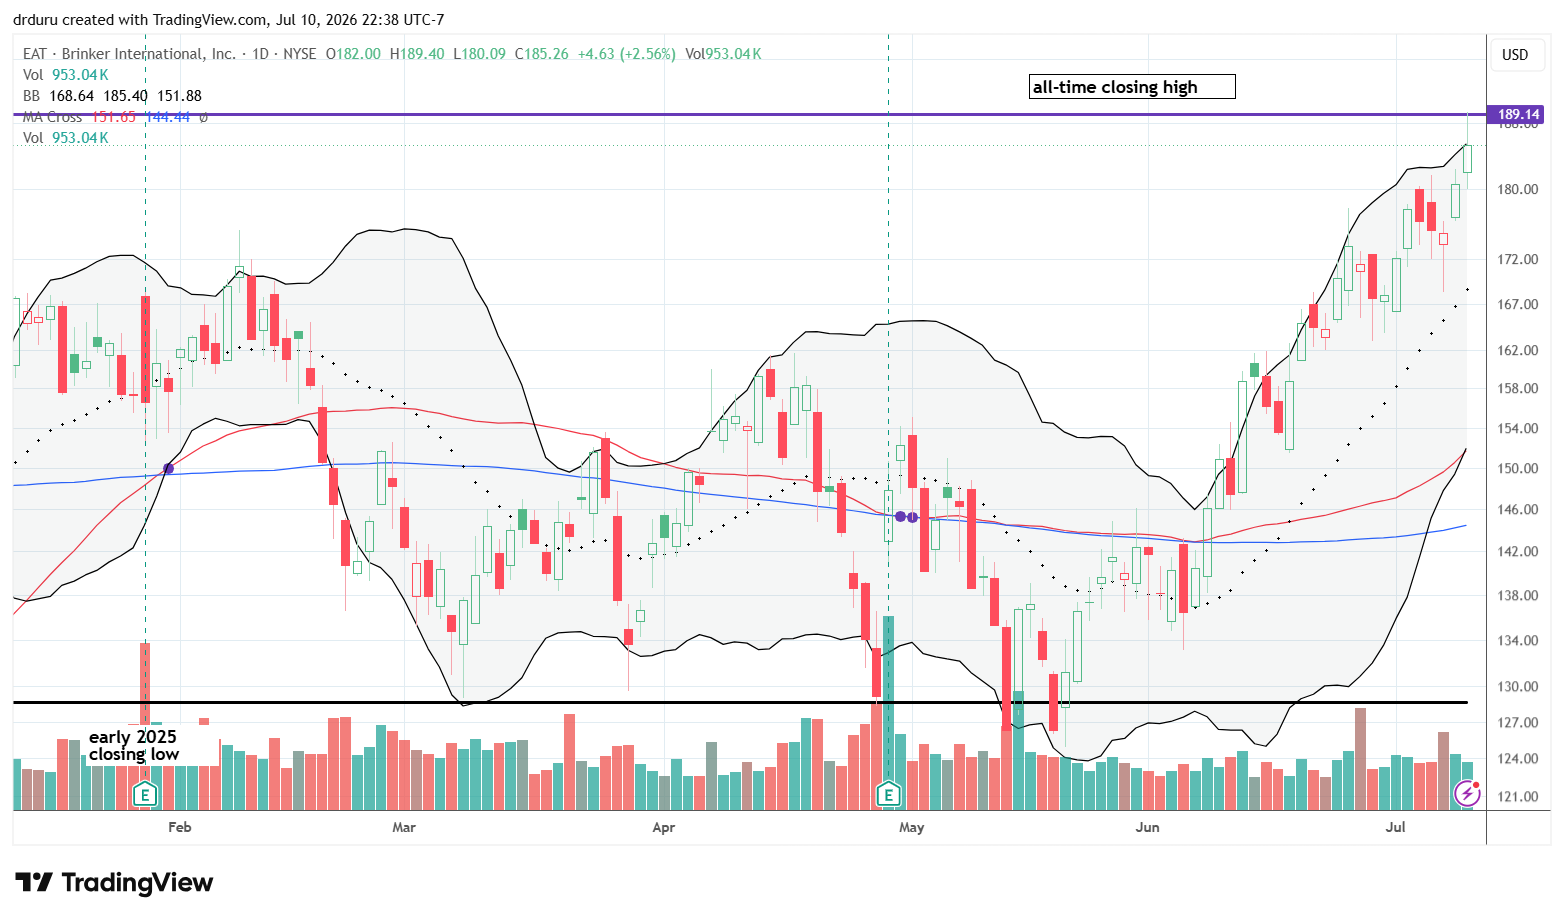
Technical status: Brinker International (EAT) trended almost straight upward after oil peaked, despite several sharp one-day and two-day pullbacks. The stock perfectly faded from the $190 all-time closing high.
Trade commentary: I previously worried that high oil prices would pinch consumer wallets and hurt discretionary spending. EAT began a fresh rally after oil peaked in May. The advance was a bit subtle given the amount of churn. Still, EAT last touched its uptrending 20DMA in early June and only Friday ran into serious trouble after fading perfectly from its all-time closing high around $190.
DoorDash (DASH)
Description: DoorDash operates a local-commerce platform that connects consumers with restaurants, grocery stores, retailers, and delivery providers.
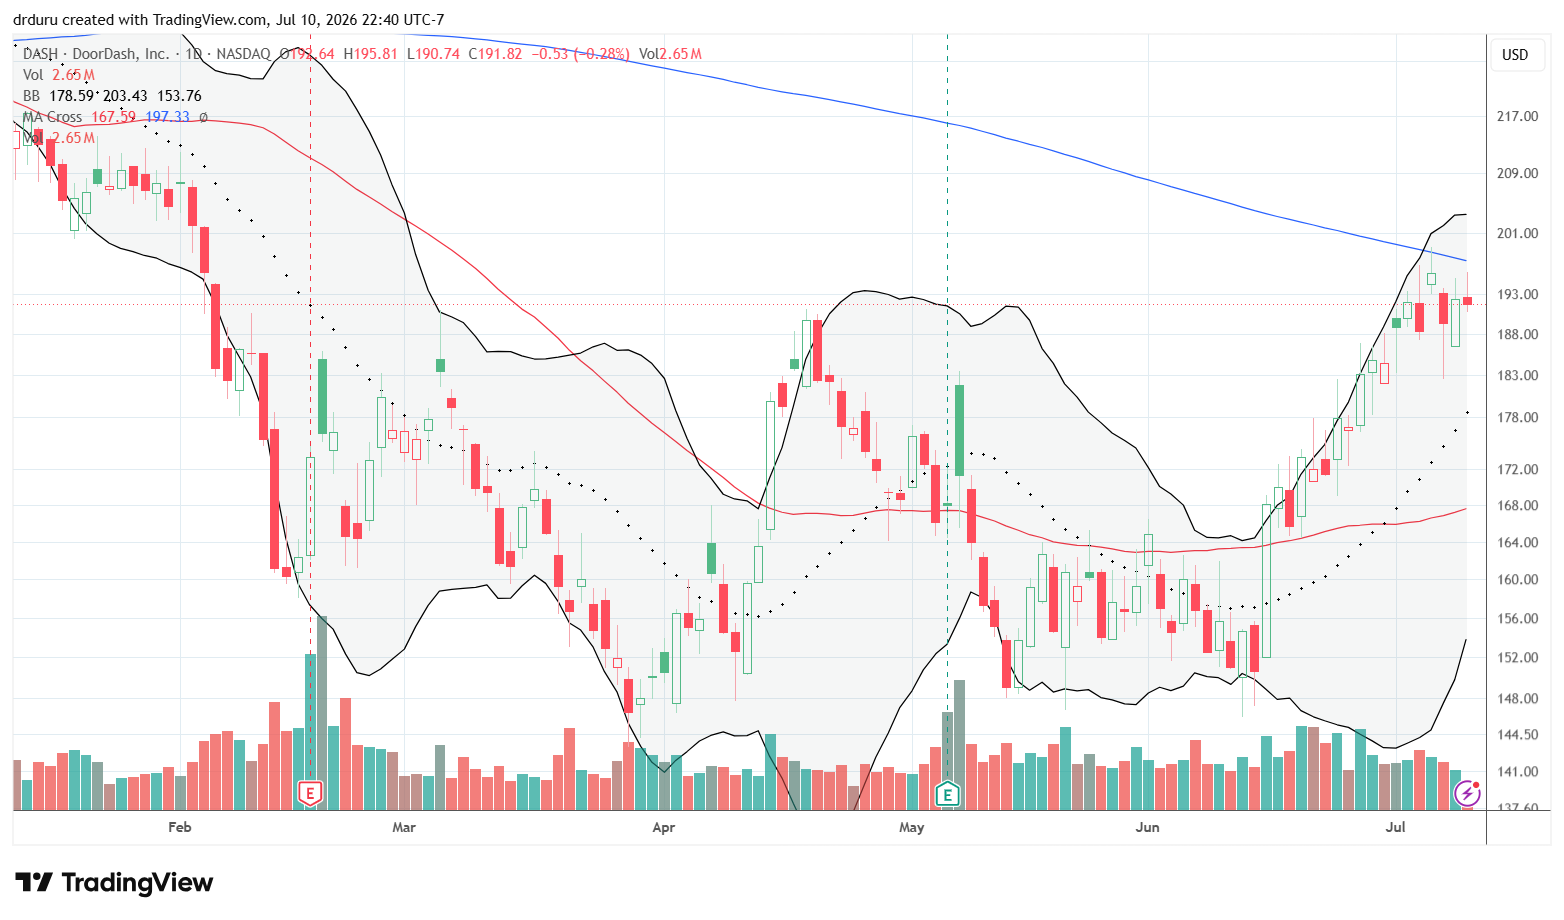
Technical status: DoorDash (DASH) formed what looks like a triple bottom across its March, May, and June lows. The 200DMA held as overhead resistance all week.
Trade commentary: I think of DoorDash as a luxury brand for the common consumer. The convenience is valuable, but I expect consumers to pull back when financial pressures increase. That expectation did not play out for years because DASH remained remarkably resilient after its 2023 bottom. However, the stock has acted broken since its 17.5% post-earnings breakdown in November 2025. I owned DASH during the recent rebound and sold the position at 200DMA resistance. I am watching for a breakout that would return the stock to bullish territory and signal the market’s comfort with the condition of consumer.
Costco Wholesale Corporation (COST)
Description: Costco Wholesale Corporation operates membership warehouses and e-commerce websites that sell a limited selection of nationally branded and private-label products.
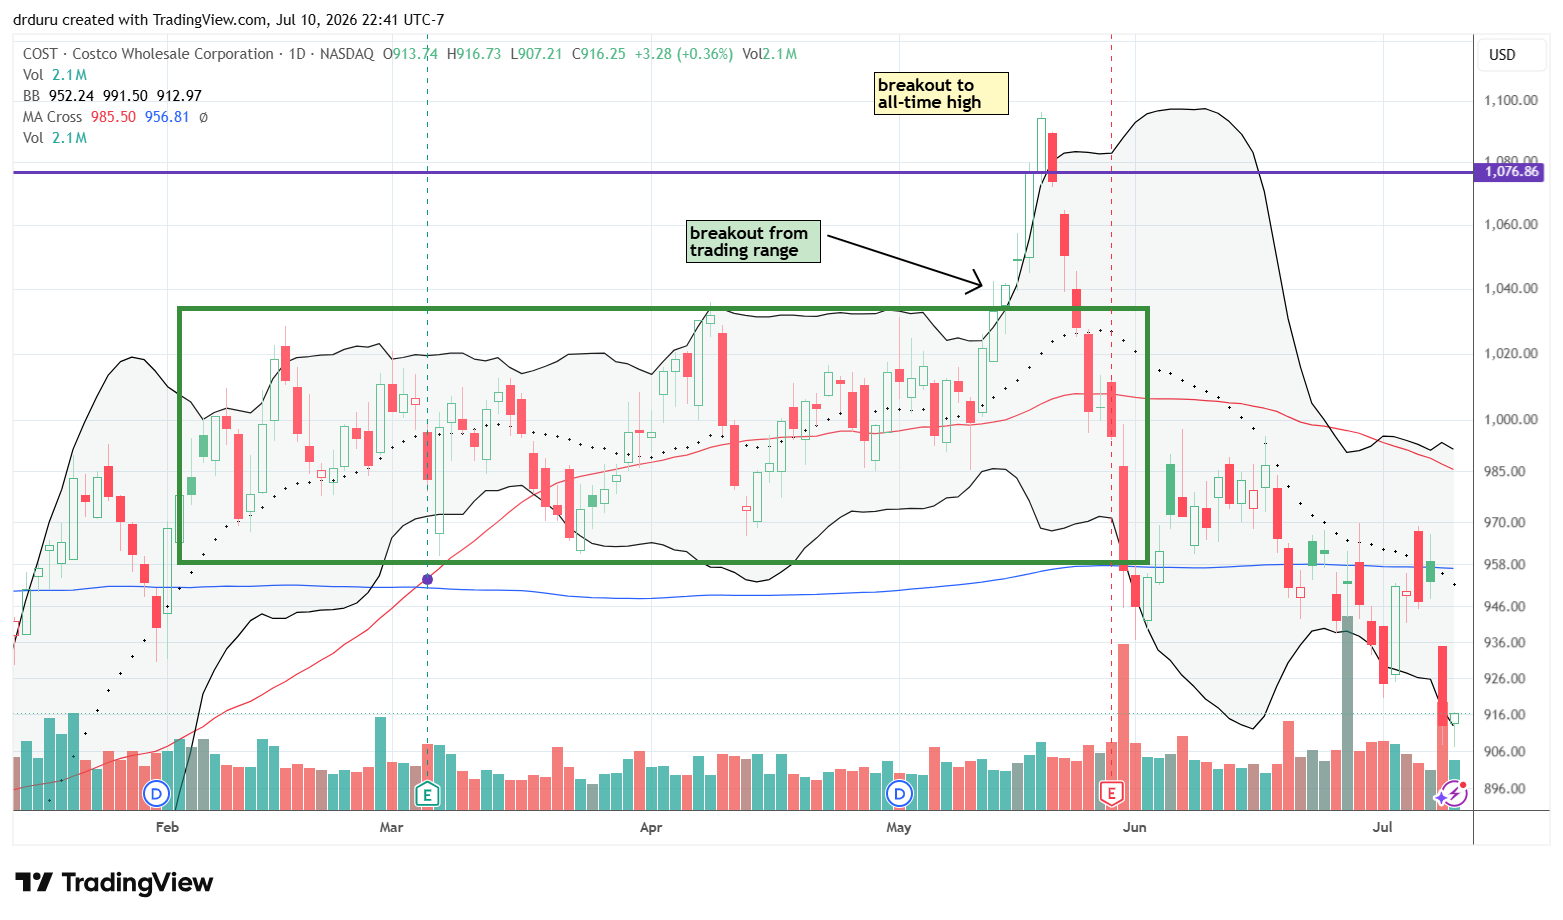
Technical status: Costco Wholesale (COST) broke below its 200DMA and appears ready to retest the lows from late last year.
Trade commentary: I am surprised and troubled by the latest COST breakdown. I cannot connect the decline cleanly to the broader macro themes. However, as a stock with a high valuation, sales data has apparently underwhelmed investors. The move below the 200DMA emphasized how thoroughly the near-parabolic advance to the all-time high turned into a false breakout. COST fell almost straight from near $1,100 to roughly $900, a decline approaching bear-market territory when measured from the peak.
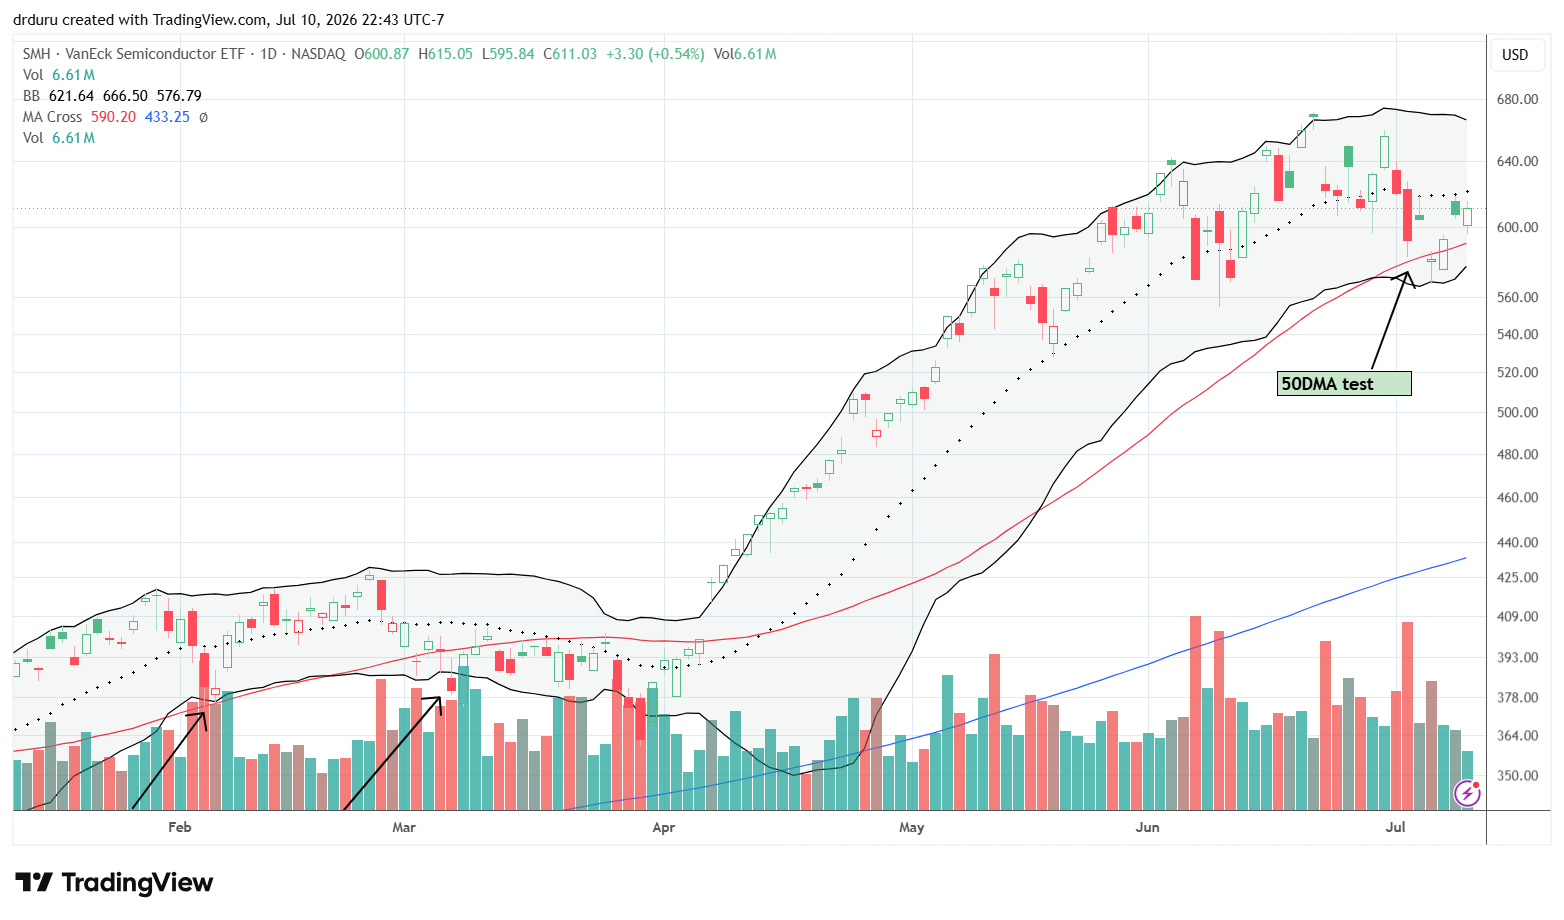
VanEck Semiconductor ETF (SMH)
Description: The VanEck Semiconductor ETF seeks to track companies involved in semiconductor production and semiconductor equipment.
Technical status: VanEck Semiconductor ETF (SMH) briefly broke below its 50DMA, recovered that support, and then stalled at its 20DMA. SMH remains bullish and has not confirmed a breakdown.
Trade commentary: I thought SMH was preparing to roll over when it lost 50DMA support, but buyers recovered the breakdown. The recovery kept the broader semiconductor trade intact even as several individual names produced weaker signals. Note well that the six straight days under its 20DMA is SMH’s longest streak since April’s breakout.
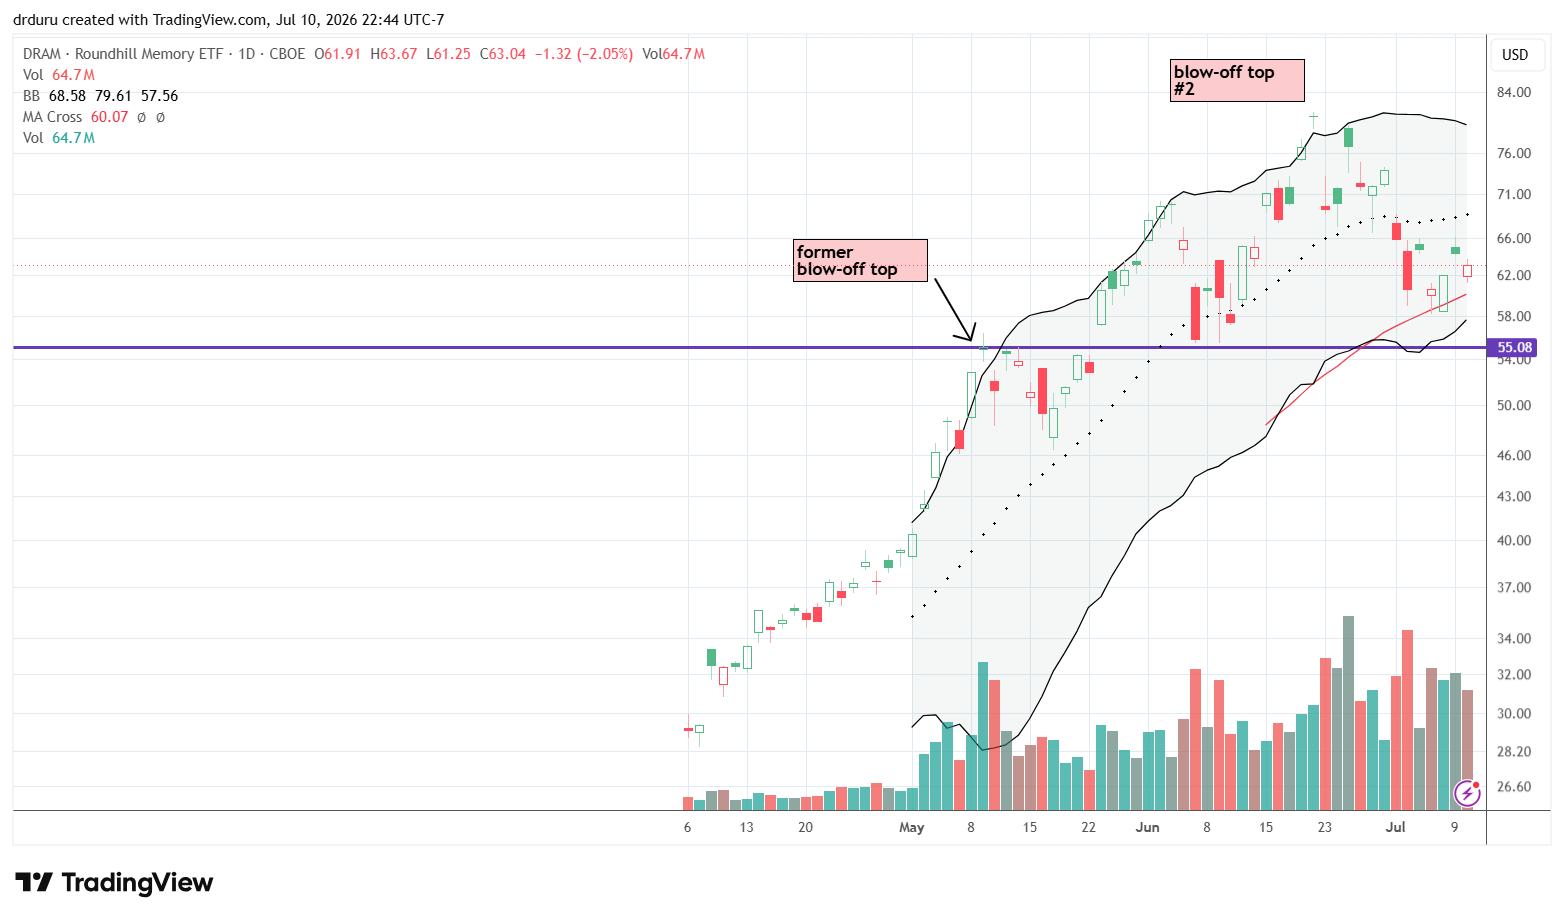
Roundhill Memory ETF (DRAM)
Description: The Roundhill Memory ETF provides exposure to global companies involved in memory chips and storage technologies.
Technical status: Roundhill Memory ETF (DRAM) held 50DMA support and continued to trade similarly to the broader semiconductor sector.
Trade commentary: DRAM has provided a strong trade from its support levels. I bought Tuesday’s test of 50DMA support as a speculative, swing trade. I took profits on Thursday’s small gap higher. DRAM has traded in gaps since May, but the recent swings between 20DMA resistance and 50DMA support signal a growing fragility in the trade.
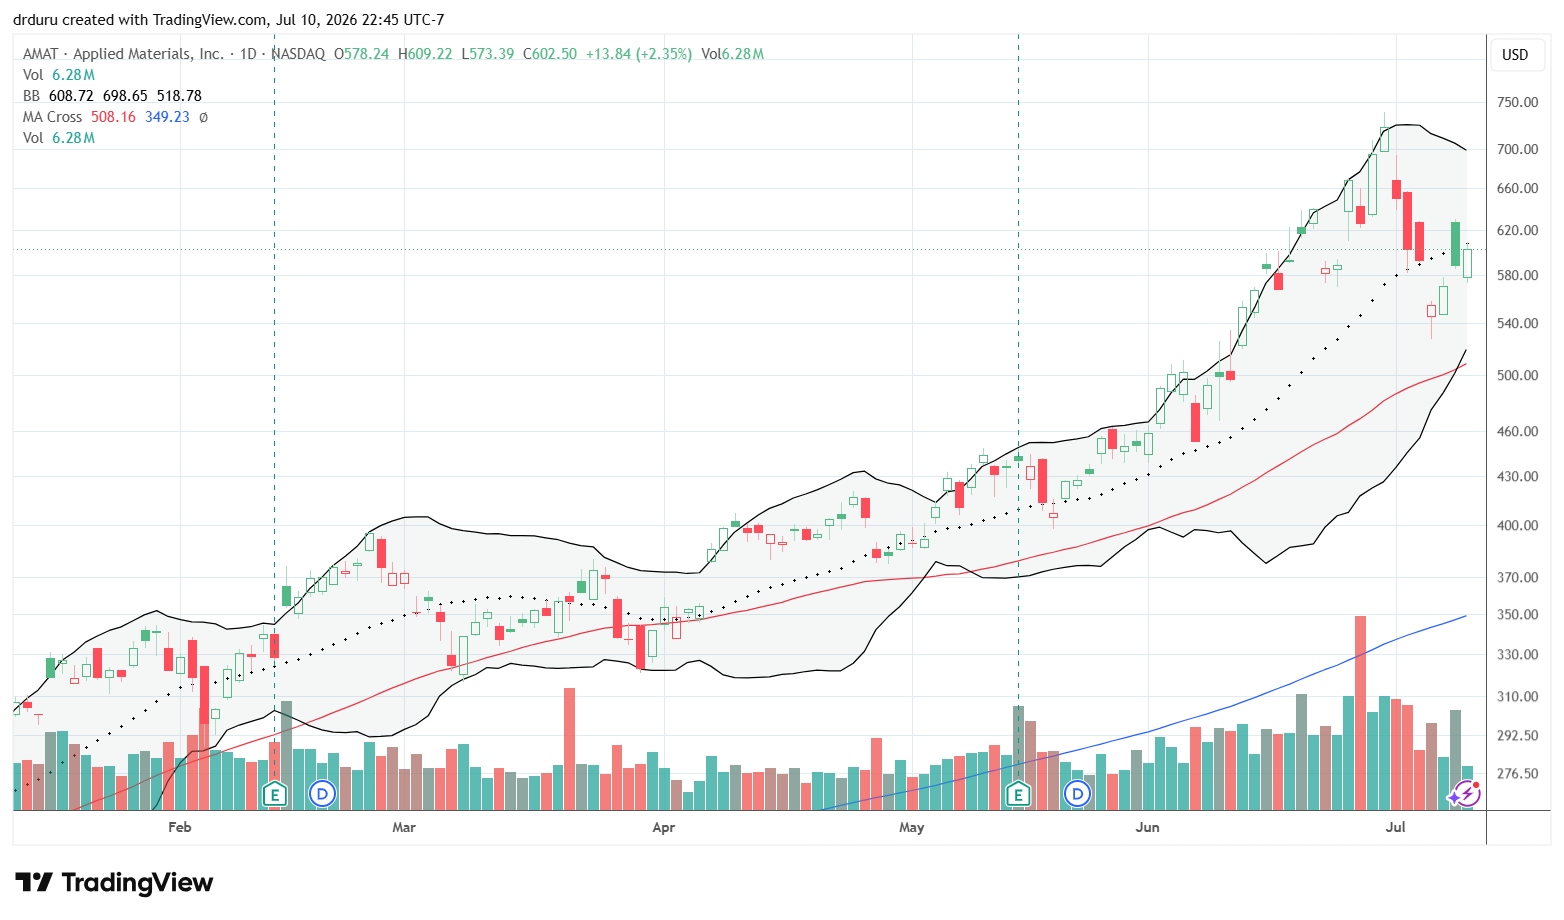
Applied Materials (AMAT)
Description: Applied Materials designs, builds, and services manufacturing equipment for the semiconductor and display industries.
Technical status: Applied Materials (AMAT) fell 6.6% during the July 7 selloff, rebounded 2.9% the following day, and then produced a large gap higher that faded.
Trade commentary: AMAT demonstrated the violent back-and-forth movement that concerns me in the AI trade. The July 7 decline occurred without meaningful company-specific news as profit-taking swept across most of the semiconductor market associated with the AI trade. The next two sessions produced a rebound and a gap higher that sellers quickly challenged with a fade. Still, I am interested in buying AMAT on a test of 50DMA support.
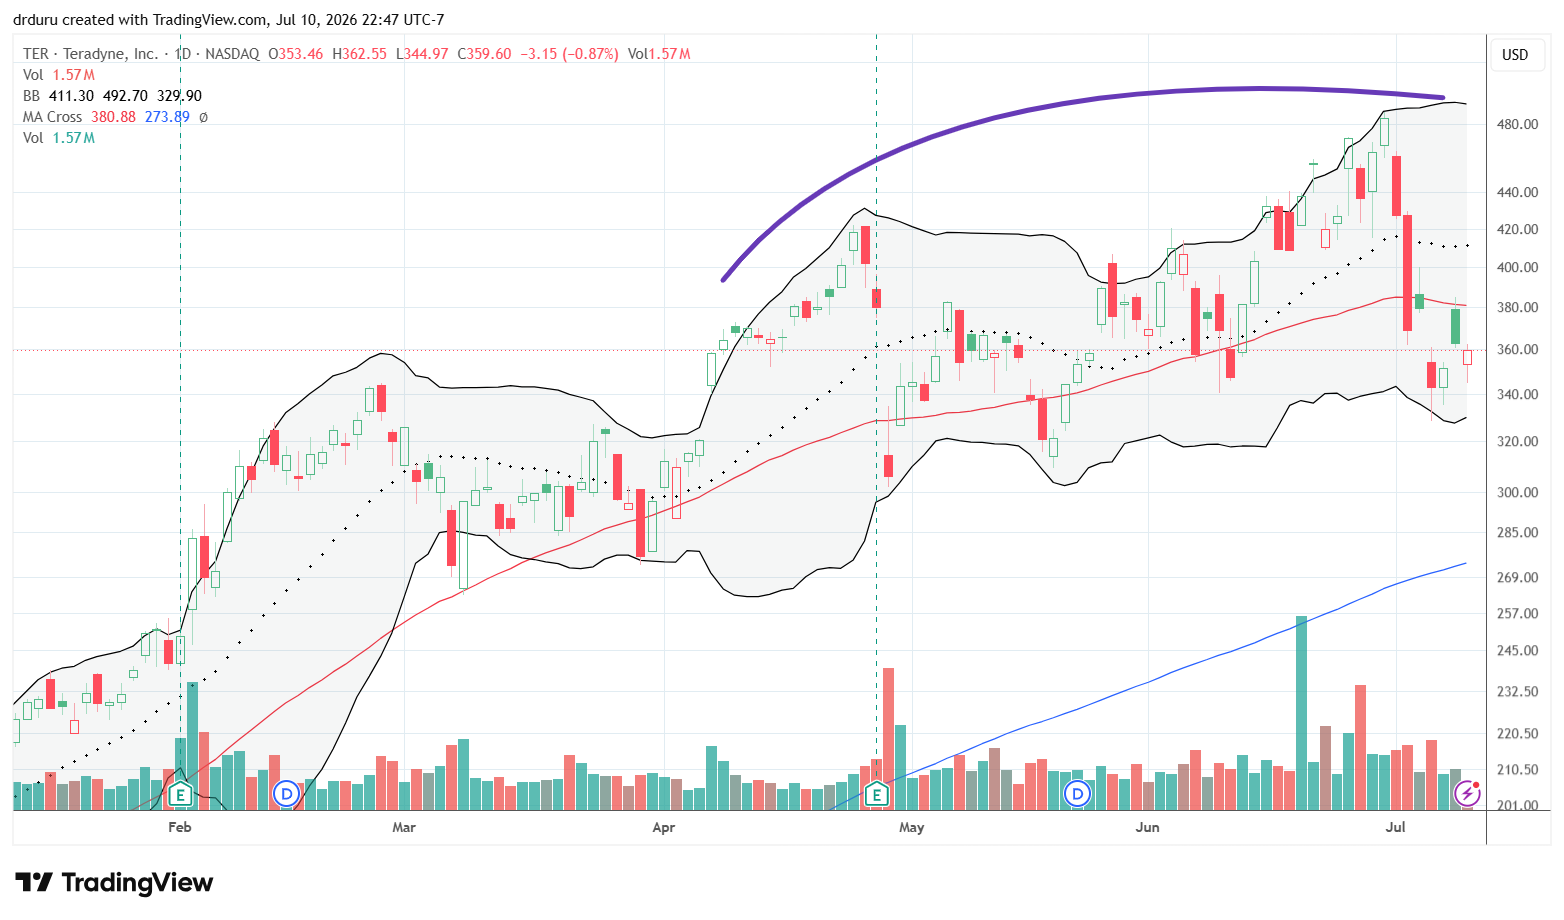
Teradyne, Inc (TER)
Description: Teradyne, Inc designs, develops, and manufactures automated test equipment and advanced robotics systems used to validate the functionality, quality, and performance of chips before they are shipped to customers.
Technical status: Teradyne (TER) broke below its 50DMA after repeatedly losing and recovering that support since March. TER looks toppy since before the recent pattern, the stock had not traded below its 50DMA since May 2025.
Trade commentary: I see TER as a possible rollover candidate in the semiconductor space. The stock survived several prior 50DMA breakdowns, but I question how many times buyers can continue these rescue efforts. The repeated failures may represent the beginning of a broader topping process. The curved purple line highlights the potential rounding out in the stock.
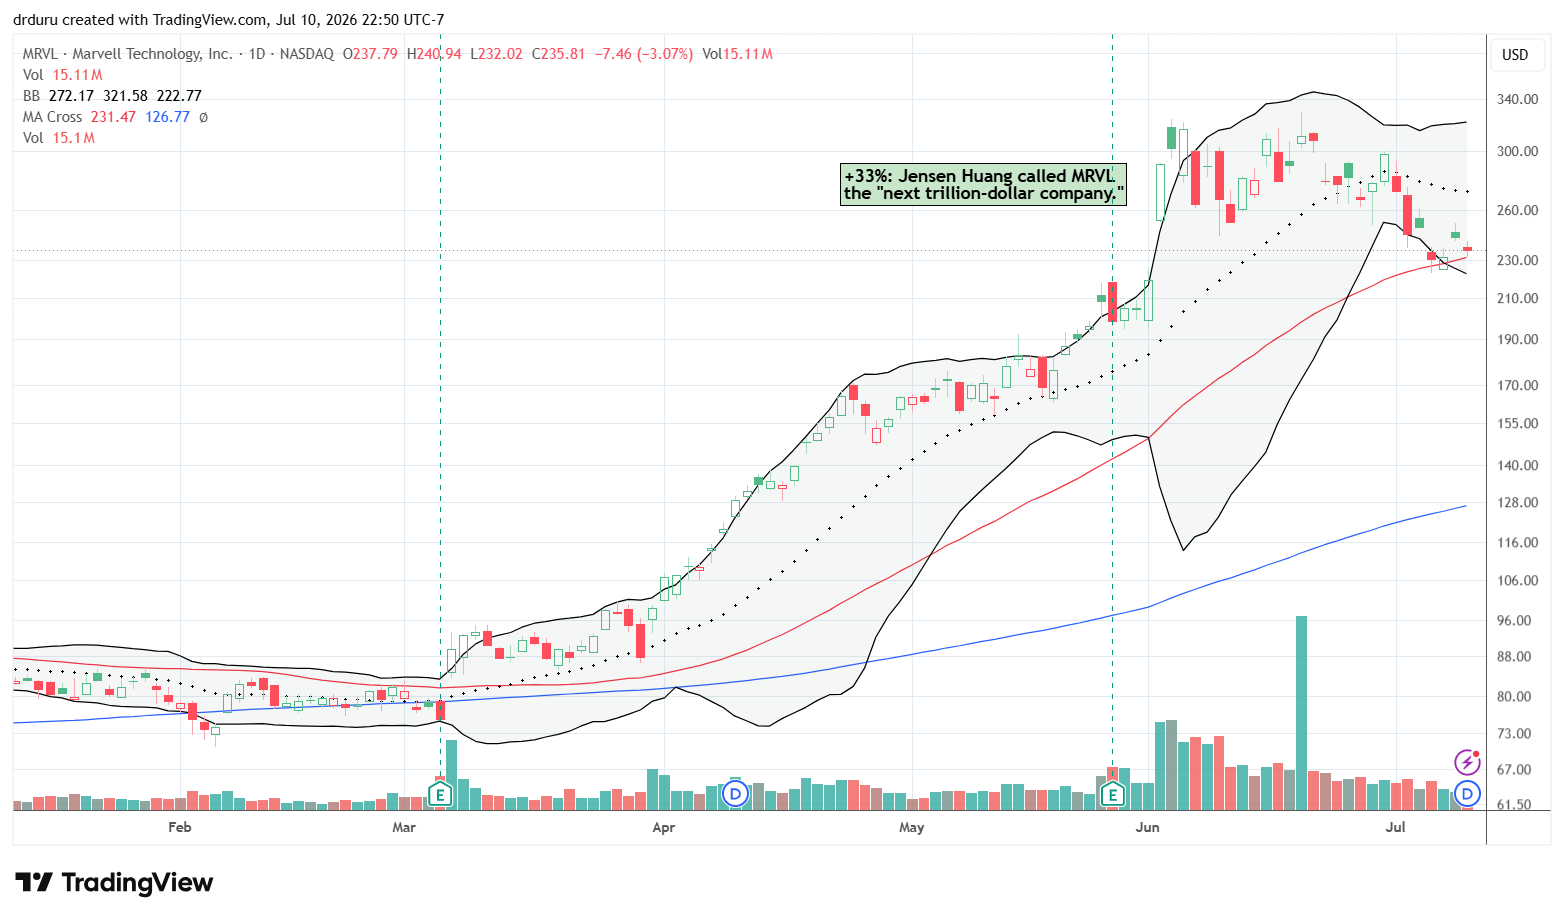
Marvell Technology (MRVL)
Description: Marvell Technology supplies data-infrastructure semiconductor products spanning compute, networking, security, and storage.
Technical status: Marvell Technology (MRVL) is clinging to 50DMA support while filling the gap created by its 33% surge following bullish commentary from Jensen Huang.
Trade commentary: I view MRVL as another critical semiconductor stock to watch for a breakdown. The early-June celebration followed Jensen Huang’s description of Marvell as a potential trillion-dollar company. (The stock currently has a $206B market cap). July’s pullback has nearly reversed all of the Huang-driven gains. A 50DMA breakdown would complete the reversal and set up a larger sell-off.
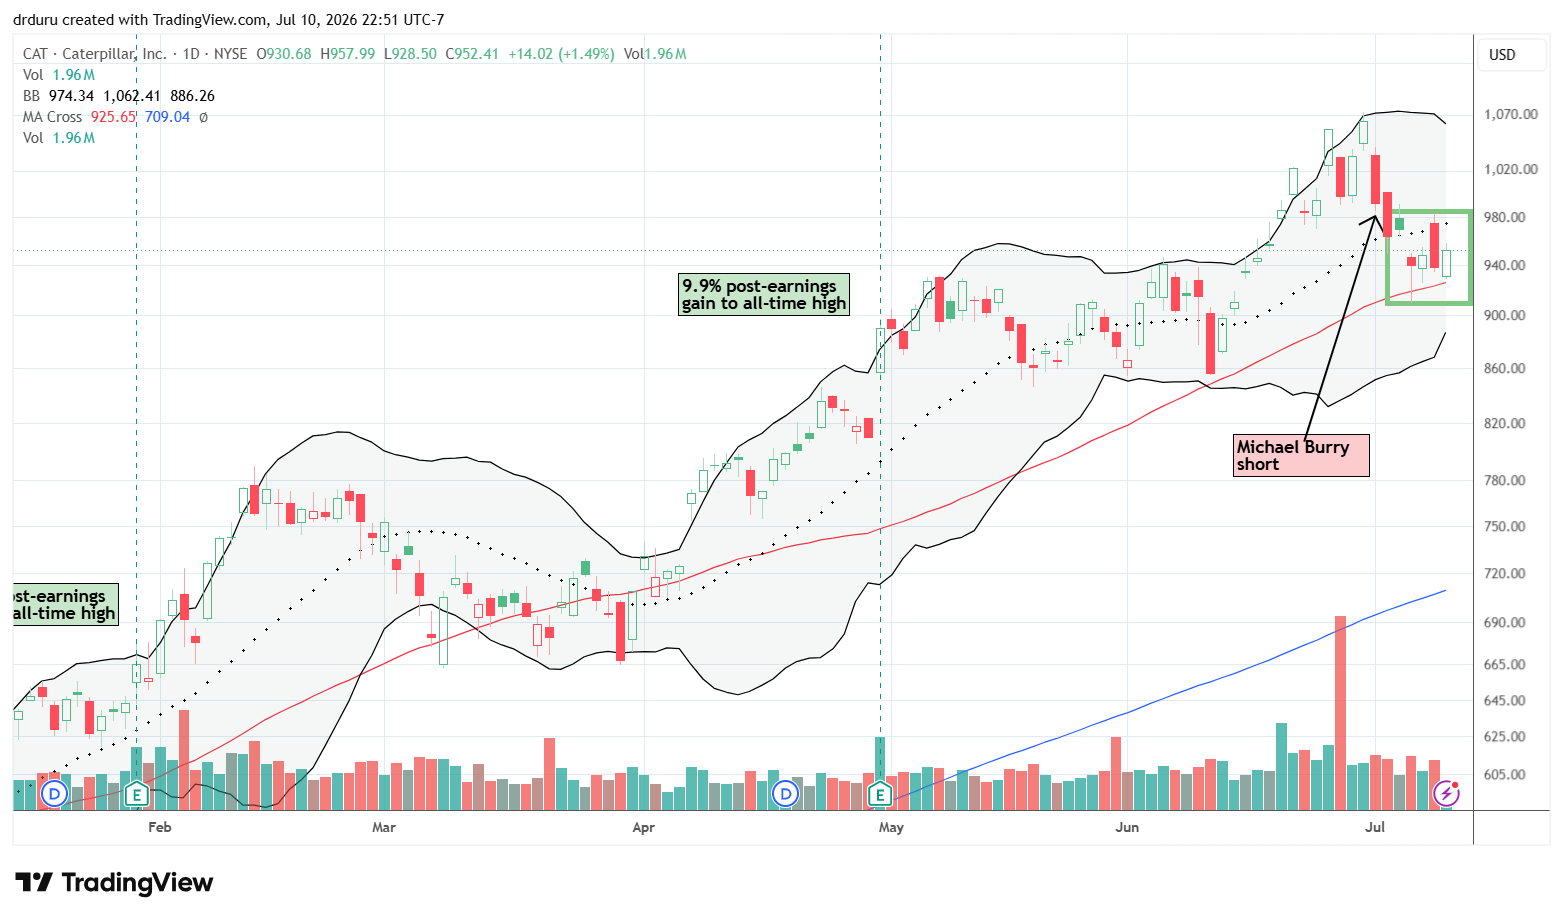
Caterpillar (CAT)
Description: Caterpillar manufactures construction and mining equipment, off-highway engines, industrial gas turbines, and diesel-electric locomotives.
Technical status: Caterpillar (CAT) fell 6.9% from its all-time high after Michael Burry disclosed a bearish position. CAT is now clinging to 50DMA support.
Trade commentary: CAT is an AI adjacent trade because data-center construction uses its heavy equipment, and the company’s generators provide readily available electric power. Yet, last week CAT caught Michael Burry’s attention as an over-valued beneficiary of the AI investment theme. CAT promptly dropped 6.9% on the news. The selling paused at 50DMA support where I bought a call spread to speculate on a technical bounce.
Burry also reemphasized his skepticism about valuations throughout the AI trade. CAT’s rapid response to his bearishness shined a brighter spotlight on the shaky perch underneath the AI trade.
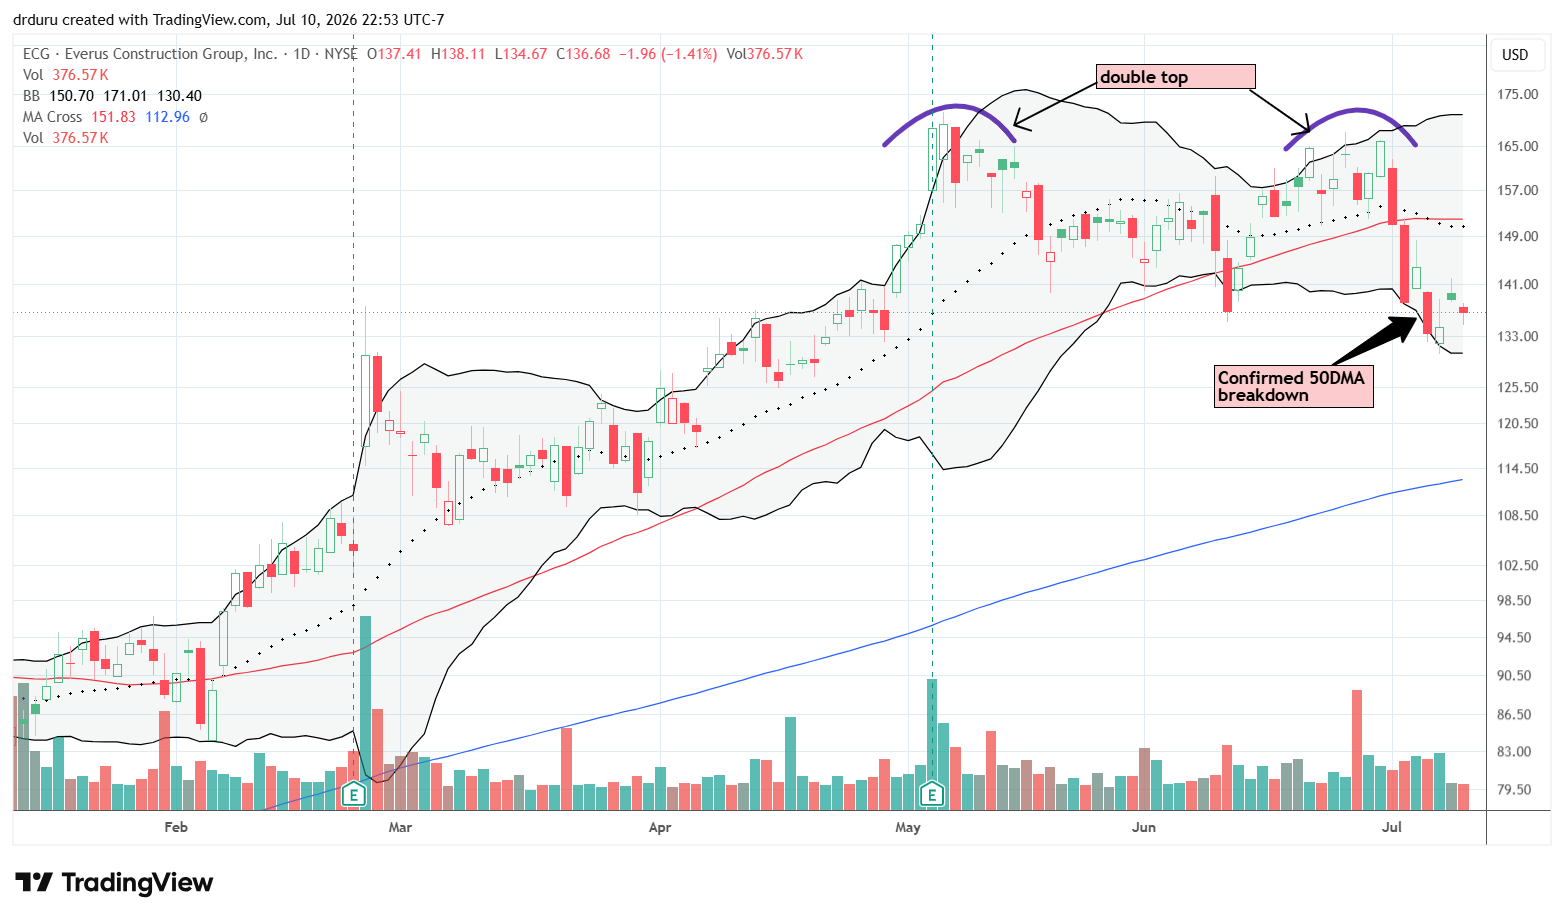
Everus Construction Group (ECG)
Description: Everus Construction Group provides electrical, mechanical, transmission, and distribution construction services across the United States.
Technical status: Everus Construction Group (ECG) confirmed a breakdown below its 50DMA and in turn confirmed a double top.
Trade commentary: I held ECG for several months after using the stock as a replacement for my even longer-term trade in Vertiv (VRT).The company’s construction work for electricity is important to the AI infrastructure buildout. However, I exited and protected my remaining profits when ECG confirmed a 50DMA breakdown last week. ECG is another AI-related trade looking topped out.
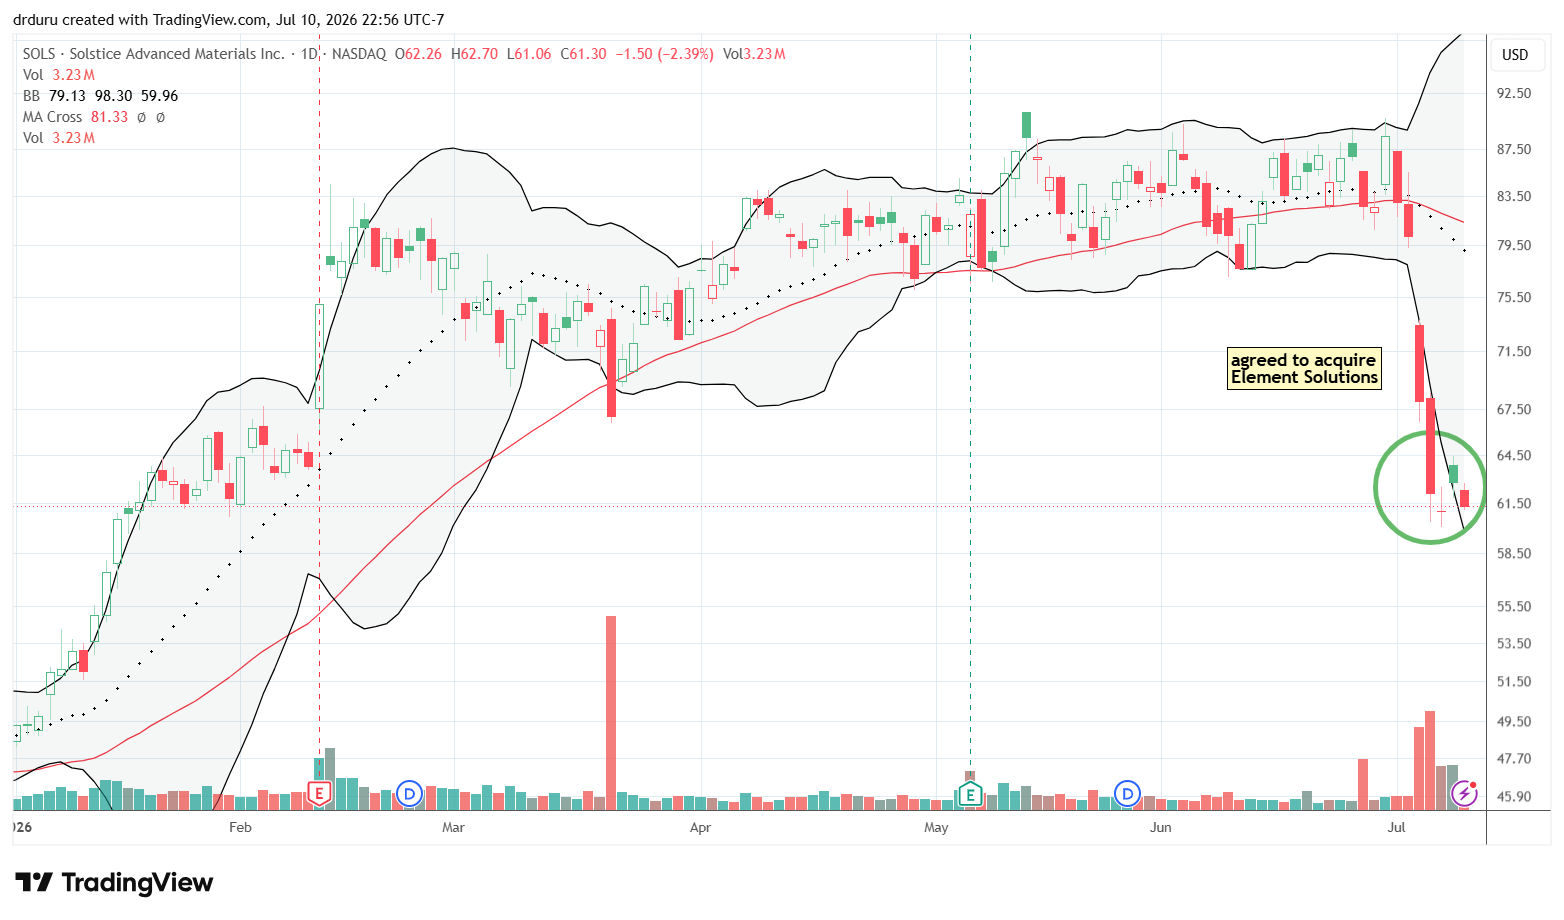
Solstice Advanced Materials (SOLS)
Description: Solstice Advanced Materials produces specialty chemicals and materials used in refrigerants, semiconductor manufacturing, data-center cooling, protective fibers, healthcare packaging, and other industrial applications.
Technical status: Solstice Advanced Materials (SOLS) fell approximately 15% after announcing its acquisition of ESI and dropped into bearish territory. Repeated rebounds from the intraday lows may represent the early formation of a bottom.
Trade commentary: I included SOLS to demonstrate what can happen when a company uses an expensive stock to acquire another company. The shares fell immediately and have not recovered from the offer to buy out Element Solutions (ESI). SOLS only began trading as an independent company late last year, so the large acquisition may have surprised investors who did not expect the company to pursue a major transaction so quickly. SOLS is now a broken AI-related stock.
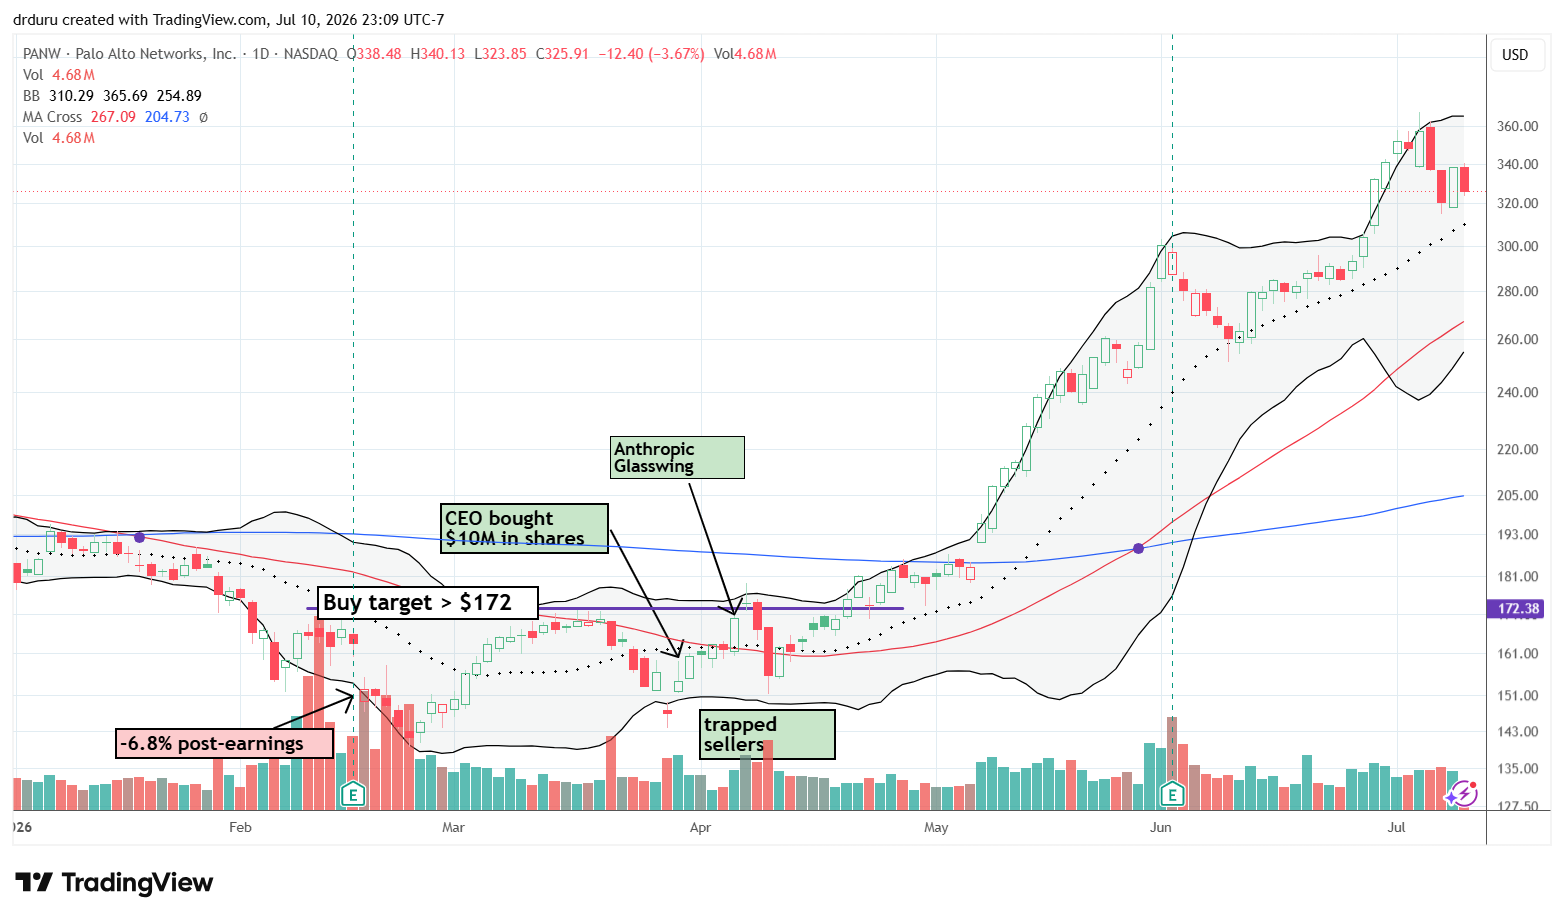
Palo Alto Networks (PANW)
Description: Palo Alto Networks provides cybersecurity platforms and cloud-based security services.
Technical status: Palo Alto Networks (PANW) reversed sharply from its all-time high with a 5.7% decline. Sellers continued applying pressure toward a test of 20DMA support.
Trade commentary: PANW has enjoyed such a strong run. After taking profits in late May as part of risk management, I was of course surprised to see the fresh breakout in June. Last week PANW cooled off enough for me to think the stock is ready to at least pause. For now, the uptrending 20DMA looks like support.
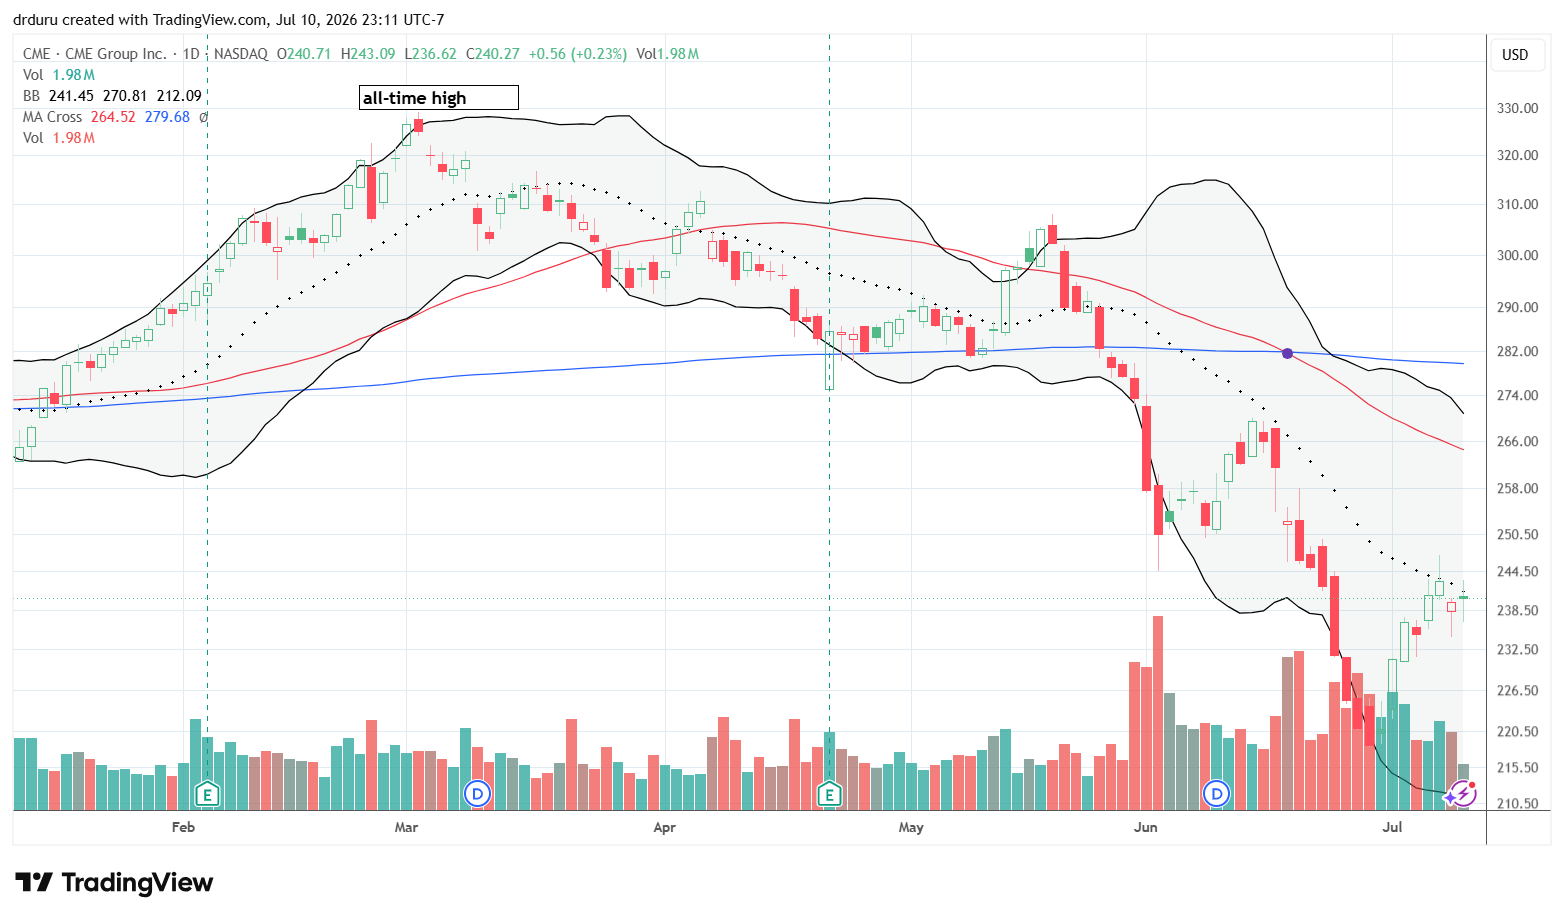
CME Group (CME)
Description: CME Group operates derivatives marketplaces for futures, options, cash, and over-the-counter products across major asset classes.
Technical status: CME Group (CME) remains in a bearish breakdown but may be starting to form a bottom if it breaks the 20DMA downtrend.
Trade commentary: CME was a strong long-term holding for me. A 4-month slide from all-time highs changed the setup. I invested in CME as a way to participate in the growth of financial products for trading, the expansion of markets that allow people to trade more outcomes, and, in earlier times, the way volatility increases trading activity. However, fears that perpetual futures will undermine CME’s business has pressured the stock. Regardless, I decided to bet on CME figuring things out and used June’s accelerated selling as an opportunity to grow my position. The company has even sued the CFTC over the legality of offering perpetual futures in the U.S.
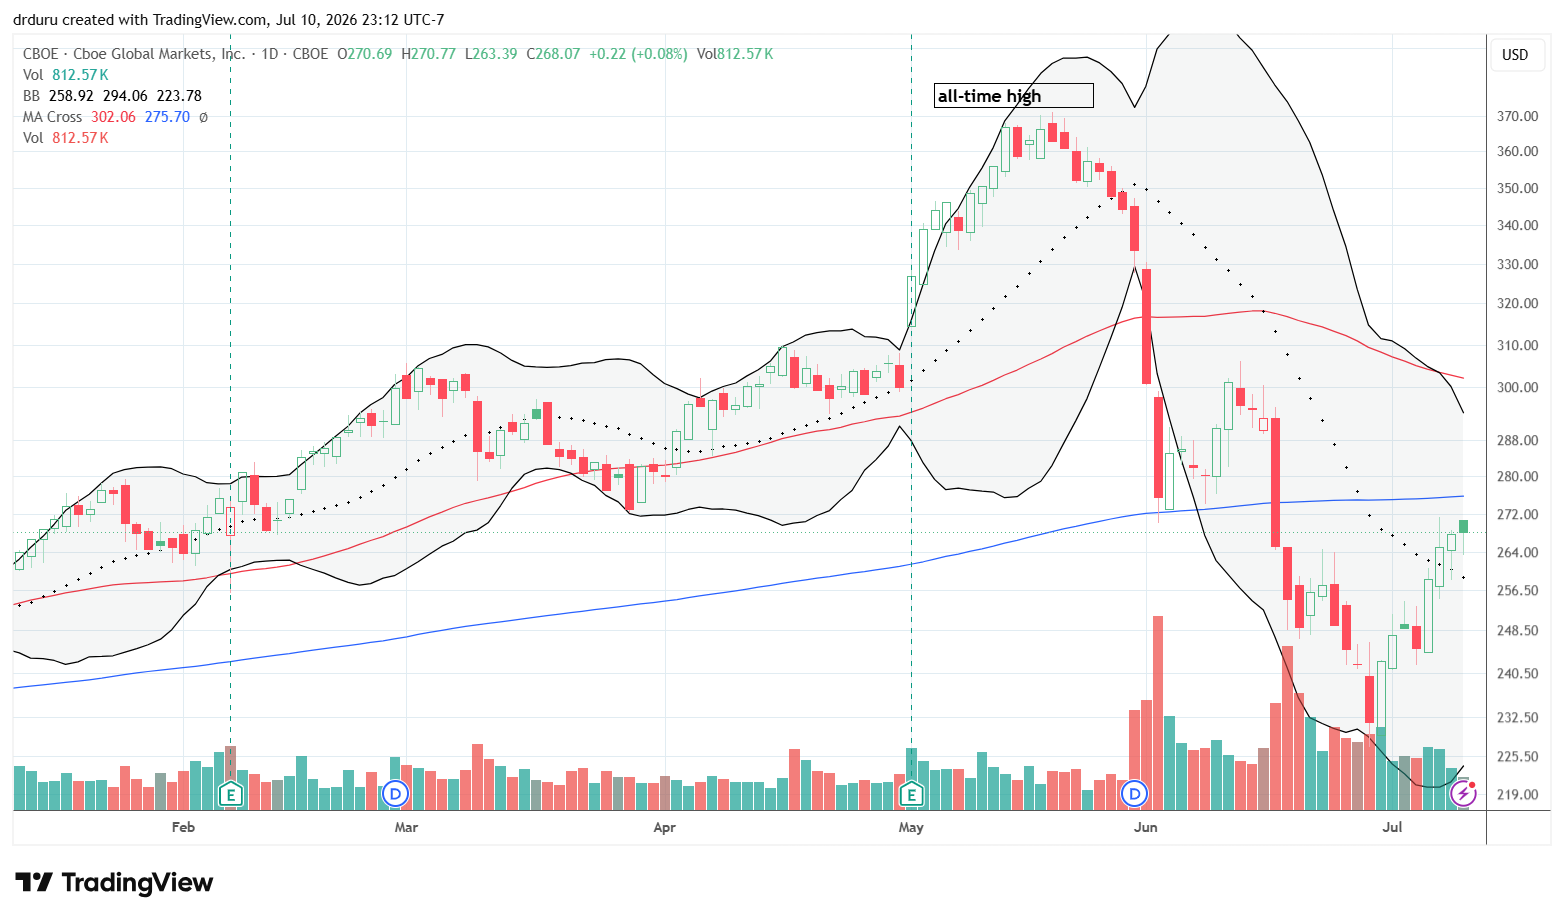
Cboe Global Markets (CBOE)
Description: Cboe Global Markets operates exchanges and market infrastructure for options, futures, cash equities, foreign exchange, clearing, and investment products.
Technical status: Cboe Global Markets (CBOE) declined sharply alongside CME and moved into bearish territory before a rebound to 200DMA resistance.
Trade commentary: CBOE enjoyed an even more convincing advance than CME before the recent breakdown. I have CBOE on my radar because I would like to use this sell-off to pair CBOE with CME. I will stay patient and wait for a close above 50DMA resistance. A 200DMA breakout is insufficient since the 50DMA is bending downward.
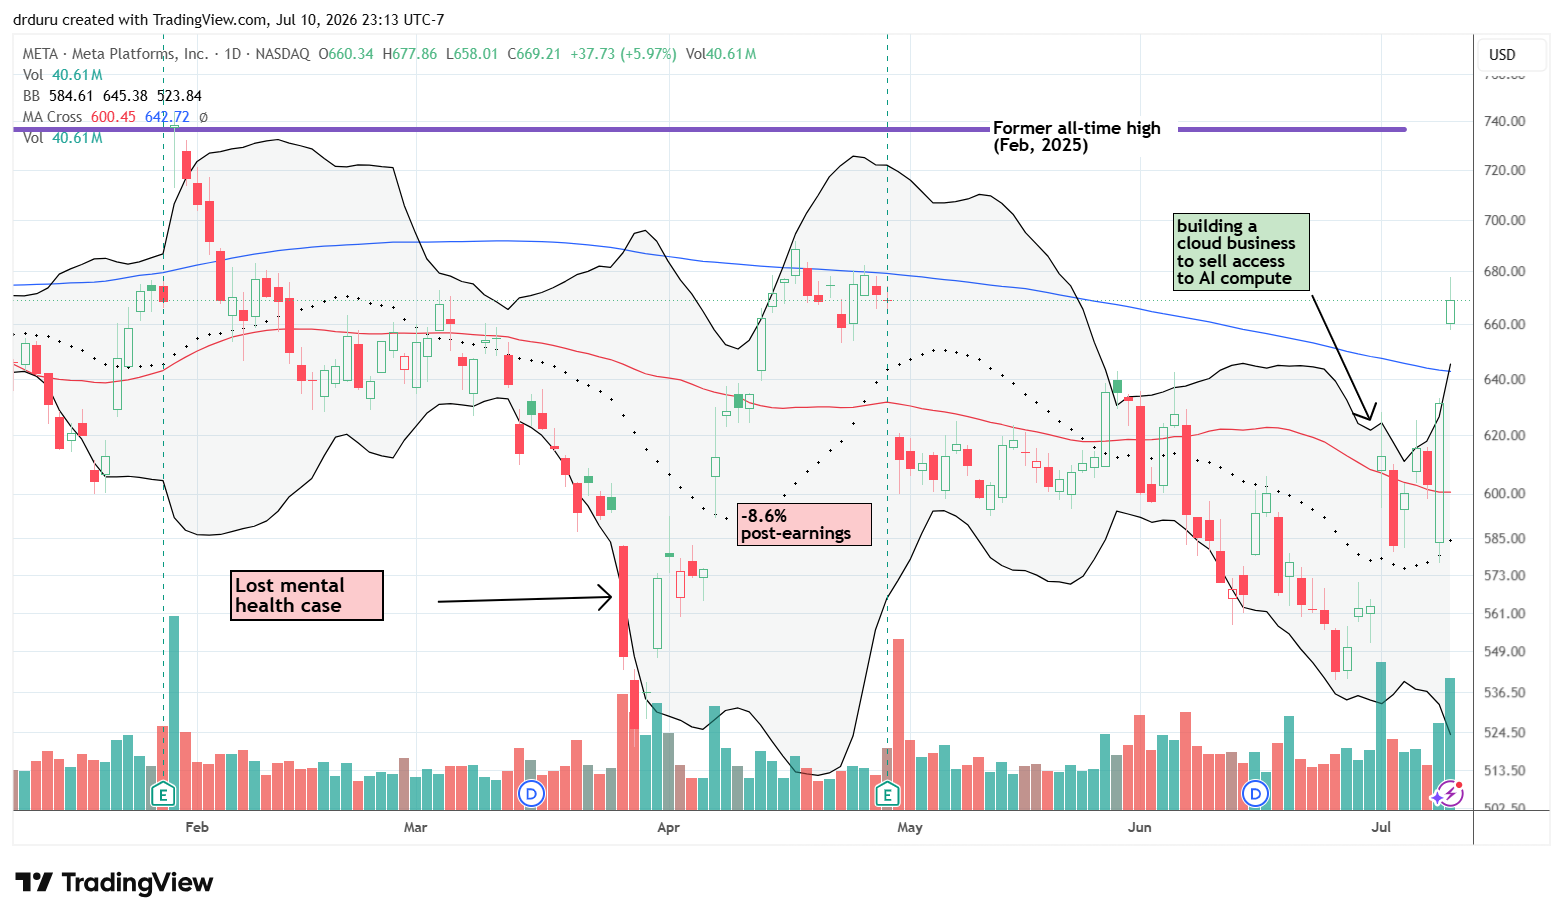
Meta Platforms (META)
Description: Meta Platforms operates Facebook, Instagram, Messenger, WhatsApp, and other services and develops virtual- and augmented-reality hardware, software, and content.
Technical status: Meta Platforms (META) gained 4.7% on Thursday as part of a major sentiment reversal. The following 6.6% gain and 200DMA breakout is over-extended but returns META to bullish trading.
Trade commentary: Last week, I wrote bearishly about the implications of META building a cloud business for selling AI compute. The plan looked like an admission that its existing AI strategy was not working. Market sentiment suddenly reversed this week with more AI product announcements from Meta even though Muse Image was defeatured in response to popular backlash.
Still, the 200DMA breakout suggests that the bearish phase may be ending. If so, META’s inability to appreciate for two years creates the potential for a substantial coiled spring effect that could propel the stock toward $1,000 very quickly.
Tesla (TSLA)
Description: Tesla designs electric vehicles, solar-energy products, and battery-storage systems.
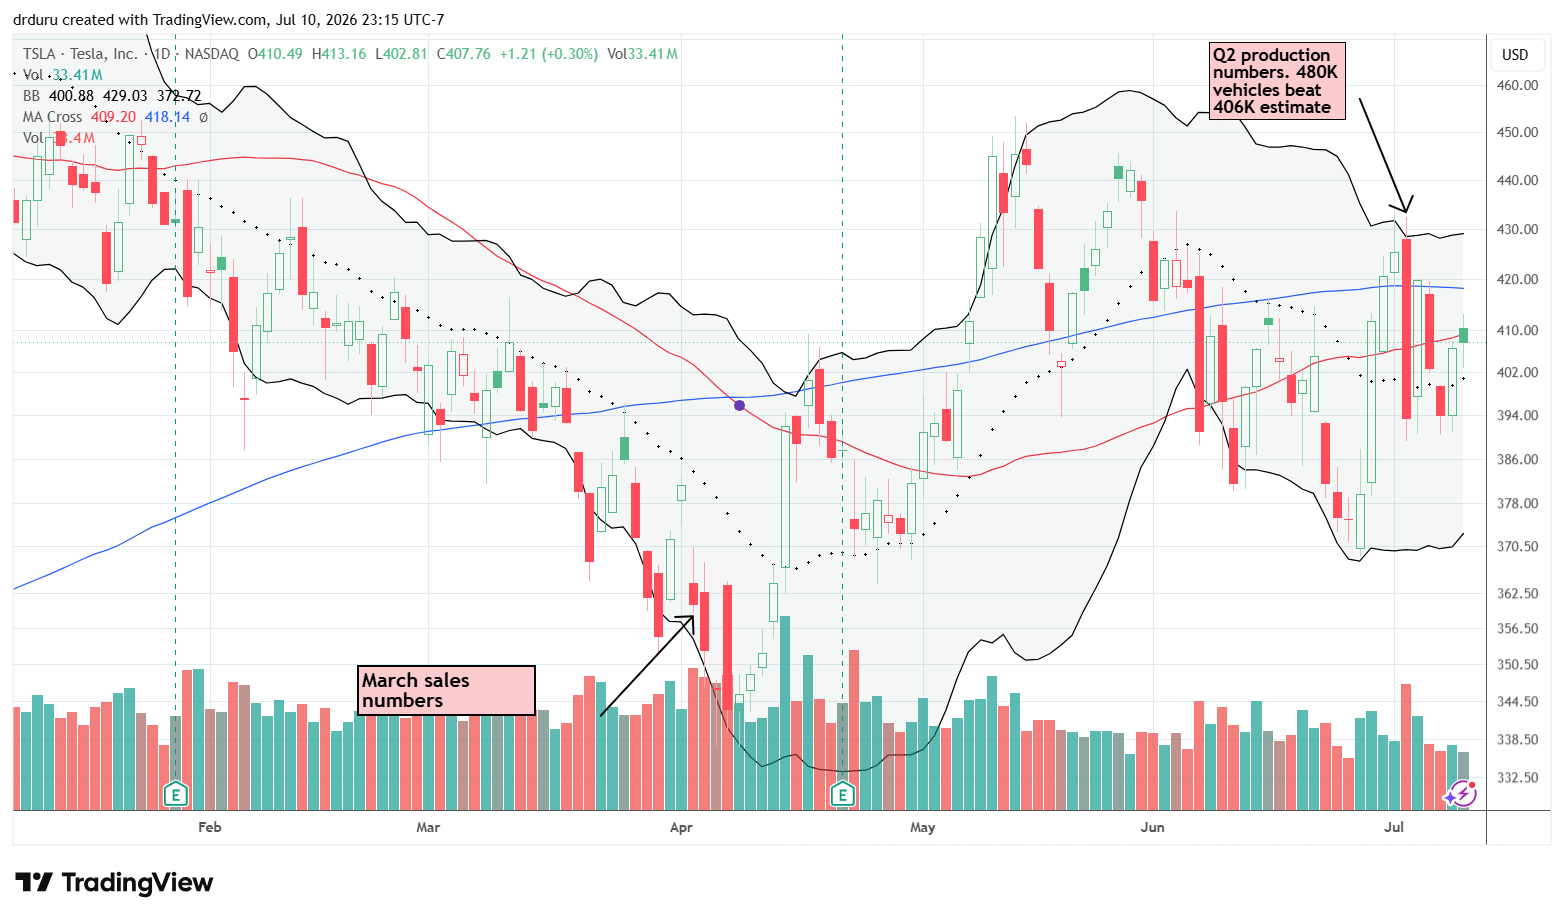
Technical status: Tesla (TSLA) nearly reversed the previous Friday’s 7.5% decline with an approximately 7% gain at the start of the week. The churn from there provided multiple trading opportunities.
Trade commentary: TSLA opened the week with a 6.7% gain that allowed me to take a profit on the weekly calendar call spread I discussed in the last Market Breadth post. Sellers returned over the next two days and took TSLA right back to the previous Friday’s low. Once I saw buyers return on Thursday, I opened up a more aggressive weekly calendar call spread. Continued buying into Friday’s intraday high took the position out at a profit. I am willing to rinse and repeat if TSLA maintains rangebound trading.
Depending on how the chart boundaries are drawn, TSLA has gone nowhere since 2021 and has a wider range in place since 2020.
Hertz Global Holdings (HTZ)
Description: Hertz Global Holdings provides vehicle-rental and mobility services through the Hertz, Dollar, Thrifty, and Firefly brands.
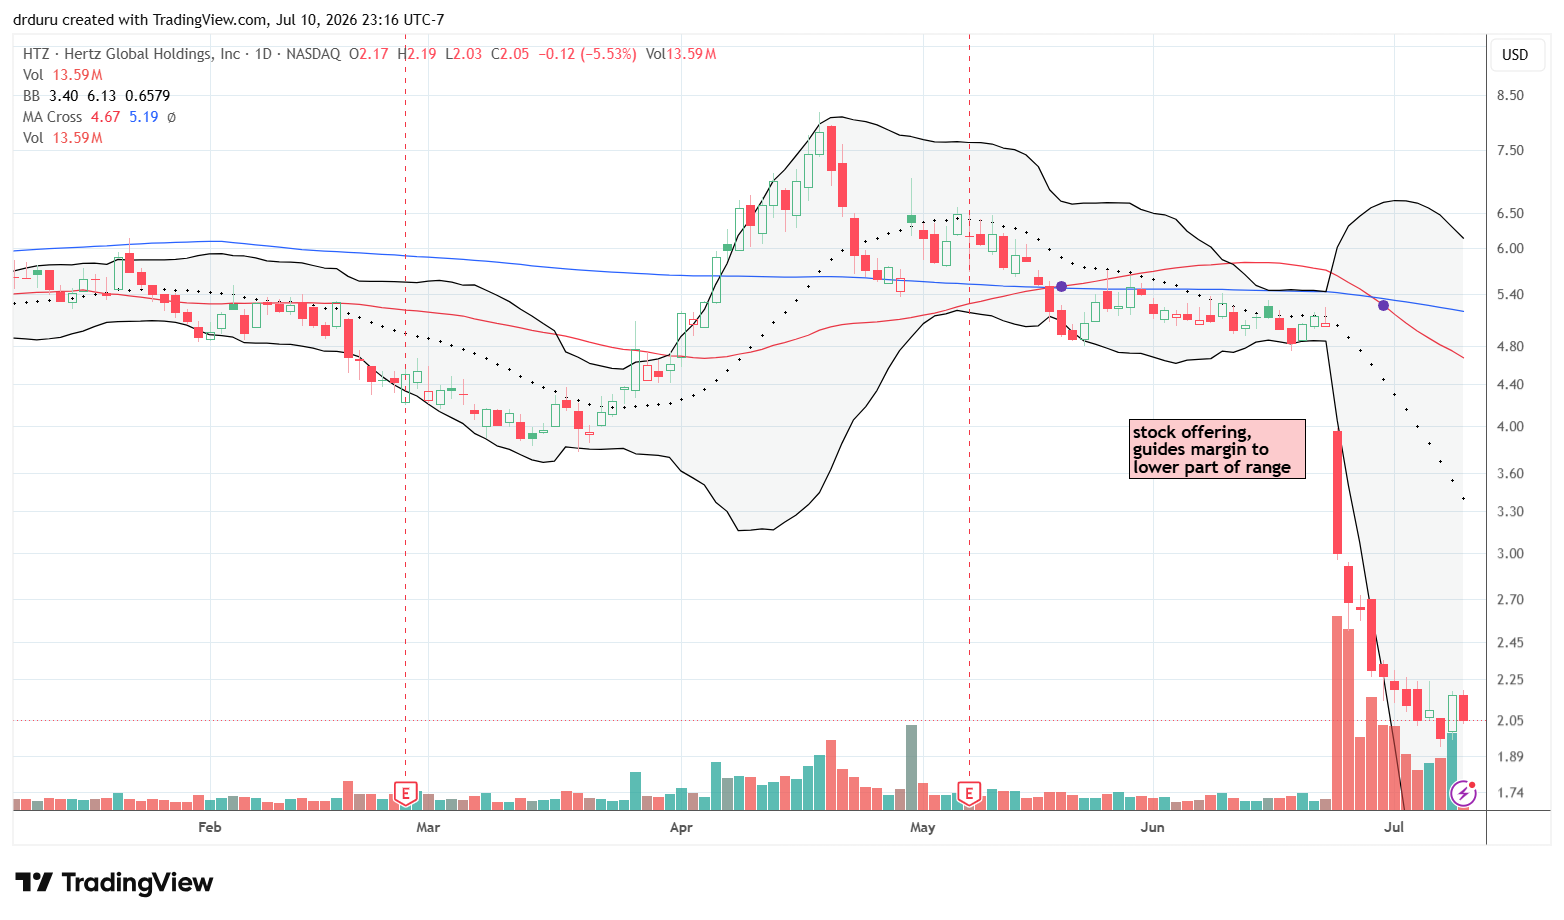
Technical status: Hertz Global Holdings (HTZ) continued falling sharply after a stock offering initially drove the shares down 40.7%. Heavy volume accompanied the decline, and the stock approached its pandemic-era lows.
Trade commentary: I warned two months ago that HTZ was vulnerable to a sharp pullback. Of course the stock kept rallying a bit longer before the story unraveled. HTZ chose an inauspicious time to unveil a stock offering, and the market expressed ferocious displeasure. HTZ is now positioned to set new all-time lows in due time.
VanEck Rare Earth and Strategic Metals ETF (REMX)
Description: The VanEck Rare Earth and Strategic Metals ETF tracks companies involved in producing, refining, and recycling rare-earth and strategic metals and minerals.
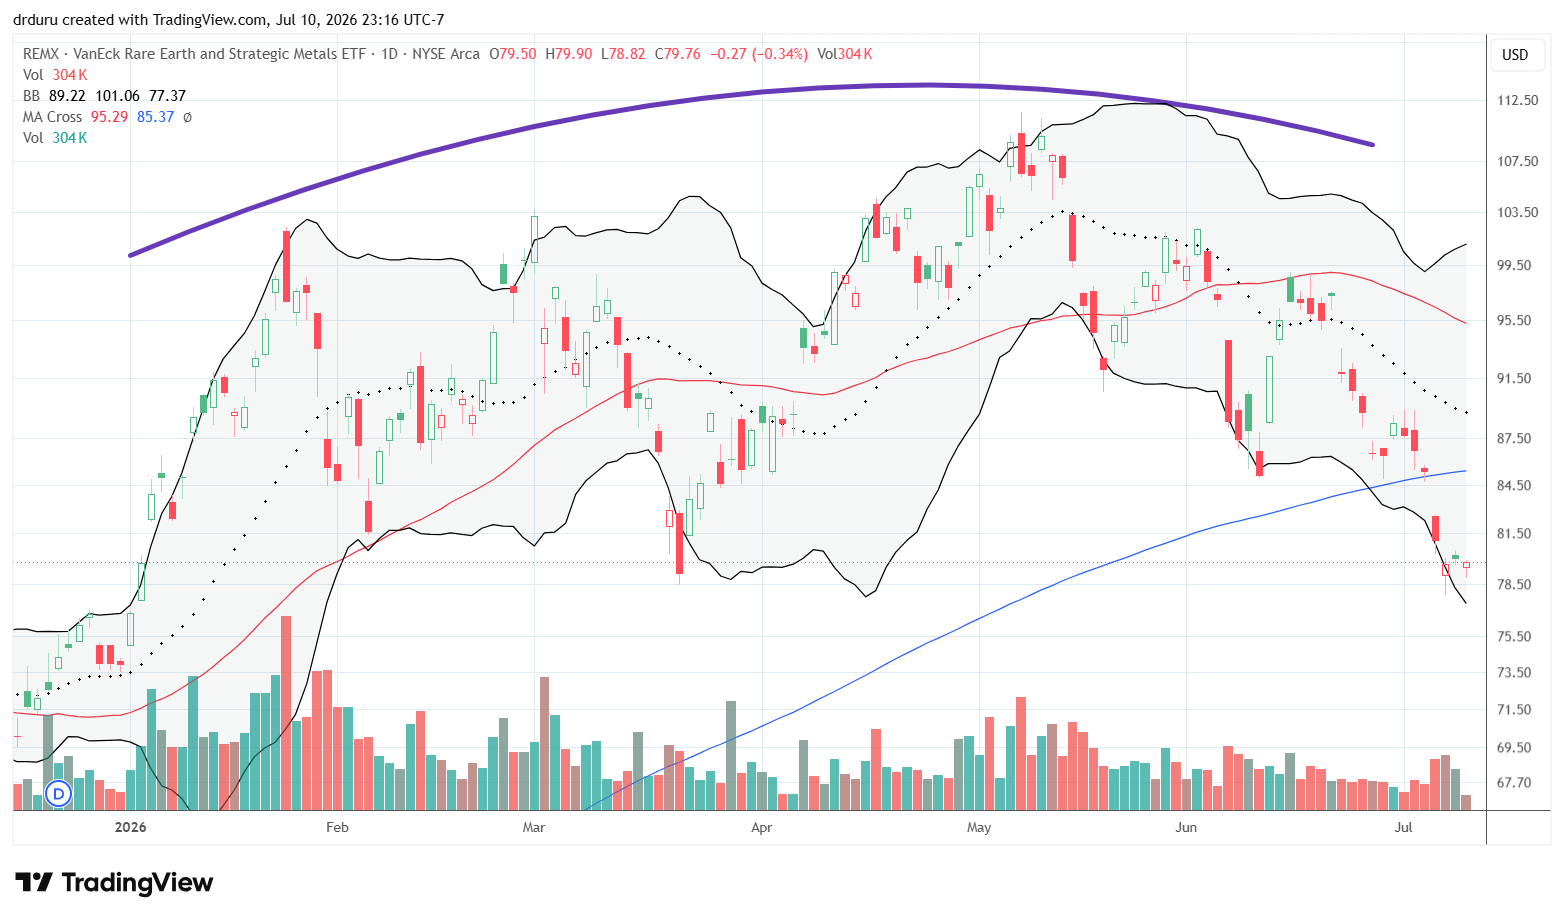
Technical status: VanEck Rare Earth and Strategic Metals ETF (REMX) peaked in late April. A 200DMA breakdown confirmed the subsequent topping pattern.
Trade commentary: Interest in rare-earth stocks tends to depend on the prominence of rare-earth materials in the headlines. These stocks are back in a phase of fading interest. REMX’s latest peak fell far short of its all-time high, so the rounded top shown by the purple line looks like a top confirmed by the 200DMA breakdown. I have one last position left (UURAF).
Footnotes
Subscribe for free to get email notifications of future posts!
“Above the 50” (AT50) uses the percentage of stocks trading above their respective 50-day moving averages (DMAs) to measure breadth in the stock market. Breadth defines the distribution of participation in a rally or sell-off. As a result, AT50 identifies extremes in market sentiment that are likely to reverse. Above the 50 is my alternative name for “MMFI” which is a symbol TradingView.com and other chart vendors use for this breadth indicator. Learn more about AT50 on my Market Breadth Resource Page. AT200, or MMTH, measures the percentage of stocks trading above their respective 200DMAs.
Active AT50 (MMFI) periods: Day #242 over 20%, Day #69 over 30%, Day #65 over 40%, Day #20 over 50% (overperiod), Day #42 under 60%, Day #215 under 75%
Source for charts unless otherwise noted: TradingView.com
Full disclosure: long SPY calls, long IWM calls, long TLT, long COST, long CAT call spread, long CME, long TJX, long INTC call spread
FOLLOW Dr. Duru’s commentary on financial markets via StockTwits, BlueSky, and even Instagram!
*Charting notes: Stock prices are not adjusted for dividends. Candlestick charts use hollow bodies: open candles indicate a close higher than the open, filled candles indicate an open higher than the close.
* Blog notes: this blog was partially written based on the heavily edited transcript of the following video that includes a live review of the stock charts featured in this post. I used ChatGPT to process the transcript.