

Stock Market Commentary
After a month of churning, market breadth is wavering again. This slip is just about the only sign that the market cares at all about looming risks from a potential government shutdown. Even the volatility index (VIX) dropped 8.6% on Friday and remains just below where it closed right before the tariff drama, trauma, and noise began. The VIX screams out the kind of complacency that complements a market melt-up. The contrast could not be sharper with these most dangerous months of the year. In fact, the AI-sponsored complacency in the market is making a mockery of risk, valuations, and anything else that could temper enthusiasm for stocks. If the government actually shuts down, I fully expect the accompanying political acrimony to lead to a protracted battle that could even drown out the coming jobs report as a source of fresh volatility for financial markets.
The Stock Market Indices
S&P 500 (SPY)
The S&P 500 painted a picture-perfect test of support at its 20-day moving average (DMA) (the dotted line) after a drift lower from its upper Bollinger Band (BB). The index tapped support mechanically and bounced, then followed through with buying into Friday’s 0.6% gain. Technically, the move was poetic and frustrating for bearish traders. The S&P 500 formed a bullish hammer pattern at the 20DMA and closed with a perfect reversal of its gains since the Fed cut rates. The uptrend defined by the 20DMA and 50DMA (red line) remains intact, and traders are essentially ignoring the prospect of a government shutdown.
")
NASDAQ (COMPQX)
The NASDAQ traced an arc similar to the S&P 500, sliding neatly into a complete reversal of its post-Fed gain and then jumping higher on Friday. I do not expect the tech laden index to obey technicals as cleanly as the S&P 500, but the reversal of the post-Fed reversal is classic.
")
iShares Russell 2000 ETF (IWM)
The iShares Russell 2000 ETF delivered a similar post-Fed setup. I have been trading around a large IWM position, so I mechanically bought call options on the test of 20DMA support and caught the 0.9% pop on Friday. The coming drama over the government shutdown will likely decide whether this latest trade blows up (bad) or explodes higher (good).
")
The Short-Term Trading Call With Market Breadth Wavering
- AT50 (MMFI) = 59.1% of stocks are trading above their respective 50-day moving averages
- AT200 (MMTH) = 60.9% of stocks are trading above their respective 200-day moving averages
- Short-term Trading Call: neutral
AT50 (MMFI), the percentage of stocks trading above their respective 50DMAs, closed the week at 59.1%. My favorite technical indicator wavered from roughly 60% to 55% on Thursday and then bounced Friday. Still, the short-term trend points lower and bearish with the on-going inability to breach the overbought threshold at 70%. The market breadth wavering keeps me sitting up straight, and a potential government shutdown is yet one more speedbump in the way of completely buying into the overall market melt-up. On the other hand, AT200 (MMTH), the percentage of stocks trading above their respective 200DMAs, remains rangebound and on the edge of a freshly bullish breakout. I estimate a 50/50 scenario split: either breadth breaks out and confirms healthier conditions or it breaks down and validates my caution on wavering market breadth.
The Equities: Market Breadth Wavering
Apple Inc (AAPL)
Description: Apple (AAPL) designs and sells smartphones, personal computers, tablets, wearables, and related software and services.
Technical status: Sentiment flipped bullish thanks to the iPhone cycle, with a two-day rip of 3.2% and 4.3% that stalled right below the all-time high. The inability to press that high keeps me focused on the prospect of sellers forcing the issue back to 20DMA or 50DMA support before the rally resumes.
Trade commentary: I am watching for either a clean breakout to new highs to validate momentum or a test of the 20DMA or 50DMA to offer a dip buy. If buyers keep hesitating here, I have to assume a pullback unfolds.
")
Zillow Group (ZG)
Description: Zillow Group (ZG) operates online real estate marketplaces and related services for home buyers, sellers, renters, and partners.
Technical status: ZG started the week selling off 6.9% in the wake of competitor Compass (COMP) buying its direct competitor Anywhere Real estate (HOUS). As a result, ZG broke a rising trend after a classic topping signal where price pushed far above the upper Bollinger Band and reversed. The failure at a double top spanning 2024–2025 turned the chart into a caution zone.
Trade commentary: I sold out of ZG just in time. A fourth fade from a Bollinger Band over-extension finally convinced me to take profits. I am likely not getting back in anytime soon as I want to refocus my housing market trades on the builders.
Compass (COMP)
Description: Compass (COMP) provides a residential real estate brokerage platform and services for agents and clients.
Technical status: The acquisition of HOUS triggered a 15.7% drop in COMP. The stock had just rallied back toward year-to-date highs from a 28.3% post-earnings pop in February, but buyers never mustered momentum beyond that.
Trade commentary: I see the technical damage and will watch to see whether management can win investors back in the next earnings report. Like ZG, I will treat COMP as another indicator of the housing market’s health.
Morningstar (MORN)
Description: Morningstar (MORN) provides independent investment research, data, analytics, and investment management services.
Technical status: MORN dropped 6% the previous week in sympathy with FactSet Research Systems Inc (FDS) and could not recover, staying within a broader downtrend that began after a marginal new all-time high failed around the beginning of the year.
Trade commentary: I am watching MORN as part of my interest in how AI deep research is impacting research firms. The chart keeps me cautious and this year’s downtrend says plenty.
First Solar (FSLR)
Description: First Solar (FSLR) manufactures thin-film solar modules and provides utility-scale photovoltaic solutions.
Technical status: FSLR’s 20DMA and 50DMA line up in a tidy uptrend while policy headlines failed to knock the stock off trend. Pullbacks to support keep resolving higher.
Trade commentary: I finally accumulated shares to ride the trend. If lower prices arrive as I earlier expected, I welcome the chance to add shares at a discount.
Mongodb Inc (MDB)
Description: MongoDB (MDB) develops and supports a general-purpose database platform for application developers.
Technical status: After a 38% post-earnings gap, MDB held gains and compressed into a Bollinger Band squeeze, signaling a volatility transition that often precedes a directional move.
Trade commentary: I am watching for a break above roughly $342 to confirm a buy signal or a breakdown toward the high-$300s to flip the signal the other way.
")
Alibaba Group Holding Ltd (BABA)
Description: Alibaba (BABA) operates e-commerce, cloud computing, digital media, and related technology platforms.
Technical status: I read the previous stall (tight trading range) as a topping setup, reinforced by a sharp 8.1% pullback in Baidu (BIDU). However, BABA gapped higher 8.2% the next day on news of a purchase of NVDA software.
Trade commentary: I learned a lesson about evaluating tops in a market melt-up environment. When trading bearish patterns in a sharp uptrend, I should consider what could go right. In the case of BABA a simple call option in the addition to my put spread (paid for by going short a call spread) could have actually made the entire position profitable. I have to remind myself that this environment of on-going AI headlines, a fresh market celebration is just a press release away.
")
eBay Inc (EBAY)
Description: eBay (EBAY) operates a global online marketplace platform for buyers and sellers.
Technical status: EBAY hugged its 50DMA uptrend, making it a trend-following candidate, but a 2.1% pullback that underperformed the market dented my confidence in the near-term setup.
Trade commentary: I bought a call spread for a continuation bounce off the 50DMA; the underperformance makes me question the trade. I am prepared to make a quick exit and accept the loss.
")
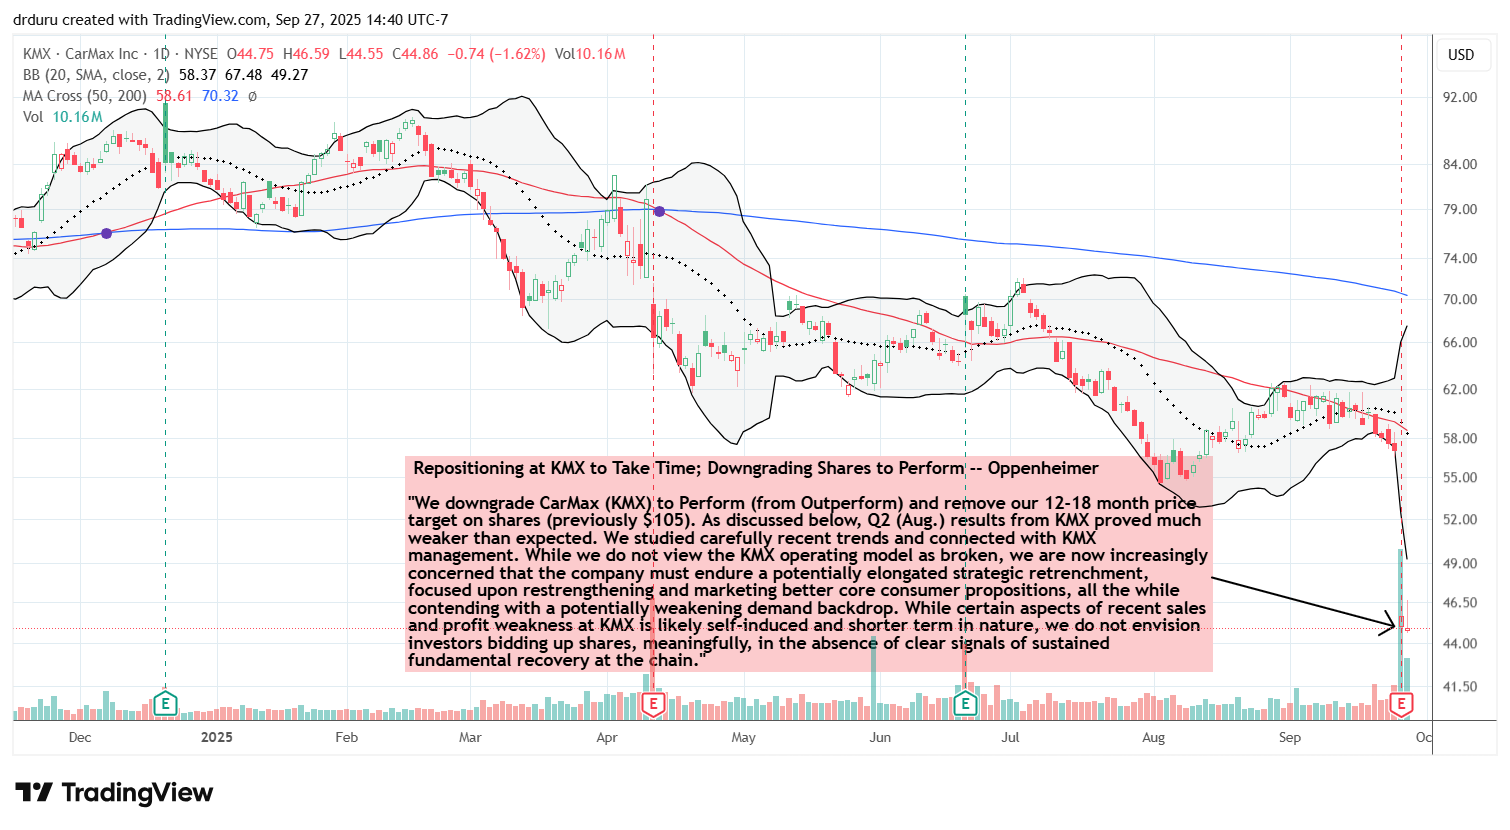
CarMax (KMX)
Description: CarMax (KMX) operates used-vehicle retail stores and provides related wholesale auctions and financing.
Technical status: KMX collapsed about 20% post-earnings and extended a long-running downtrend that started after its 2021 peak. The chart has warned of an imminent collapse for a long time.
Trade commentary: This is a case where the technicals lead: do not argue with a persistent downtrend. The chart below includes a long mea culpa from an analyst who ignored the trend and had a positive rating on KMX going into the collapse. It is a classic case of how fundamental analysis can fail in spectacular fashion, especially when it contrasts so starkly with technical realities.
Intel (INTC)
Description: Intel (INTC) designs and manufactures microprocessors, platforms, and related semiconductor products.
Technical status: After taking profits in INTC, I flagged a natural support line at a pre-gap close and watched INTC puncture support and then reclaim it. The next session’s 6.4% rise confirmed the bounce before news chatter about Apple talks surfaced.
Trade commentary: I should have re-entered on the first up day after the test of support. I simply lost track of this trade. Note how the market loudly telegraphed the big news to come.
International Business Machines Corp (IBM)
Description: IBM (IBM) provides hybrid cloud, AI, consulting, infrastructure, and emerging technologies including quantum computing.
Technical status: IBM popped 5.2% on news of a partnership with HSBC to do quantum-driven bond trading (uh, what and why??!!). The move finished closing IBM’s post-earnings gap down.
Trade commentary: I consider IBM a buy-the-dip stock in my AI and quantum trade baskets. I took profits in an IBM position just two days before the HSBC news. I am now waiting for the next dip.
")
IonQ Inc (IONQ)
Description: IonQ (IONQ) develops quantum computing hardware and cloud services.
Technical status: IONQ sold off about 6% in the wake of IBM’s quantum headlines, offering a potential opportunity if price drifts into 20DMA or, better, 50DMA support.
Trade commentary: I will look to buy my next IONQ tranche near 20DMA support around the high-$50s or, ideally, closer to the 50DMA near the high-$40s.
")
Marvell Technology Inc (MRVL)
Description: Marvell Technology (MRVL) designs and supplies data infrastructure semiconductor solutions.
Technical status: MRVL broke above 200DMA resistance (the blue line) after erasing an 18.6% post-earnings drop from last month and working through a 20% post-earnings gap from March. Follow-through buying would set up a very bullish trade opportunity.
Trade commentary: MRVL is now on my buy list as I watch for either a second close above the 200DMA or a tag of that line as confirmed support.
")
Nike Inc (NKE)
Description: Nike (NKE) designs, develops, and markets athletic footwear, apparel, equipment, and accessories.
Technical status: NKE broke below its 200DMA and looks tired heading into earnings this coming week. Just like KMX, a longer-term downtrend is a bright red flag hanging over NKE.
Trade commentary: I am not forcing a trade; I want to see how technicals resolve through earnings and what the earnings news says about the consumer.
")
")
")
Be careful out there!
Footnotes
Subscribe for free to get email notifications of future posts!
“Above the 50” (AT50) uses the percentage of stocks trading above their respective 50-day moving averages (DMAs) to measure breadth in the stock market. Breadth defines the distribution of participation in a rally or sell-off. As a result, AT50 identifies extremes in market sentiment that are likely to reverse. Above the 50 is my alternative name for “MMFI” which is a symbol TradingView.com and other chart vendors use for this breadth indicator. Learn more about AT50 on my Market Breadth Resource Page. AT200, or MMTH, measures the percentage of stocks trading above their respective 200DMAs.
Active AT50 (MMFI) periods: Day #72 over 20%, Day #70 over 30%, Day #65 over 40%, Day #38 over 50% (overperiod), Day #2 under 60% (underperiod), Day #45 under 70%
Source for charts unless otherwise noted: TradingView.com
Full disclosure: long IWM shares and call options, long SPY put spreads, short FDS put, long FSLR
FOLLOW Dr. Duru’s commentary on financial markets via StockTwits, BlueSky, and even Instagram!
*Charting notes: Stock prices are not adjusted for dividends. Candlestick charts use hollow bodies: open candles indicate a close higher than the open, filled candles indicate an open higher than the close.
* Blog notes: this blog was written based on the heavily edited transcript of the following video that includes a live review of the stock charts featured in this post. I used ChatGPT to process the transcript.