

Stock Market Commentary
After a holiday-shortened week, a market breadth breakout signals sentiment near peak bullishness. The market also seemed to interpret an unexpectedly strong jobs report as a positive, even as odds for rate cuts plunged (at the time of writing, 5% for later this month and 69.4% for September, down from 91% a week ago according to the CME FedWatch tool). As the bond market is reverting to being blasé about the U.S.’s ballooning budget deficit, the stock market is no doubt looking forward to all sorts of goodies from the passage of the administration’s budget bill. These developments swirled around a session defined by all-time highs and fresh optimism.
The bullish technical landscape was fully affirmed across all key indices as market breadth significantly expanded…
The Stock Market Indices
S&P 500 (SPY)
SPY continued a surge along its upper Bollinger Band, showing no signs of fatigue. The 20-day moving average (DMA) (the dotted line) was a firm support level, confirmed by multiple successful tests during recent pullbacks, that launched the index to these all-time highs.
")
NASDAQ (COMPQ)
The NASDAQ also closed at an all-time high, supported by repeated confirmations of support at its 20DMA. The tech-laden index sits firmly in “full bull” territory.
")
iShares Russell 2000 ETF (IWM)
IWM joined the full bull camp with a decisive breakout above its 200DMA (the blue line). While stretched above its upper Bollinger Band (BB) like the other two major indices, strong support from the 20DMA suggests the pullback from these overstretched conditions should be mild.
")
The Short-Term Trading with a Market Breadth Breakout
- AT50 (MMFI) = 75.7% of stocks are trading above their respective 50-day moving averages (overbought day #3)
- AT200 (MMTH) = 54.6% of stocks are trading above their respective 200-day moving averages
- Short-term Trading Call: cautiously bullish
AT50 (MMFI), the percentage of stocks trading above their 50DMAs, closed at 75.7%, confirming a breakout into overbought territory. This marks the beginning of what I am calling the “overbought summer.” Per my AT50 trading rules, as long as my favorite technical indicator remains above the overbought threshold, the bullish bias remains intact. A drop below this level would warrant caution, but I cannot flip bearish until a major support level gives way.
AT200 (MMTH), the percentage of stocks above their 200DMAs, was the star of the show last week. This longer-term indicator of the health of market breadth rose to 54.6%, marking a market breadth breakout that ended its prior downtrend. This market breadth breakout coincides with levels last seen when SPY was last at all-time highs. Thus, I put aside my yellow flag of caution and acknowledge broad-based technical strength in the stock market. Still, I am leaving the short-term trading call at cautiously bullish.
Surprisingly, the volatility index (VIX) did not fall significantly despite bullish price action. The VIX remains above year-to-date lows, so it is not quite confirming the fresh bullishness in the stock market.
The Equities: Market Breadth Breakout
GLD (SPDR Gold Trust)
GLD recovered from its 50DMA (the red line) breakdown but lacks upside catalysts unless the U.S. dollar resumes its sell-off. If the market resumes caring about the budget-busting budget bill, the dollar should reverse its current relief rally in due time. I still have a call spread position in play.
Technical Status: Holding above 50DMA
Trade Commentary: Maintaining a call spread; waiting for dollar weakness for further upside.
")
ITRI (Itron)
A prior breakout to all-time highs continues to hold for ITRI. I made the case for ITRI in March. The success of this trade once again confirmed the value of swingtradebot in helping me find bullish breakouts and other profitable trade setups.
Technical Status: All-time high breakout
Trade Commentary: Holding long-term due to strong price structure.
")
Las Vegas Sands Corp (LVS)
LVS staged a clean breakout above its 200DMA with three closes above its upper Bollinger Band. LVS is a classic rental stock. The casino and hotel company peaked in 2007 and has gone nowhere since 2010, trading in a range since then.
Technical Status: Breakout above 200DMA
Trade Commentary: Waiting for pullback to buy above 200DMA support.
MGM Resorts International (MGM)
MGM mirrored LVS with an even more resolute 200DMA breakout, with the stock launching solidly off the 200DMA as support. Like LVS, I am awaiting a pullback to enter. Also like LVS, MGM peaked in 2007. However, MGM collapsed so thoroughly during the financial crisis that the stock is grinding away on a slow uptrend since the 2009 lows hit single digits.
Technical Status: Strong 200DMA bounce
Trade Commentary: Bullish bias; will buy on pullback above 200DMA.
ETSY (Etsy)
ETSY rebounded off converging 50DMA and 200DMA support. I bought shares and a new call spread to play this strong technical rebound. The sharp May/June rally looks like an early sign of “something” positive ahead; the traders who rushed in could have gotten impatient and preferred profits now. I am now watching for resistance at the 20DMA (~$56.62) and aiming for $64+ on a breakout.
Technical Status: Support at 50DMA and 200DMA; resistance at 20DMA
Trade Commentary: Entered with shares and calls; watching 20DMA resistance.
")
Nike, Inc (NKE)
NKE soared 15.2% post-earnings and crossed its 200DMA without cooling down. I had NKE on a buy list; I now consider it a bearish-to-bullish reversal trade.
Technical Status: Breakout above 200DMA
Trade Commentary: Watching for entry if a pullback occurs; bullish turnaround potential.
")
lululemon athletica, Inc (LULU)
LULU showed a bottoming hammer after heavy selling and (relief) rallied back to 20DMA resistance. I am avoiding LULU after an earlier failed hedged trade. The weekly chart below suggests LULU is printing a long-term and perhaps sustainable top. The 2024 all-time high was a false breakout from a 5-year trading range.
Technical Status: 20DMA resistance after bottoming
Trade Commentary: No position; cautious given past failed entries and bearish structure.
Meta Platforms, Inc (META)
META gapped up to an all-time high and then sold off—a “gap and crap.” The stock is now suddenly lagging the S&P 500 and the NASDAQ amid what looks like a rotation out of what has worked and into beaten-up stocks. I am neither bullish nor bearish on META overall.
Technical Status: Failed breakout; lagging
Trade Commentary: No position; monitoring sector rotation impact.
")
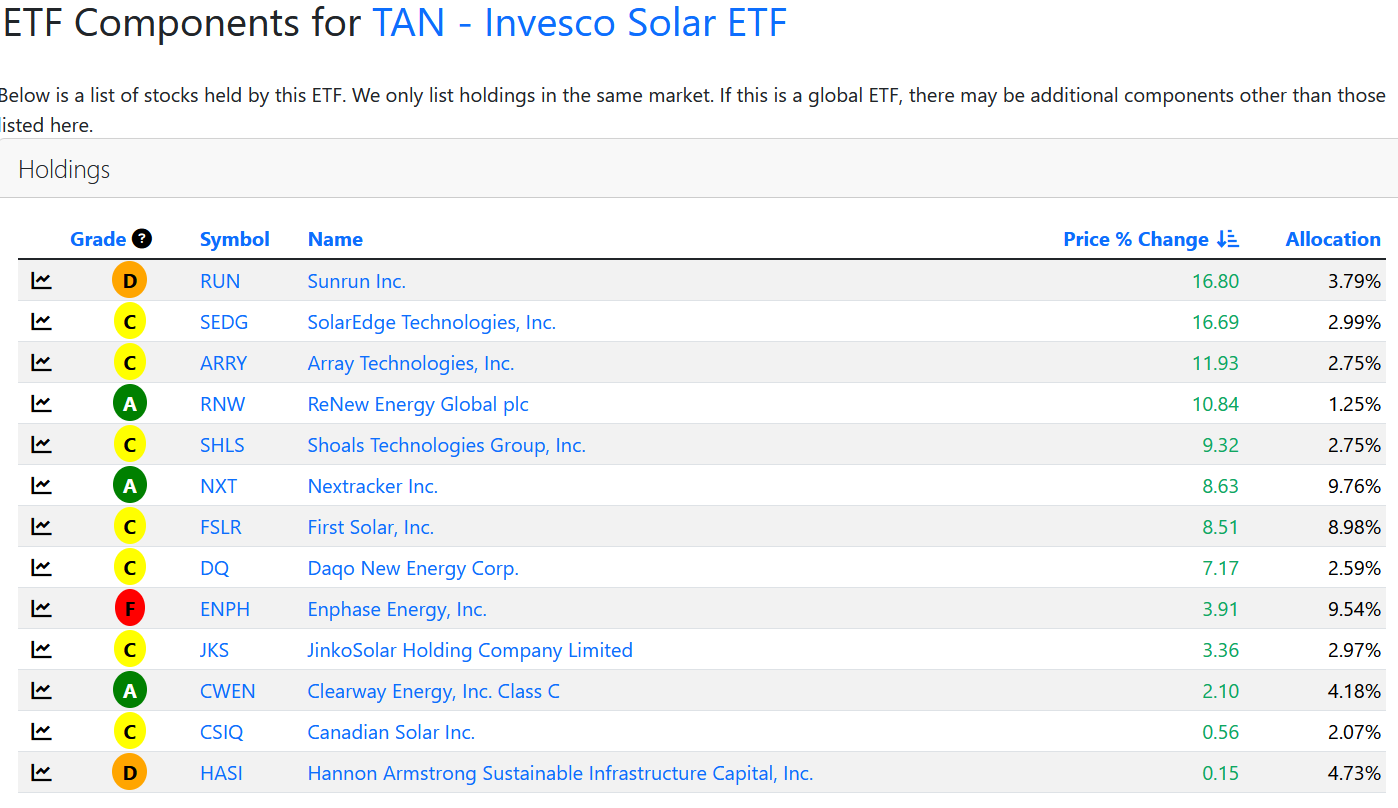
Invesco Solar ETF (TAN)
TAN soared with three closes above its 200DMA. First Solar was one of many solar stocks pushing the ETF higher. Six other components fared even better (FSLR, RNW, SHLS, and NXT have the best technicals of the top 7). I have been holding out on committing to solar stocks as a contrarian play in 2 or 3 years. However, it seems some intrepid traders are trying to force the issue now. I plan to buy TAN on a pullback off overstretched conditions above the upper BB before I venture to buy into FSLR.
Technical Status: Breakout confirmed
Trade Commentary: Waiting for slight cool-off before initiating long.
")
Spotify Technology SA (SPOT)
SPOT pulled back for four sessions after all-time highs but remains bullish. Like META, I assume SPOT became a source of funds for traders participating in a rotation trade. I now want to buy and hold, ideally starting with a pullback to 50DMA support.
Technical Status: All-time high; retracement in progress
Trade Commentary: Planning to buy and hold on 50DMA retest.
")
")
")
Be careful out there!
Footnotes
Subscribe for free to get email notifications of future posts!
“Above the 50” (AT50) uses the percentage of stocks trading above their respective 50-day moving averages (DMAs) to measure breadth in the stock market. Breadth defines the distribution of participation in a rally or sell-off. As a result, AT50 identifies extremes in market sentiment that are likely to reverse. Above the 50 is my alternative name for “MMFI,” which is a symbol TradingView.com and other chart vendors use for this breadth indicator. Learn more about AT50 on my Market Breadth Resource Page. AT200, or MMTH, measures the percentage of stocks trading above their respective 200DMAs.
Active AT50 (MMFI) periods: Day #42 over 20%, Day #40 over 30%, Day #35 over 40%, Day #30 over 50%, Day #28 over 60%, Day #3 over 70% (overbought)
Source for charts unless otherwise noted: TradingView.com
Full disclosure: long IWM shares, long GLD call spread, long ITRI
FOLLOW Dr. Duru’s commentary on financial markets via StockTwits, BlueSky, and even Instagram!
*Charting notes: Stock prices are not adjusted for dividends. Candlestick charts use hollow bodies: open candles indicate a close higher than the open, filled candles indicate an open higher than the close.
* Blog notes: This blog was written based on the heavily edited transcript of the following video that includes a live review of the stock charts featured in this post. I used ChatGPT to process the transcript.