

Stock Market Commentary
In just three months, the stock market has transformed from fragile to fearless. Friday’s return to overbought territory, on the heels of another jobs report that beat “consensus expectations”, underlined the market’s fearless bullishness. The jobs report made imminent rate cuts even less likely. Along with that prospect, bond yields nudged higher and put a fresh damper on an already weak housing market. In the spirit of a renewed calm, a week full of fresh tariff headlines and a sudden burst of acrimony between the President and his out-going civil servant lieutenant (Elon Musk) barely slowed the march to what now looks like an imminent test of all-time highs. In fact, Thursday’s resulting pullback was mild enough to confirm important support for the S&P 500. What a difference a deeply oversold flush can make for market sentiment.
The Stock Market Indices
S&P 500 (SPY)
SPY rallied 1% on the day, closing at 6,000. The move confirmed a breakout above post-election support levels. Thursday’s mild 0.5% dip on the Trump-Musk rap battle neatly stopped right at presumed support – the index’s first post-election close – and the gap higher on Friday brought a clean confirmation. The index is now free to test its all-time high from four months ago.
The 20-day moving average (DMA) (the dotted line) is rising steeply, the 50DMA (the red line) is trending upward, and the 200DMA (blue line) sits below as firm support. Given the S&P 500 is so well-supported, I fully expect a breakout above the previous all-time high could unleash a powerful and fearless rally, as earlier bearish sentiment and selling seem washed out. The headlines matter little at this juncture (as an exercise, try to think of a worse headline than what we have already seen this year…and then assess that headline’s likelihood). Imagine what can happen on a breakout to new all-time highs.
")
NASDAQ (COMPQ)
The NASDAQ is also poised to test its all-time high. While the tech laden index did not clear Thursday’s candle as convincingly as SPY, the uptrend remains strong. Like SPY, the NASDAQ is well supported by rising moving averages.
")
iShares Russell 2000 ETF (IWM)
IWM staged a rebound off its 20DMA support. I bought call options earlier in the week on a test of that support and exited the next day after a sharp gain. I missed the second opportunity on a retest of the 20DMA. As a reminder, I still hold a large core position in IWM, so I am always happy to see IWM go higher. The ETF of small caps is now on track to test 200DMA resistance.
")
The Short-Term Trading From Fragile to Fearless
- AT50 (MMFI) = 73.7% of stocks are trading above their respective 50-day moving averages (first overbought day)
- AT200 (MMTH) = 43.6% of stocks are trading above their respective 200-day moving averages
- Short-term Trading Call: cautiously bullish
AT50, the percentage of stocks trading above their respective 50DMAs, ended the week with a surge above the 70% overbought threshold. Unlike in mid-May, when my favorite technical indicator failed to hold overbought levels, this second trip to overbought territory came with a gap higher—indicating stronger momentum and increasing the odds of a prolonged overbought period. Remember that per the AT50 trading rules, overbought conditions are not by themselves bearish. Particularly at this juncture of a market transforming from fragile to fearless, overbought conditions confirm underlying buying strength in the market.
Even after AT50 drops from overbought conditions, traders will find a well-supported market as described above. Layers of underlying support await to catch falling prices. Given everything the stock market has already conquered, sellers will likely have a hard time for a while knocking the market back down.
AT200 (MMTH), the percentage of stocks trading above their respective 200DMAs, did not break out like AT50. This longer term indicator of the health of market breadth is now lagging the fearless run-up in AT50. The upshot? At 44%, AT200 reminds me there is plenty of upside left for a continued run for this bullish cycle. AT200 started the year at 52% and topped out at 70% last year.
The Volatility Index (VIX)
The VIX poked through its long-standing support level—dating back to the pre-tariff drama days—marking an entry into complacency and increasing bullish sentiment territory. I expect the VIX to fall further if SPY continues to rise and AT50 remains overbought.
")
The Equities: Fearless
Best Buy (BBY)
Best Buy reversed its post-earnings breakdown, recovering from a 7.3% loss. Buyers stepped in quickly, and the stock has trended upward since. I played put options incorrectly and now need to get bullish again. I did not find relevant news to explain this sudden and abrupt change in sentiment. This sudden reversal is one of many examples of the fearless nature of this juncture in market sentiment.
SPDR S&P Retail ETF (XRT)
XRT’s return to a bullish posture may have helped pull BBY out of its post-earnings breakdown. XRT avoided a breakdown and is now bullishly trading above 200DMA support. Even XRT’s uptrending 20DMA has not received a serious challenge since April’s breakout.
")
Micron Technology (MU)
MU broke out above its 200DMA last week and kept ripping higher without clear news. Like a number of stocks in this overbought period, the 20DMA has provided firm support without much of a challenge since the April breakout. I have maintained a hedged position with a core of shares short and a (now) rapid rotation of buying and closing out call options and spreads. Given last week’s breakout, I likely need to shift to a 100% bullish position on the next pullback to support. MU is overextended above its upper Bollinger Band (BB) with two straight days of sellers fading MU from intraday highs. Thus, I fully expect an imminent pullback to at least fill Thursday’s gap higher.
")
Dollar General (DG)
DG surged 16% post-earnings. I missed the trade despite watching the stock closely and writing about the impressive technicals. The 20DMA and 50DMA held as support perfectly in the lead-up to earnings. DG is even close to filling last year’s 32% post-earnings gap down. DG has created an impressive bearish to bullish reversal.
")
Dollar Tree (DLTR)
DLTR has also pulled off an impressive bearish to bullish reversal. Surprisingly, DLTR followed DG’s post-earnings surge with an 8.4% post-earnings drop. Just as suddenly, DLTR reversed the next day with a 9.1% gain the next day. The 20DMA provided key support. Like DG, I have followed DLTR’s reversal closely, but I have made more trades and profited from my close attention to this seemingly contrarian recovery for DLTR.
")
Constellation Energy (CEG)
Power utility CEG gapped higher on news of a nuclear power deal with Meta Platforms (META) but quickly reversed—a classic “gap and crap” and topping pattern. Adding to the topping pressure is the way CEG stopped just short of testing its all-time high before fading sharply on high trading volume. I do not want to short CEG given the hype on nuclear power, but this topping pattern is definitely a yellow flag warning for the stock.
")
CoreWeave (CRWV)
CRWV is a “a cloud platform that provides scaling, support, and acceleration for GenAI“. The stock surged 42% two days after its IPO. In almost 3 weeks the stock reversed those gains and closed at a new low. CRWV has been a rocketship ever since, trading up for most of the days since. Last week’s all-time high marked an incredible 4.5X gain from the all-time low in just 6 weeks. CRWV would have surged to the top of my generative AI buy list, but I listened to the skeptics who talked about the poor fundamentals of CorewWeave: high debt levels and high valuation. Clearly, a large enough fearless swath of the market does not care! Now all I can do is watch as the stock is overdue for some kind of cooling off period.
")
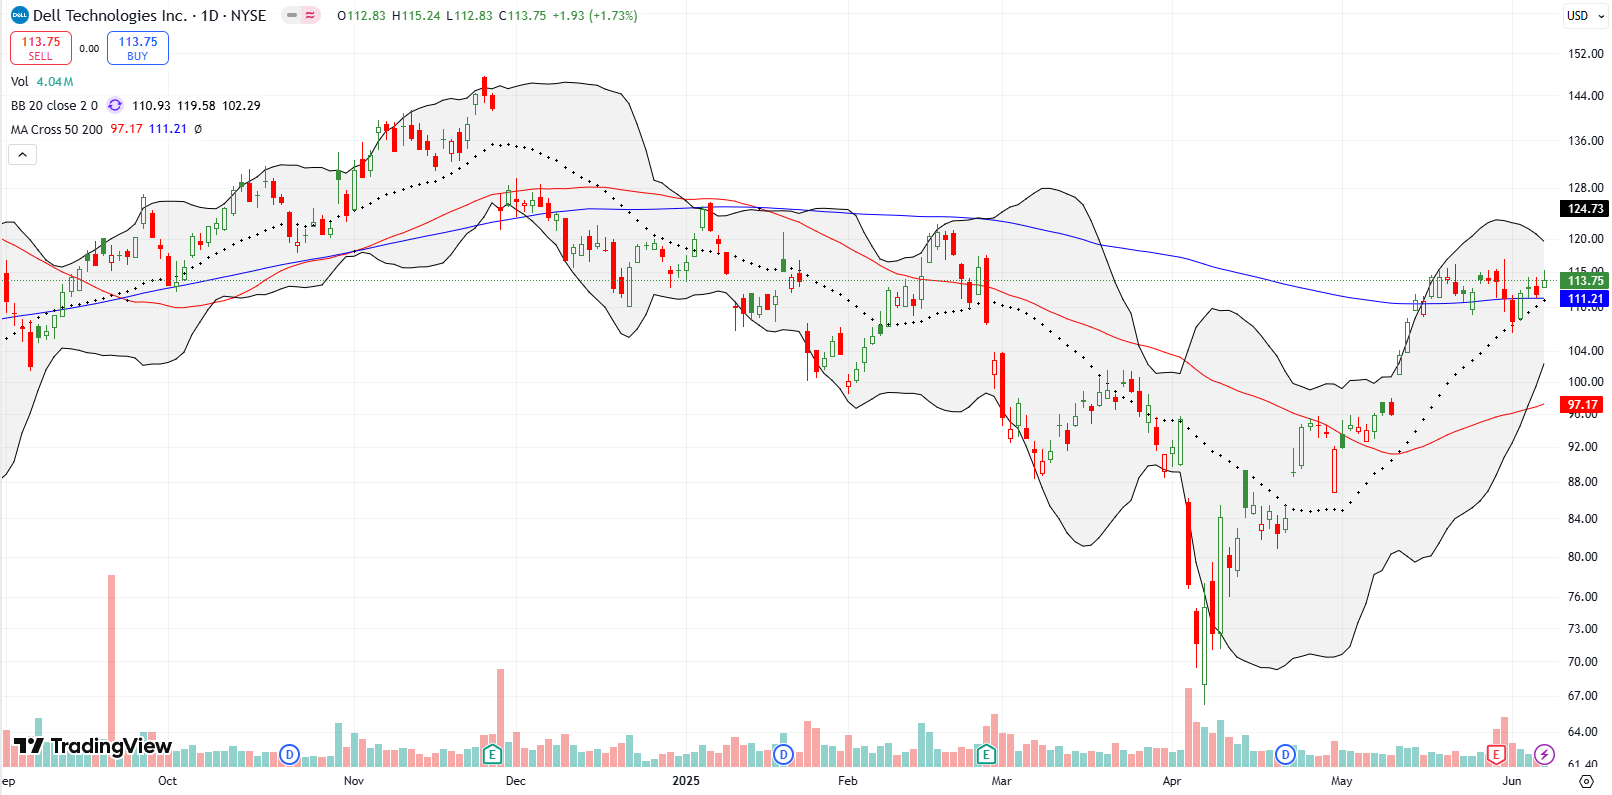
Dell (DELL)
DELL is showing bullish consolidation around its 200DMA and above uptrending 20DMA support. Now a Bollinger Band squeeze is forming around the price action. I added more shares to my core position in anticipation of an upside resolution to the squeeze. I will add call options if/when a breakout happens.
Etsy Inc (ETSY)
I received a price alert that eBay Inc (EBAY) hit an all-time high. My attention next went to Etsy Inc (ETSY) given it dropped 5.4% post-earnings in April, failing perfectly at 50DMA resistance. I was shocked to find the stock has rallied nearly straight up since May 27 on high trading volume. I see no news to explain this move, so I have to assume the elimination of the de minimus exemption reduces competition from Chinese ecommerce players like Temu and Shein. On May 28th, ETSY’s CEO called out the following in Bernstein’s 41st Annual Strategic Decisions Conference:
“Etsy’s value prop relative to the market will get stronger if we have tariffs against China. I think China has been abusing the spirit of the de minimis exemption and a crackdown on that I think would be helpful, not just for Etsy but for many people.”
I used ChatGPT to assess the significant new news that came from the conference. Here is a summary:
- Tariffs viewed as a potential tailwind with historical precedent (2021, 2023).
- A unified tech stack (search + ads + recommendations), already boosting available data by 33%.
- A more advanced and behavior-responsive quality score in search ranking.
- Confirmation that Temu exited the Google PLA auction (affecting competitive landscape).
- Stronger emphasis on leveraging Depop learnings inside Etsy’s leadership and product strategy.
Despite my trading rule against chasing price action, I decided to chase with a low risk June/July $65 calendar call spread. I am hoping to shave a little profit from this amazing reversal in fortunes. The stock closed last week at a 10-month high. I have flagged ETSY as a buy the dips stock.
")
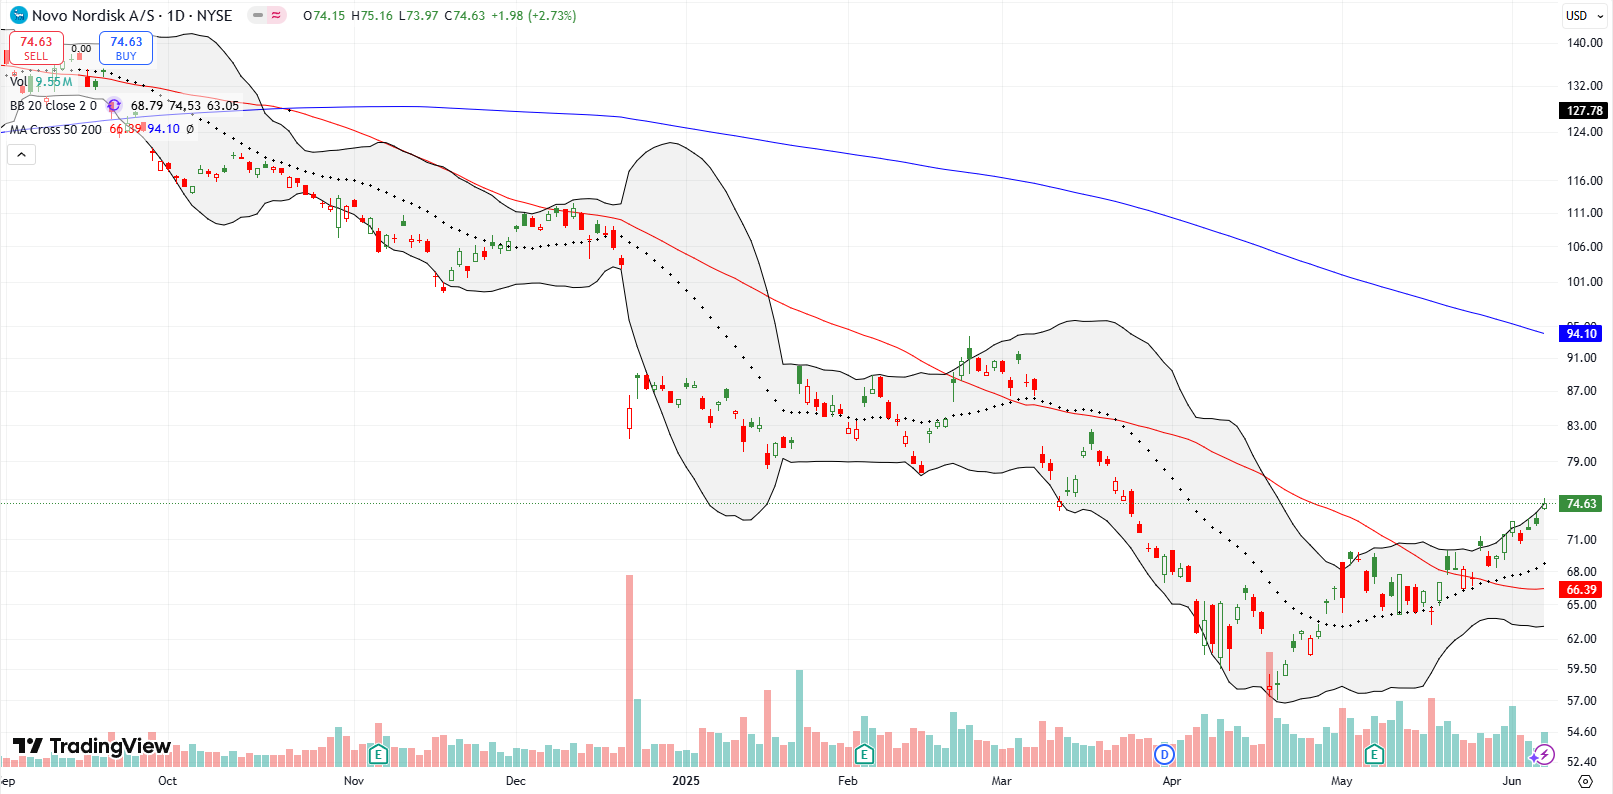
Novo Nordisk (NVO)
Pharmaceutical company and player in the GLP-1 space Novo Nordisk is reversing from bearish to bullish after breaking out above its 50DMA and holding uptrending 20DMA support. I started a position and will add more on a pullback to 20DMA support. A prior head and shoulders top was confirmed with a 17.8% crash.
Lululemon (LULU)
LULU dropped 20% post-earnings and is now below its 50DMA and 200DMA. This specialty retailer of athletic clothing and accessories is now a no-touch for me as it confirms the weakness from March earnings.
")
Credo Technology Group Holding Ltd (CRDO)
Last week I discussed my risk management for CRDO. The stock soared as much as 30% post-earnings before settling on a 14% gain. Wowza. Stock is clinging to its post-earnings low as support, but I am warily eyeing the stock as it conveniently faded from the previous high in February (created out of a rebound from the DeepSeek plunge).
")
")
")
Be careful out there!
Footnotes
Subscribe for free to get email notifications of future posts!
“Above the 50” (AT50) uses the percentage of stocks trading above their respective 50-day moving averages (DMAs) to measure breadth in the stock market. Breadth defines the distribution of participation in a rally or sell-off. As a result, AT50 identifies extremes in market sentiment that are likely to reverse. Above the 50 is my alternative name for “MMFI” which is a symbol TradingView.com and other chart vendors use for this breadth indicator. Learn more about AT50 on my Market Breadth Resource Page. AT200, or MMTH, measures the percentage of stocks trading above their respective 200DMAs.
Active AT50 (MMFI) periods: Day #29 over 20%, Day #27 over 30%, Day #22 over 40%, Day #17 over 50%, Day #15 over 60%, Day #1 over 70% (overbought)
Source for charts unless otherwise noted: TradingView.com
Full disclosure: long IWM shares and calls, long ETSY calendar call spread, long BBY put spread, short MU shares and long calls and calendar spread, long DELL, long NVO, long SPY shares and calendar call spread and put spread
FOLLOW Dr. Duru’s commentary on financial markets via StockTwits, BlueSky, and even Instagram!
*Charting notes: Stock prices are not adjusted for dividends. Candlestick charts use hollow bodies: open candles indicate a close higher than the open, filled candles indicate an open higher than the close.
* Blog notes: this blog was written based on the heavily edited transcript of the following video that includes a live review of the stock charts featured in this post. I used ChatGPT to process the transcript.