Stock Market Commentary
The market ended the week on a quiet cliffhanger as major indices hovered under critical resistance levels. A defining theme was the muted reaction to major headlines, particularly around trade and stagflation risks. Despite the looming shadow of stagflation – a term not explicitly mentioned but clearly implied in last week’s Fed meeting – the market appears to have settled into a period of indifferent calm.
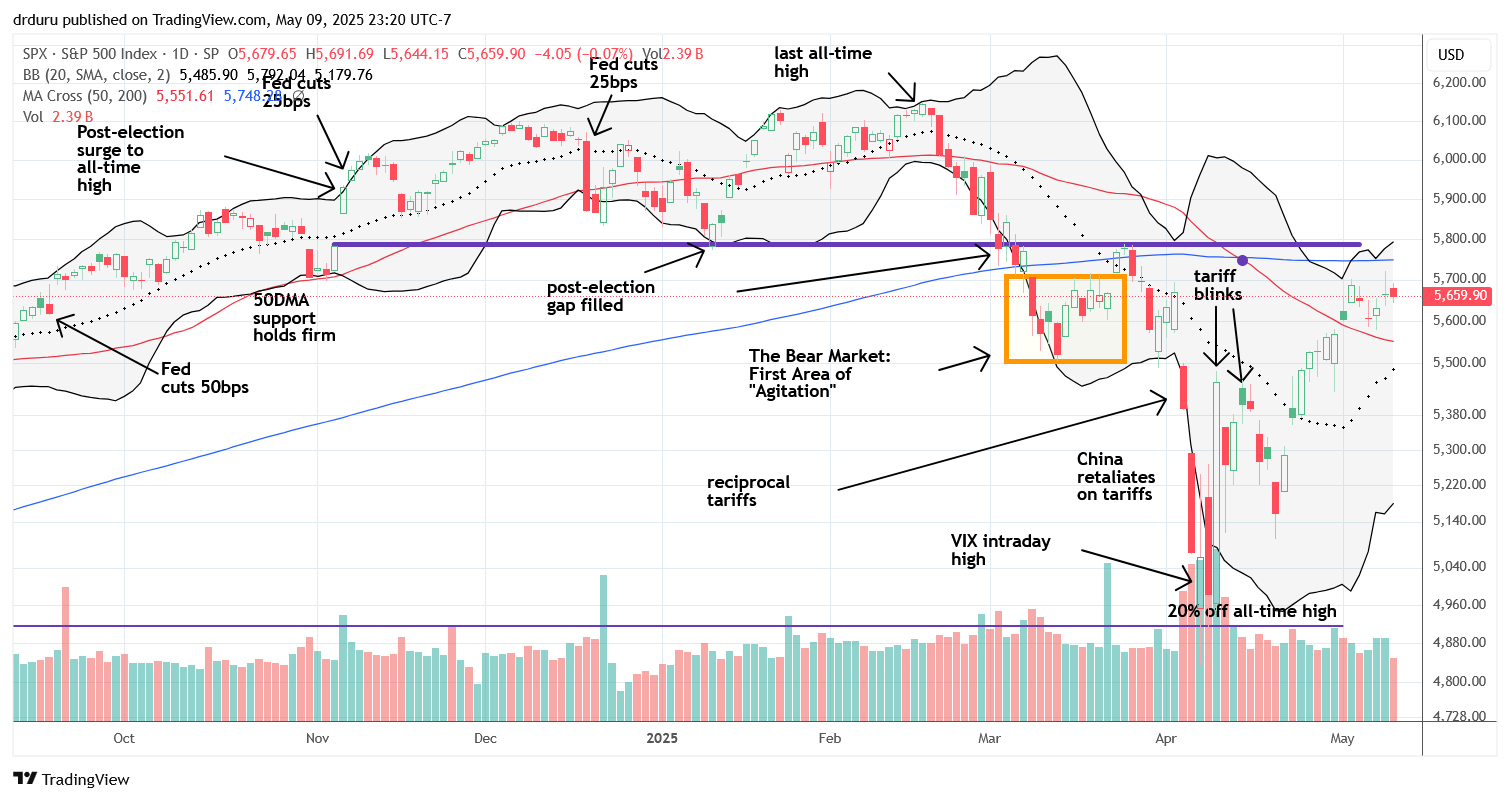
This calm was evident in the response to the first trade deal during this pause in reciprocal tariffs. On Thursday, the S&P 500 finished recovering its small Tuesday loss but faded just below resistance at its 200-day moving average (DMA) after news of a trade deal between the U.S. and the U.K. The deal was likely easy because the U.S. actually runs a trade surplus with the U.K. However, the American Automotive Policy Council (AAPC) was not happy:
“We are disappointed that the administration prioritized the UK ahead of our North American partners. Under this deal, it will now be cheaper to import a UK vehicle with very little U.S. content than a USMCA compliant vehicle from Mexico or Canada that is half American parts. This hurts American automakers, suppliers, and auto workers.”
News of trade talks with China over the weekend received a muted response from the stock market as well.
I am also surprised that the overall tone from earnings season has been generally positive. According to an analysis from FactSet the tone for the earnings for S&P 500 companies apparently deteriorated. From Q4 to Q1, earnings calls mentioning tariffs jumped from 53% to 93%, and uncertainty from 38% to 87%. Mentions of recession also surged.
Then again, the market does receive periodic boosts from the “Trump put.” On Thursday, the President encouraged Americans to buy stock because “this country will be like a rocketship that goes straight up.”
The Stock Market Indices
S&P 500 (SPY)
The S&P 500 (SPY) closed the week flat, finishing at the same point where it opened Monday. It was a tale of indecision: neither buyers nor sellers showed strong conviction. SPY ended the week just beneath its 200-day moving average (DMA) (the blue line), forming the cliffhanger at resistance. Sellers had their chance mid-week, especially post-Fed, but failed to drive momentum. Likewise, buyers couldn’t break through resistance.
NASDAQ (COMPQ)
The NASDAQ displayed a similar setup to SPY – trapped between its 50DMA (the red line) and 200DMA. However, unlike the S&P 500, the tech laden index has not crossed its 200DMA since early March’s 200DMA breakdown.

iShares Russell 2000 ETF (IWM)
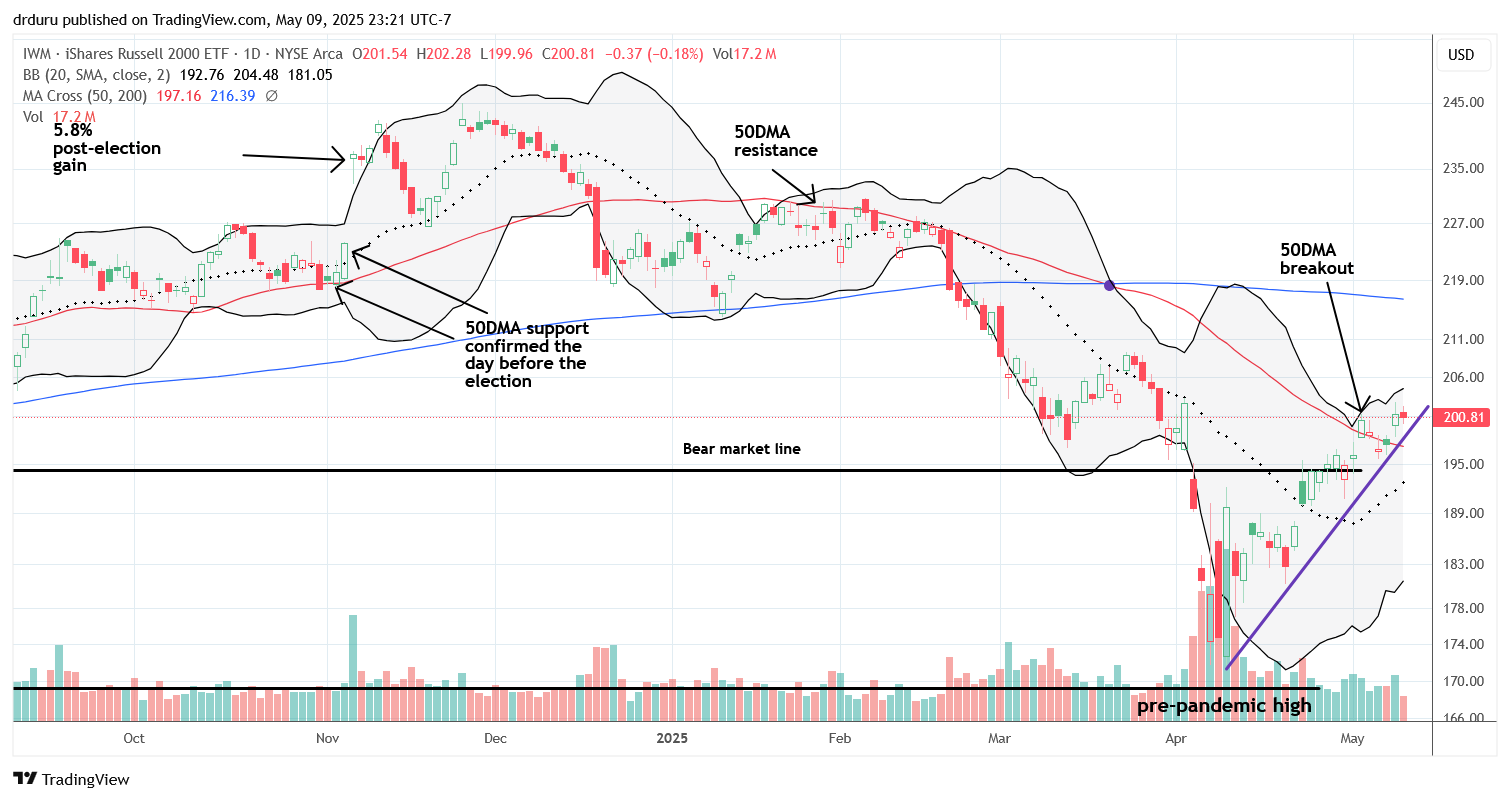
The iShares Russell 2000 ETF (IWM) was the standout index. A subtle uptrend line from tariff-related lows helped carry IWM above its 50DMA last week. This bullish move turned me from a passive to an active observer. I executed two profitable call option trades, capitalizing on Thursday’s 2% rally. I stayed out of weekend positions but plan to buy on dips to the uptrend line or 50DMA support.
The Short-Term Trading With A Cliffhanger
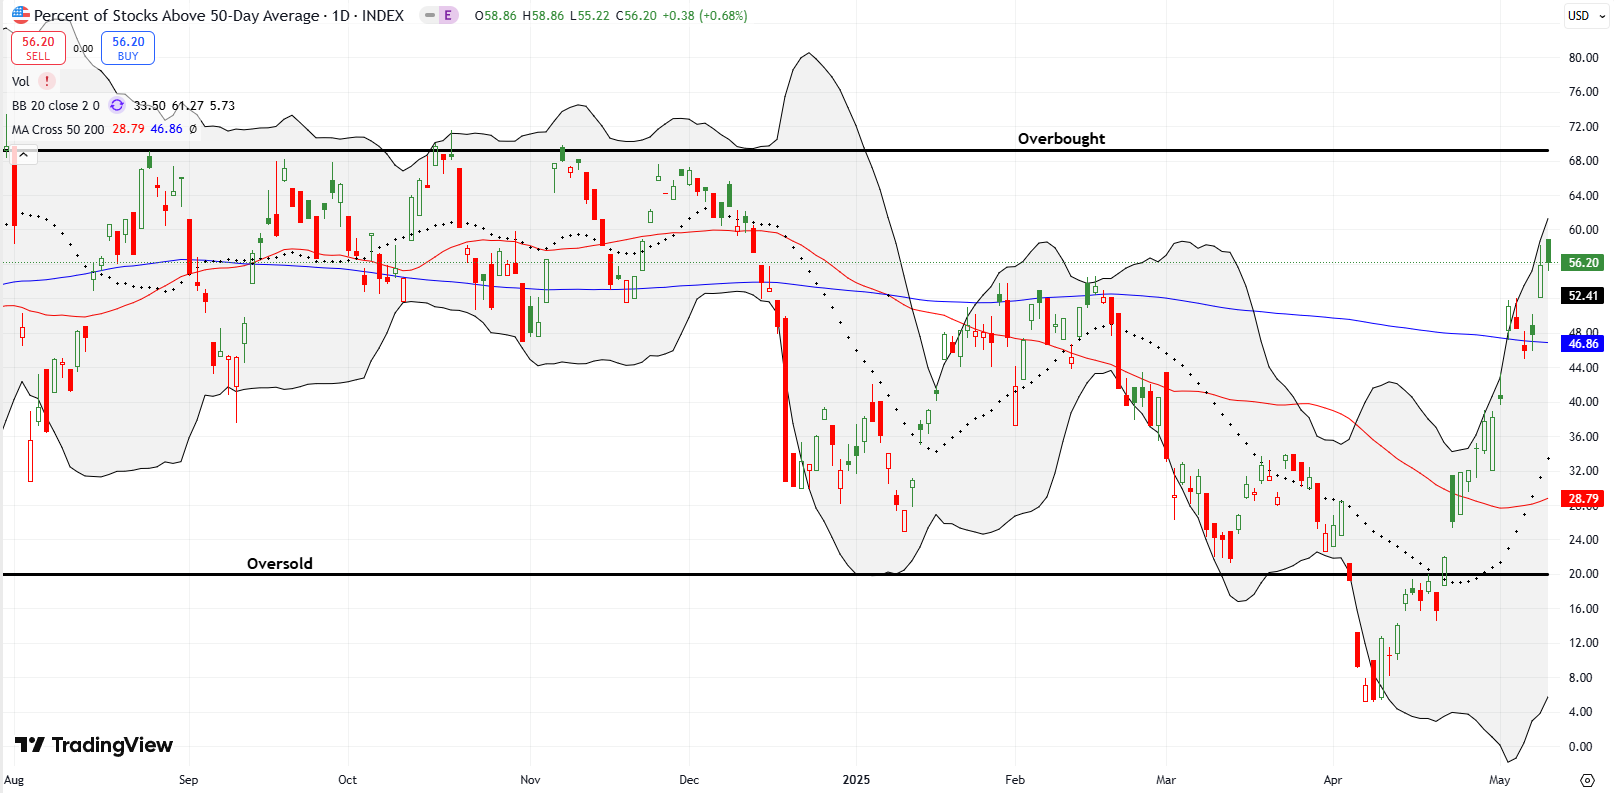
- AT50 (MMFI) = 56.2% of stocks are trading above their respective 50-day moving averages
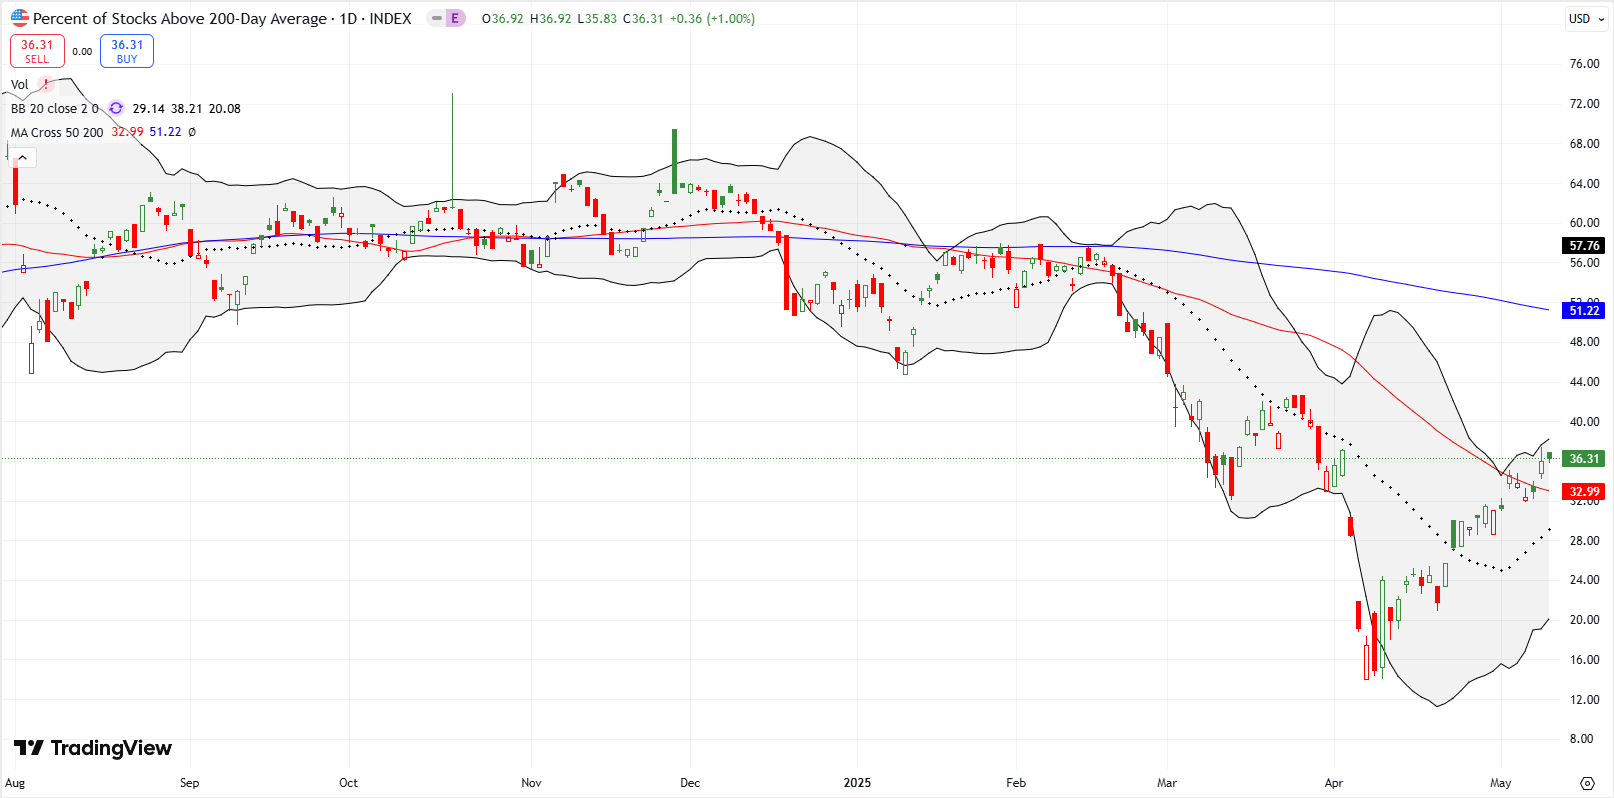
- AT200 (MMTH) = 36.3% of stocks are trading above their respective 200-day moving averages
- Short-term Trading Call: cautiously bullish
AT50 (MMFI), the percentage of stocks trading above their 50DMAs, demonstrated strong market breadth through the week – primarily driven by small-cap strength via IWM. I was tracking whether AT50 would reach the overbought 70% threshold as SPY and the NASDAQ simultaneously approached 200DMA resistance. That convergence still seems possible if current trends hold. If SPY and the NASDAQ continue their cliffhanger while IWM keeps sprinting, this synchronized test could define the market move.
AT200 (MMTH), the percentage of stocks trading above their 200DMAs, also improved. This indicator of longer-term health in market breadth finally broke above a key downtrend line but has yet to form a higher high. With many stocks still recovering from deep April losses and indices below their 200DMA, progress will be slow. Long-term healing continues.
The Volatility Index (VIX)
The VIX continued its decline, closing lower and finished erasing gains from the reciprocal tariff announcement on April 3rd. While still elevated above 20%, the VIX’s pattern reflects growing market comfort with the trading environment.

The Equities: Cliffhanger
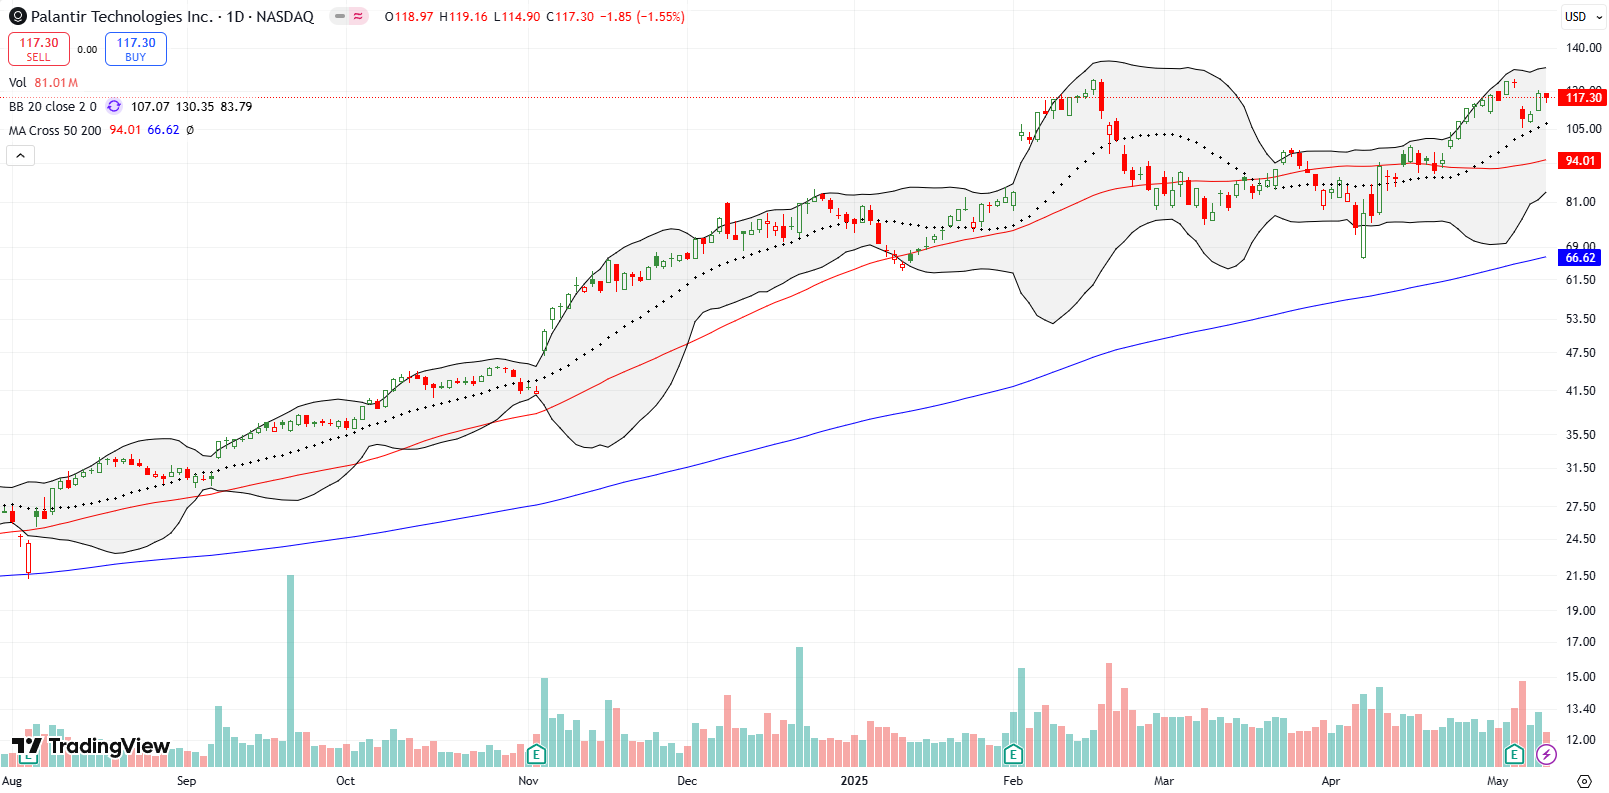
Palantir Technologies (PLTR) is showing a cliffhanger in the form of a potential double top after tapping its all-time high just before earnings. A 12% post-earnings drop followed, but buyers stepped in quickly. The 200DMA was not even tested during previous tariff turmoil – testament to the stock’s underlying strength.
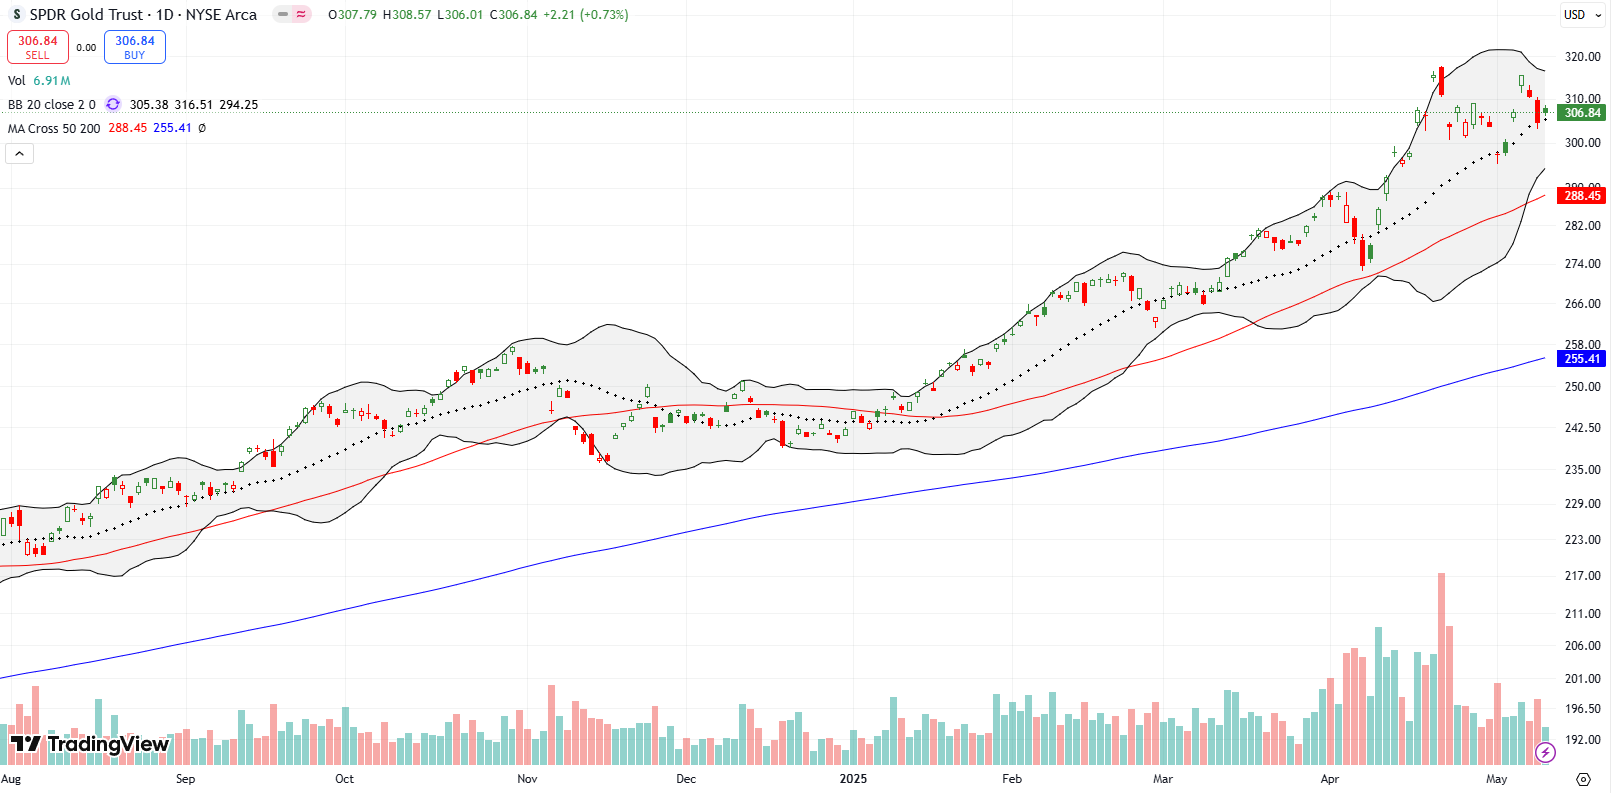
SPDR Gold Trust (GLD) failed to break out above a bearish engulfing top, despite a Monday surge. Sellers took profits at the all-time high. I took profits from my last trade and remain in trading mode without a core position.
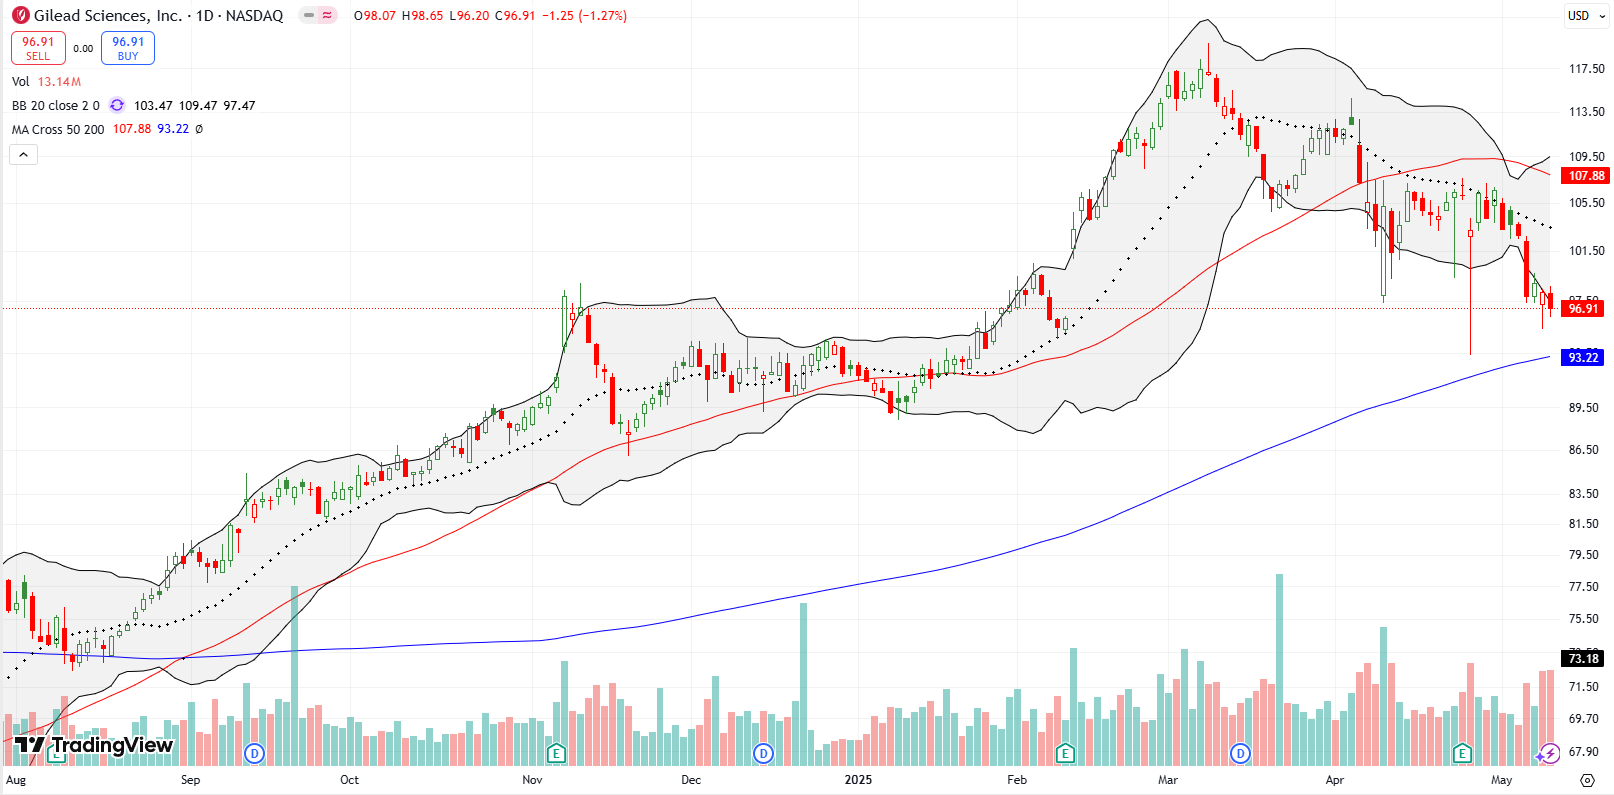
Gilead Sciences (GILD) saw renewed attention amid healthcare headlines, though I missed its recent rally. I will watch for a potential buy if it retests 200DMA support.
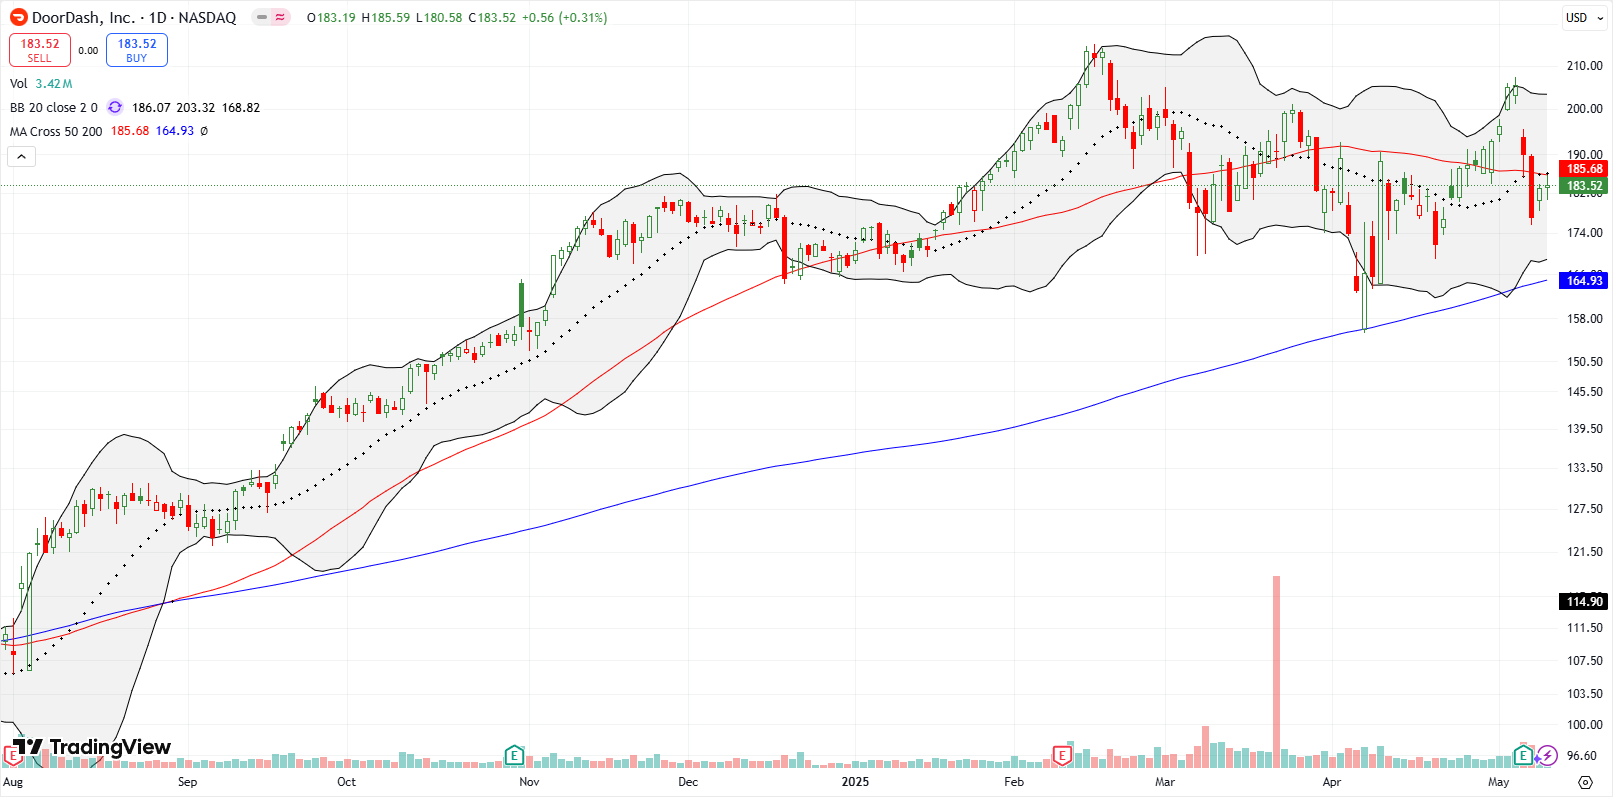
DoorDash (DASH) dropped 7.4% post-earnings and another 7.7% the day after, putting the stock back below its 50DMA. DASH previously bounced perfectly from 200DMA support in April, making it a candidate for a rebound trade if that level gets tested again.
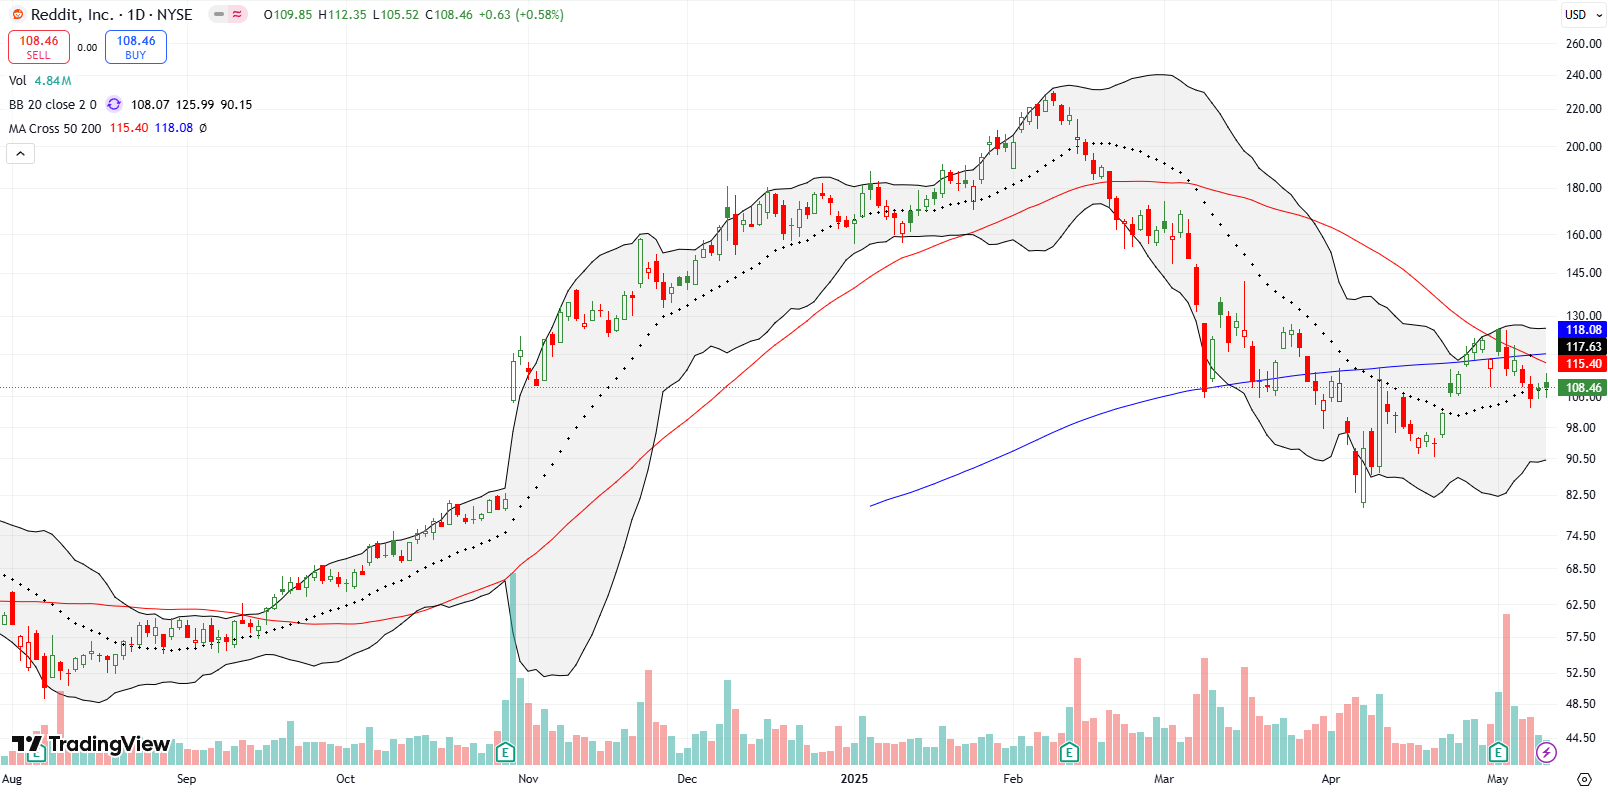
Reddit (RDDT) fell back into (mild) bearish territory post-earnings, failing to close above its 50DMA. RDDT remains a volatile stock, but a breakout above $119 and converging moving averages could set up a new bullish phase.
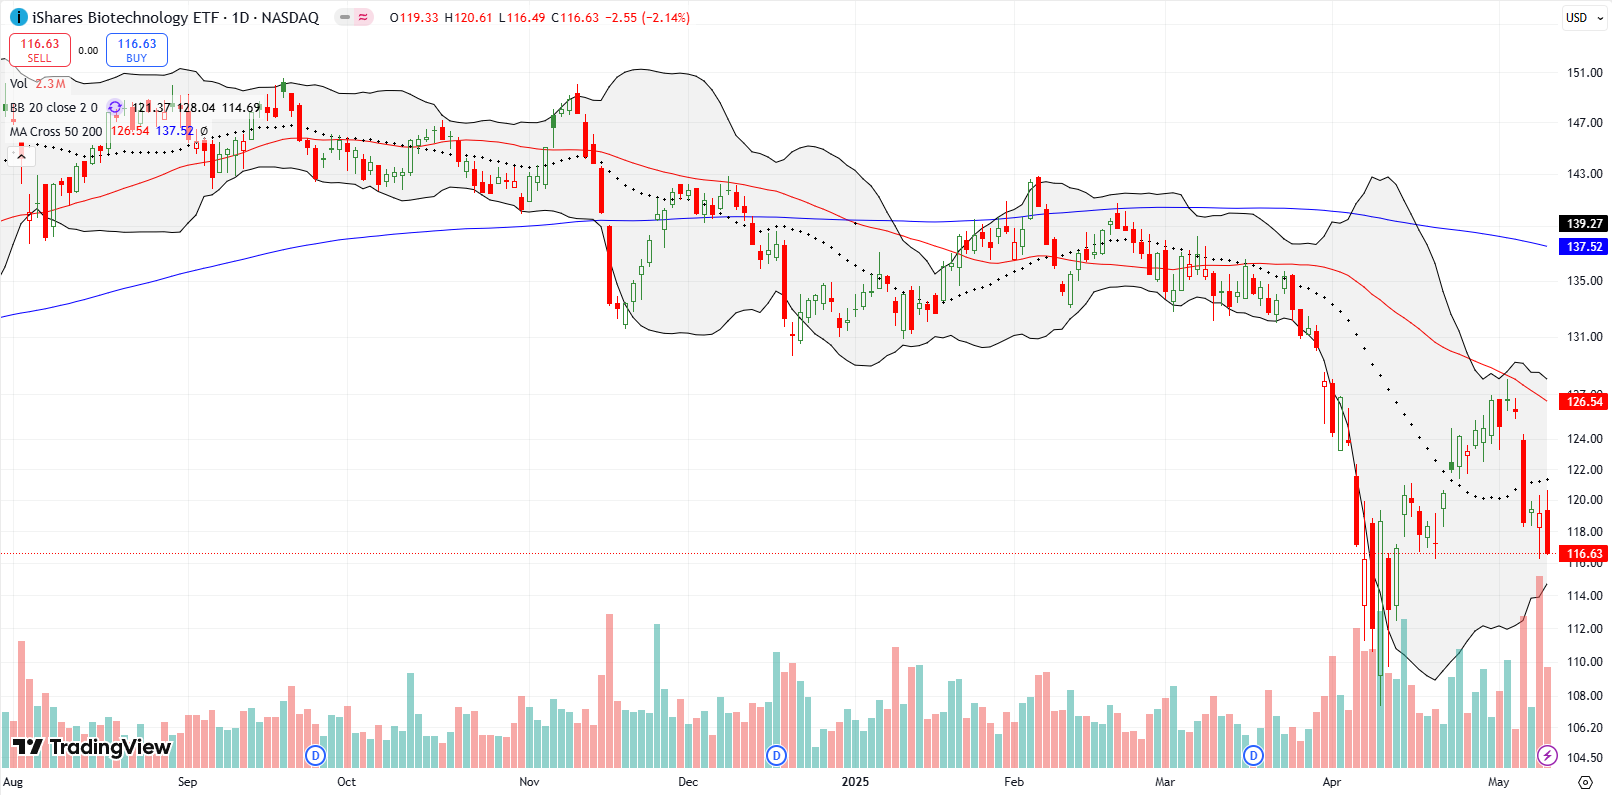
iShares Nasdaq Biotechnology ETF (IBB) summarized healthcare weakness for the week as new Federal appointees promise to make major changes in health care regulations and practices. IBB confirmed 50DMA resistance, fell 5.8% on Tuesday, followed by another 2.1% drop on Friday. I am avoiding the sector until technicals improve.
Toast (TOST) surprised with an 11.4% post-earnings jump, breaking above 50DMA resistance. TOST is now overextended beyond its upper Bollinger Band (BB). I’m watching for a pullback to consider a partial retracement entry.
The iShares MSCI Mexico ETF (EWW) remains a strong performer since the tariff drama started. I took profits after a confirmed breakout above the 200DMA and a new 7-month high. Now at an 11-month high, EWW provides further confirmation that sentiment on tariffs has made a 180-degree turn to the positive.
The KraneShares CSI China Internet ETF (KWEB) struggled at 50DMA resistance. I bought puts as a technical play, looking for a retest of 200DMA support even as trade talks have finally started with China.
CME Group (CME) hit all-time highs and remains a long-term hold. The stock benefits from market volatility, aligning with my thesis amid ongoing economic and tariff uncertainty.
Netflix (NFLX) dipped briefly on news that Trump was considering a 100% tariff on films made outside the U.S. based on national security concerns. NFLX quickly recovered from a 5% pre-open loss and closed with just a 2% loss. I hedged with a calendar put spread that will likely expire worthless as NFLX added a note of confirmation of tempered sentiment on tariffs.
Zoom Video Communications (ZM) confirmed a breakout above its 50DMA and is now above all key moving averages. While the stock is still in a long-term downtrend, the setup is strongly bullish short-term.
Like the S&P 500 and the NASDAQ, the U.S. Global Jets ETF (JETS) is sandwiched between its 50DMA and 200DMA. JETS jumped 3.3% on Thursday on news that the Federal Aviation Authority (FAA) may receive funding for a much needed overhaul. Still, I am surprised by the recent strength amid geopolitical tension and trade risks.
Best Buy (BBY) is testing 50DMA resistance. While bearish short-term, the rising 20DMA adds upward pressure. I am watching but not shorting due to headline risk.
Yelp Inc (YELP) soared 12% post-earnings. I sold into the strength, consistent with the stock’s long history of range-bound trading almost the entire time since its 2012 IPO. I will buy again if YELP dips back into the lower range.
The iShares U.S. Home Construction ETF (ITB) is again testing 50DMA resistance. I am a holder from a busted trade on the seasonal strength in home builders. On a confirmed breakout, I might add because I do not want to miss the market’s attempt to anticipate improvement from the current bear market in housing.
The market slammed Alphabet Inc (GOOG) on claims from an Apple (AAPL) executive, during testimony, that the company is considering replacing or supplementing Google search with AI search. GOOG plunged on 7.5% and ended a brief 50DMA breakout. Needless to say, GOOG stays off my list of AI-related buys.
Be careful out there!
Footnotes
Subscribe for free to get email notifications of future posts!
“Above the 50” (AT50) uses the percentage of stocks trading above their respective 50-day moving averages (DMAs) to measure breadth in the stock market. Breadth defines the distribution of participation in a rally or sell-off. As a result, AT50 identifies extremes in market sentiment that are likely to reverse. Above the 50 is my alternative name for “MMFI” which is a symbol TradingView.com and other chart vendors use for this breadth indicator. Learn more about AT50 on my Market Breadth Resource Page. AT200, or MMTH, measures the percentage of stocks trading above their respective 200DMAs.
Active AT50 (MMFI) periods: Day #11 over 20%, Day #9 over 30%, Day #7 under 40%, Day #2 over 50% (overperiod), Day #85 under 60% (underperiod), Day #186 under 70%
Source for charts unless otherwise noted: TradingView.com
Full disclosure: long IWM shares, long SPY shares and put spread, long NFLX put, long KWEB puts, long CME, long ZM, long ITB, long GOOG shares and calls
FOLLOW Dr. Duru’s commentary on financial markets via StockTwits, BlueSky, and even Instagram!
*Charting notes: Stock prices are not adjusted for dividends. Candlestick charts use hollow bodies: open candles indicate a close higher than the open, filled candles indicate an open higher than the close.
* Blog notes: this blog was written based on the heavily edited transcript of the following video that includes a live review of the stock charts featured in this post. I used ChatGPT to process the transcript.


Insight/2025/05.2025/05.06.2025_Podcast_Q1%202025%20SP%20500%20Midseason%20Earnings%20Update/03-percent-of-sp500-companies-citing-topics-on-earnings-calls-q1-vs-q4.png?width=1334&height=968&name=03-percent-of-sp500-companies-citing-topics-on-earnings-calls-q1-vs-q4.png)
What do you think about Goog stock overall conisdering DOJ, Chrome split news and ofcourse the competition coming from ChatGPT, Perplexity on core search. However as we know, w/o ads revenue even the new companies cant survive longer?
I am long GOOG, but NOT happy about it! I think GOOG is dead money at this point. Many better ways to play a resumption of a bull market. I wish I had a better opinion. Maybe once people appreciate the Waymo franchise, GOOG will regain some stature and premium. I also think YouTube is undervalued given its dominance in streaming long-form user generated content.