

Stock Market Commentary
Overhead resistance once prevailed over expanding market breadth, particularly over the past two trading sessions. The dominant headline was Federal Reserve Chair Powell’s warning about the difficult scenario facing the Fed due to tariffs. I interpreted his message as an intention to avoid responding as long as possible. For a market pricing in rate cuts to save the stock market from the economic chaos generated by DC, Powell’s reiteration of the Fed’s stance sounded like a major disappointment. Yet, any premature move—whether cutting or raising rates—could backfire. A rate cut could reignite inflation due to the inflationary effects of tariffs, while a rate hike could crush an already vulnerable economy. Last week’s sudden surge in long-term rates was a prime example of the instability looming.
NVIDIA (NVDA) was the other half of the dominant headlines. The major semiconductor company revealed it expects a $5.5 billion hit due to newly imposed China chip controls. While not devastating by NVDA’s standards, the market interpreted this as a sign of worsening conditions for tech as US-China tensions escalate. A small dose of optimism came post-market when China signaled readiness for dialogue with the US. However, I do not anticipate this having a substantial impact on Thursday’s trading session, the last before the Good Friday holiday.
The Stock Market Indices
S&P 500 (SPY)
The S&P 500 rallied on Monday to just below its 20DMA, buoyed by temporary relief from electronics tariffs. However, that optimism faded quickly. Tuesday’s 0.2% decline, followed by another 2.2% loss on Wednesday, confirmed that SPY remains entrenched in a well-defined downtrend. This move reaffirmed the strength of overhead resistance.
NASDAQ (COMPQ)
The NASDAQ performed even worse than the S&P 500, falling 3.1% today. The tech laden index briefly re-entered a conventional bear market, crossing the threshold of a 20% drop from its all-time high, before bouncing off technical support from the November 2021 high. The NASDAQ’s failure at its 20DMA overhead resistance was more decisive than SPY’s, reinforcing bearish momentum. Despite my typical bullishness in oversold conditions, I only executed a short day trade after observing this confirmed resistance (on SPY).
The iShares Russell 2000 ETF (IWM)
IWM was actually a relative outperformer, closing down only 1% due to a strong rebound from intraday lows. Still, this ETF of small caps remains technically unremarkable while trading between its bear market line and pre-pandemic high.
The Short-Term Trading Call With Overhead Resistance
- AT50 (MMFI) = 17.0% of stocks are trading above their respective 50-day moving averages (oversold day #10)
- AT200 (MMTH) = 23.5% of stocks are trading above their respective 200-day moving averages
- Short-term Trading Call: bullish
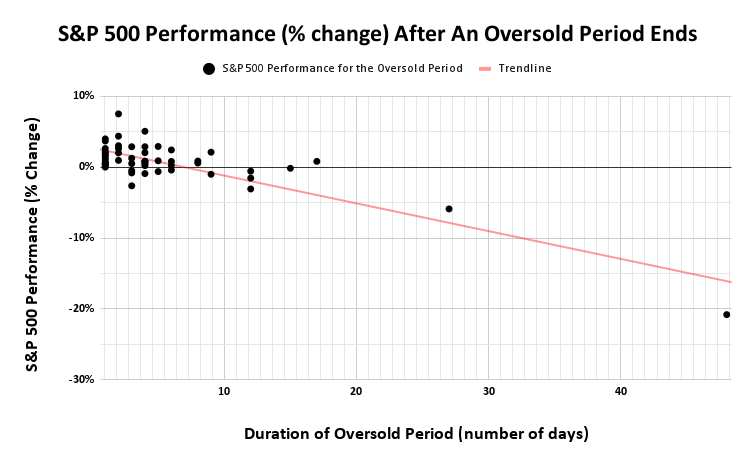
AT50 (MMFI), the percentage of stocks trading above their 50DMAs, closed at 17.0%, a surprisingly small decline from the previous day. My favorite technical indicator teased the oversold threshold at 20% before pulling back as if this line represented overhead resistance. As a reminder, the longer this oversold condition persists, the less meaningful the day-to-day movements become for AT50. Many stocks are now deeply below their falling 50DMAs. This oversold period is now on day number 10. Historically, only seven periods since 1950 have lasted longer. The longer it continues, the deeper the market descends into bear market trading, and a significant rally will need to lift the market above the oversold threshold.
Momentum in the VIX had been declining until today, when a strong rebound suggested an upward path toward the upper Bollinger Band (BB). This reversal spells more trouble for the bulls and buyers, particularly during this drawn-out oversold stretch.
The Equities: Overhead Resistance
Nvidia Corporation (NVDA)
NVDA plunged 6.8% following its China disclosure. It briefly dropped 8–9% intraday. The stock remains trapped below its 50DMA in a clear downtrend, repeatedly exhausting buyers with failed breakouts above its 20DMA. Both moving averages are serving as stiff overhead resistance.
Netflix (NFLX)
NFLX remains one of the few names above its 50DMA. The stock even recently tested 200DMA support and survived. With earnings ahead, I am not trading NFLX, but the stock deserves recognition for its relative strength.
CrowdStrike Holdings, Inc (CRWD)
CRWD now clings to 50DMA support after an attempted breakout above its former all-time high. I entered a diagonal call spread, hoping for a quiet expiry on Thursday and a resumed uptrend next week.
iShares Expanded Tech-Software Sector ETF (IGV)
I used IGV as a hedge with a put option after it confirmed 20DMA overhead resistance.
Alphabet Inc (GOOG)
GOOG dropped 2%, continuing a pattern of failed 20DMA breakouts. The stock followed broader big tech weakness. Accordingly, it looks set to eventually retest last week’s lows…or worse.
Apple (AAPL)
AAPL declined 4% despite tariff relief, revealing deeper vulnerabilities. Sellers dominated throughout the session, making last week’s gains look increasingly at risk. Note how AAPL faded all day on Monday after the gap up on the tariff relief for electronics. I ignored that sign of weakness when I bought a calendar call spread near the close…one of the downsides of sticking with the bullish short-term trading call because of the oversold period.
SPDR Select Sector Fund – Financial (XLF)
XLF fell 1.7%, failing at both the 200DMA and a neckline from a head-and-shoulders pattern as overhead resistance. This double resistance failure puts financials back into bearish trading territory.
Ucore Rare Metals (UURAF)
Rare earths company UURAF soared 29% after China halted rare earth exports. The stock has maintained a gap-up pattern over the last two days. I lost my patience and took profits on my position during the last rally! Note how well the 20DMA (the dotted) line provided support for the price action.
MP Materials Corp (MP)
Rare earths company MP initially surged 22% on China’s ban but reversed sharply the next day, dropping 9.1%. A 10% rebound today returned MP to its Monday close. This whiplash action is surprising, yet the stock looks poised to resume its upward momentum. I am looking to jump in soon.
SPDR Gold Shares (GLD)
Gold has known no overhead resistance for a long time. GLD soared 3.3%, forming a parabolic rally. This move reflects rising fear in financial markets and waning faith in the US dollar. My call spread was taken out at my profit target on Tuesday…an action that by itself suggested GLD was about to surge! However, parabolic moves are not built to last. I am very interest to see just how much concern for markets is embedded in gold…the higher and faster it goes, the greater the fears.
Currency Market Overview
While gold warns of increasing concerns about financial markets and the economy, the US dollar index (DXY) is breaking down, seemingly confirming the worries. The dollar index’s weakness largely comes from a strong euro, which makes up over half the index. The dollar index has hit a three-year low and broken below key trading ranges.
Highlights by Currency:
- The US dollar index (DXY): Broke to a three-year low, led by euro strength and signaling major bearish sentiment.
- Euro (EUR/USD): Broke above 200DMA support and surged to October 2021 levels.
- British Pound (GBP/USD): Still below last September’s highs.
- Swiss Franc (USD/CHF): Lowest point since August 2011 (strong Swiss franc).
- Japanese Yen (USD/JPY): Returned to last September’s levels, testing support.
- Mexican Peso (USD/MXN): Testing 200DMA support.
- Canadian Dollar (USD/CAD): Broke below 200DMA and a 4.5-year high trendline.
- Australian Dollar (AUD/USD): Outperforming during dollar weakness.
- South African Rand (USD/ZAR): Dropped sharply (strong rand), potentially a good sign for emerging markets.
Be careful out there!
Footnotes
Subscribe for free to get email notifications of future posts!
“Above the 50” (AT50) uses the percentage of stocks trading above their respective 50-day moving averages (DMAs) to measure breadth in the stock market. Breadth defines the distribution of participation in a rally or sell-off. As a result, AT50 identifies extremes in market sentiment that are likely to reverse. Above the 50 is my alternative name for “MMFI” which is a symbol TradingView.com and other chart vendors use for this breadth indicator. Learn more about AT50 on my Market Breadth Resource Page. AT200, or MMTH, measures the percentage of stocks trading above their respective 200DMAs.
Active AT50 (MMFI) periods: Day #10 under 20% (oversold), Day #14 under 30%, Day #35 under 40%, Day #47 under 50%, Day #72 under 60%, Day #173 under 70%
Source for charts unless otherwise noted: TradingView.com
Full disclosure: long SPY shares, long SPY put spread, long IWM, long AAPL calendar call spread, long QQQ calendar diagonal call spread, long NVDA calendar call spread, long CRWD diagonal call spread, long GOOG, long IGV put, short EUR/USD, long AUD/USD, long USD/JPY
FOLLOW Dr. Duru’s commentary on financial markets via StockTwits, BlueSky, and even Instagram!
*Charting notes: Stock prices are not adjusted for dividends. Candlestick charts use hollow bodies: open candles indicate a close higher than the open, filled candles indicate an open higher than the close.
* Blog notes: this blog was written based on the heavily edited transcript of the following video that includes a live review of the stock charts featured in this post. I used ChatGPT to process the transcript.
MP: the chairman/CEO sold about 200K shares Monday. He still has over 14 million.
Oh my…
I also saw in news today that MP had to stop sending material to China for processing.