
Stock Market Commentary
Stock market angst reached a kind of crescendo last week. Poor economic data and bad news – including a plunge in consumer confidence, a 180 degree reversal in the Atlanta Fed’s Q1 GDP growth projection from +2.3% to -1.5%, risk-off trading in cryptocurrencies (apparently due to a massive hack of ByBit), and increasing uncertainty over tariff policy and other geopolitical tensions – all came to a head last Thursday. On Friday, the market flailed at its lows until a rush of buyers sent stocks soaring into close. While those two hours look like a classic oversold bounce, the stock market was not oversold enough for my taste. Market breadth did not drop low enough relative to the weight of the news and relative to depth of the last pullback in market breadth. Moreover, the NASDAQ was the only major index to directly test a key support level.
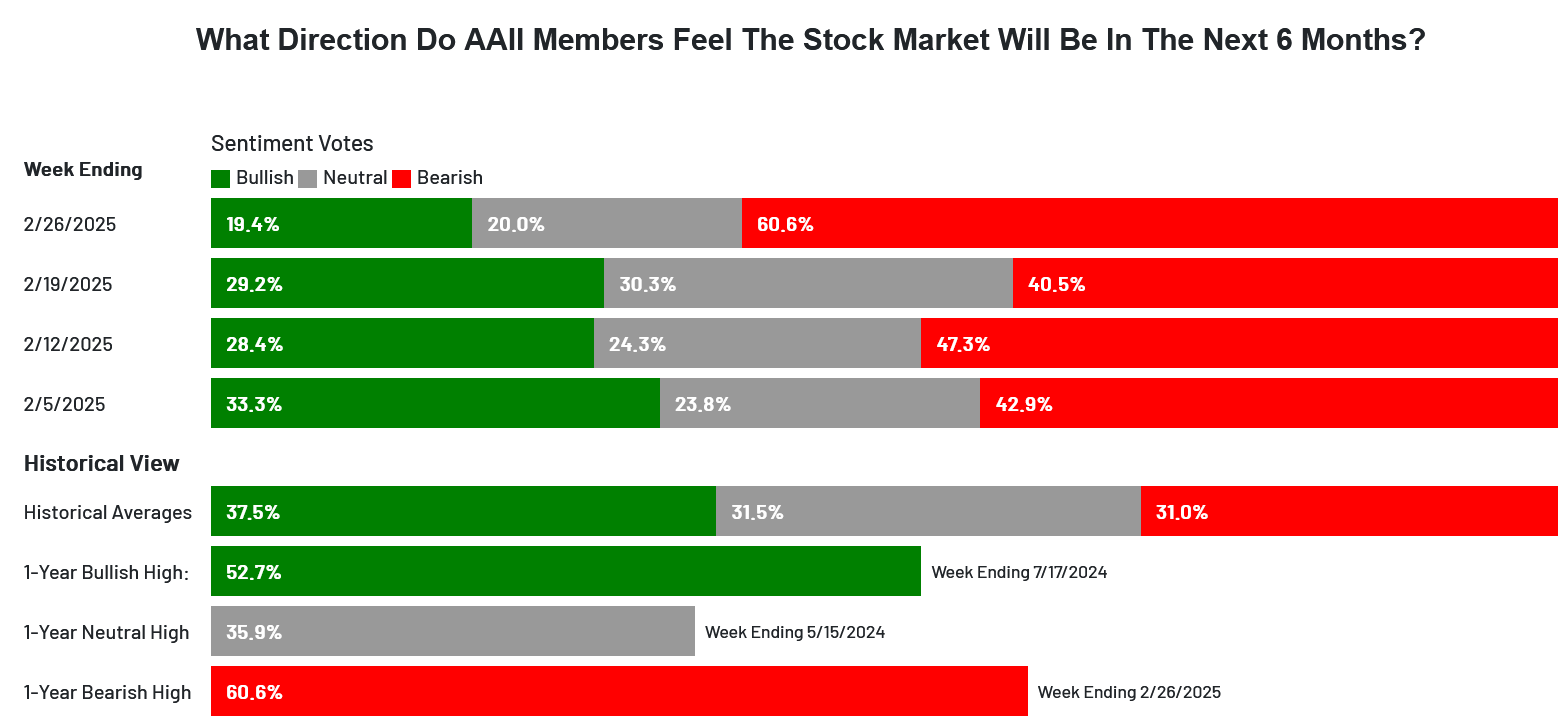
Having said that, the sudden surge in bearish sentiment in the survey conducted by the American Association of Individual Investors got my attention. This level of bearishness definitely looks like a tradeable extreme!
The Stock Market Indices
The S&P 500 (SPY) started the week with a breakdown below support at its 50-day moving average (DMA) (the red line below). The loss made me lean bearish for most of the week. The next day, the index confirmed the 50DMA breakdown and validated my caution about the red flag pullback that I wrote about the week prior.
The seesaw action between Thursday and Friday reminded me why I dared not flip my trading call from neutral to (cautiously) bearish just yet. On Thursday the S&P 500 lost 1.6%, and I wondered whether I should have indeed flipped officially bearish. The pullback was swift enough to put my protective March SPY 565/550 put spread deep into the green. Friday reversed those losses with a 1.6% gain reminiscent of this bull market’s typical behavior of quickly putting past troubles behind it. The entire rebound happened in the final two hours of trading.
In this on-going bull market, an itch to buy underlies any sell-off. Thus, sharp pullbacks are likely to generate the kind of rebounds characteristic of recoveries from oversold periods. Still, the market was/is not oversold enough for my taste. A test of uptrending 200DMA support (the blue line) is long overdue.
")
The NASDAQ (COMPQX) DID test 200DMA support – in picture-perfect fashion even. Until Friday’s rebound, the tech laden index suffered a steep sell-off starting with the prior week’s red flag pullback. The selling was so sharp that Friday’s 1.6% loss only reversed about half of Thursday’s loss. Moreover, the NASDAQ closed right at resistance from 2025’s previous intraday low (in January). Still, with the combination of a test of 200DMA support and the fill of the post-election gap (from November 6, 2024), the NASDAQ is primed for a rebound back to converged resistance from its 20DMA (the dashed line) and the 50DMA. I am a buyer of QQQ call options if the NASDAQ pushes higher on Monday.
Note that the NASDAQ’s last 200DMA test (August 5, 2024) was also picture-perfect, but that event was an “oversold enough” trading period. The previous 200DMA test was in October, 2023. That oversold moment turned into a major bottom for the stock market. Thus I am a bit surprised that the NASDAQ is testing 200DMA support here and market conditions are not oversold enough for my taste.
")
The iShares Russell 2000 ETF (IWM) is back in bearish territory with a confirmed 200DMA breakdown. The ETF of small caps rebounded on Friday with a 1.1% gain that still left IWM at a 5 1/2 month closing low. Like the NASDAQ, IWM is back to the prior intraday low for 2025. As is my practice, I bought IWM call options on the back end of the sharp selling even as my previous calls expired harmless.
")
The Short-Term Trading Call While Not Oversold Enough
- AT50 (MMFI) = 40.5% of stocks are trading above their respective 50-day moving averages
- AT200 (MMTH) = 48.5% of stocks are trading above their respective 200-day moving averages
- Short-term Trading Call: neutral
AT50 (MMFI), the percentage of stocks trading above their respective 50DMAs, closed the week at 40.5%, just one percentage point below the previous week. My favorite technical indicator got as low as 37.3% a level where during a bear market I evaluate the potential for “oversold enough” trading conditions. In this case, the news flow is poor and prospects for future news flow look even worse (like Canada bracing for economic warfare). Moreover, the previous sell-off took AT50 as low as 25%. So, market breadth is just not oversold enough for my taste at this juncture.
Even as I expect some kind of relief rally in the coming week, especially for the NASDAQ, I am as loathe to flip bullish here as I was loathe a week ago to go bearish. Thus, I left the short-term trading call at neutral…and I will try to swing with the flavor of the day.
NVIDIA Corporation (NVDA) was once again at the center of trading action, especially for tech. NVDA reported earnings Wednesday night, and the immediate reaction was benign. NVDA ended after hours trading around 1% down or so. By Thursday’s open, NVDA gapped up slightly….and ran smack into overhead 50DMA resistance. Sellers took over from there.
NVDA ended the day with a startling 8.5% loss and a 200DMA breakdown. I still do not know what caused such a sudden sentiment shift. However, the selling has the mark of big sellers looking to take profits. And why not? NVDA has made no progress since last June’s all-time high and subsequent bearish engulfing top. During that time the stock has delivered multiple, sizeable drawdowns. Given last week’s trading action, I am even more confident in my assumption that NVDA will spend many more months churning before it challenges the last set of bearish engulfing tops.
In the middle of NVDA’s sharp 4.0% rebound off its 200DMA lows, I bought a strangle position with weekly puts and a weekly calendar call spread. Given NVDA broke 200DMA support for the second time in a month, I am more bearish on the stock. However, if the stock breaks out above the 200DMA, I fully expect a run similar to the last breakout.
")
I took a chance on Apple Inc (AAPL) and triggered the Apple Trading Model (ATM). Starting Wednesday I bought $247.50 strike call options expiring this coming Friday. However, I missed the best buying opportunity when AAPL dipped so sharply on Friday, it almost tested 200DMA support. At least the close above the 50DMA keeps the ATM in play. I am looking for a quick test of last week’s highs.
")
Palantir Technologies Inc (PLTR) has been a darling and controversial company and stock. The company says it is “focused on creating the world’s best user experience for working with data, one that empowers people to ask and answer complex questions without requiring them to master querying languages, statistical modeling, or the command line.” Palantir’s software platform includes AI deployments. The company works across a wide range of verticals, but it caught some recent attention for its government contracts. However, I doubt a significant share of these contracts are at risk in the current purge that is going on in the government workforce and agencies because PLTR seems to take on mission critical work. For example, from the latest earnings call:
“We take pride in supporting the critical missions we’re delivering against. Notable deals included the U.S. Army extending its long-standing partnership with Palantir to deliver the Army Vantage capability in support of the Army Data Platform for up to four years. We also announced our recent contract expansion with U.S. Special Operations Command, marking the first deployment of Mission Manager to U.S. Special Operations Forces units. Our international commercial business continues to see pockets of growth alongside the large renewals of some of our long-standing customers.”
That earnings call was worth another 24.0% gain. Buyers continued pushing PLTR to new highs until the purge in the Federal government reached a feverish pitch. PLTR quickly gave up all its post-earnings gains and even marginally confirmed a 50DMA breakdown on Friday. With PLTR barely clinging to its primary uptrend from its 50DMA, I speculated on a March $100/$115 call spread and added another $100 strike call on Friday. I figure a celebrated momentum stock like this will not easily give up its uptrend even with nosebleed valuation metrics like 53x forward sales. (Note PLTR is a stock I should have bought a long time ago given the strong uptrend and the company’s work in analytics!).
")
Computer aided design (CAD) software company Autodesk Inc (ADSK) is part of a small group of stocks that tested 200DMA supports on Friday. I reviewed this list for bullish swing trade opportunities in the coming week. The 200DMA is a critical long-term uptrend. So, if the story of a stock remains strong, then buyers will step into what they consider an “oversold” or “overly discounted” situation. Trading gets bearish if 200DMA support gives way. ADSK is in a particularly critical spot given its 200DMA test came on the heels of a 2.7% post-earnings loss. Over the course of the day, ADSK closed reversed its post-earnings loss and briefly dipped below 200DMA support.
")
Learning management software company Docebo Inc (DCBO) caught my attention as a part of a group of stocks on Friday that sold off sharply post-earnings. DCBO lost 14.0% after dropping as far as 26.0%, a level last seen over 2 years ago. After reading the surprisingly bullish commentary on the financial reporting of the earnings report, I am looking to buy DCBO for an oversold bounce. Even with the rebound off the lows, DCBO is still well below its lower Bollinger Band (BB) (the two curving black lines that defines expected price volatility (95% of the trading action).
")
Quantum stocks continue to sell-off from their feverish peaks set in December. Quantum Corporation (QMCO) has steadily its last peak in December. Last week QMCO (marginally) confirmed a 200DMA breakdown. QMCO is now down 83.3% from its last closing high. At any moment, QMCO could soar from a rush of “bargain hunting”, but I see no reason to dare to try to jump in and time such a surge. Likely at some point in coming weeks or months, QMCO will finish reversing most of the gains from November’s surge which saw the stock increase in value an amazing 7x in just 3 days.
")
")
")
Be careful out there!
Footnotes
Subscribe for free to get email notifications of future posts!
“Above the 50” (AT50) uses the percentage of stocks trading above their respective 50-day moving averages (DMAs) to measure breadth in the stock market. Breadth defines the distribution of participation in a rally or sell-off. As a result, AT50 identifies extremes in market sentiment that are likely to reverse. Above the 50 is my alternative name for “MMFI” which is a symbol TradingView.com and other chart vendors use for this breadth indicator. Learn more about AT50 on my Market Breadth Resource Page. AT200, or MMTH, measures the percentage of stocks trading above their respective 200DMAs.
Active AT50 (MMFI) periods: Day #302 over 20%, Day #23 over 30%, Day #1 over 40% (overperiod ending 1 day below 40%), Day #7 under 50% (underperiod), Day #39 under 60%, Day #140 under 70%
Source for charts unless otherwise noted: TradingView.com
Full disclosure: long SPY put spread, long IWM calls, long NVDA strangle, long AAPL calls, long PLTR call spread and call
FOLLOW Dr. Duru’s commentary on financial markets via StockTwits, BlueSky, and even Instagram!
*Charting notes: Stock prices are not adjusted for dividends. Candlestick charts use hollow bodies: open candles indicate a close higher than the open, filled candles indicate an open higher than the close.