Stock Market Commentary
The week opened with market breadth dropping to within five percentage points of the oversold threshold. This was the closest encounter with oversold since late October, 2023. The stock market never looked back from there. A favorable mid-week inflation report helped propel the stock market with the assistance of declining long-term bond yields. The momentum was enough to reposition the S&P 500 and the NASDAQ into bullish setups. As a result, the stock market looks like it was “oversold enough”. Yet, the stock market has churned since mid-December’s last all-time highs and sits in a wide trading range. A number of political and economic uncertainties await, and the stock market actually looks like it is waiting to respond. Accordingly, until the next all-time highs, the stock market promises to continue delivering yo-yo, up and down action.
The Stock Market Indices
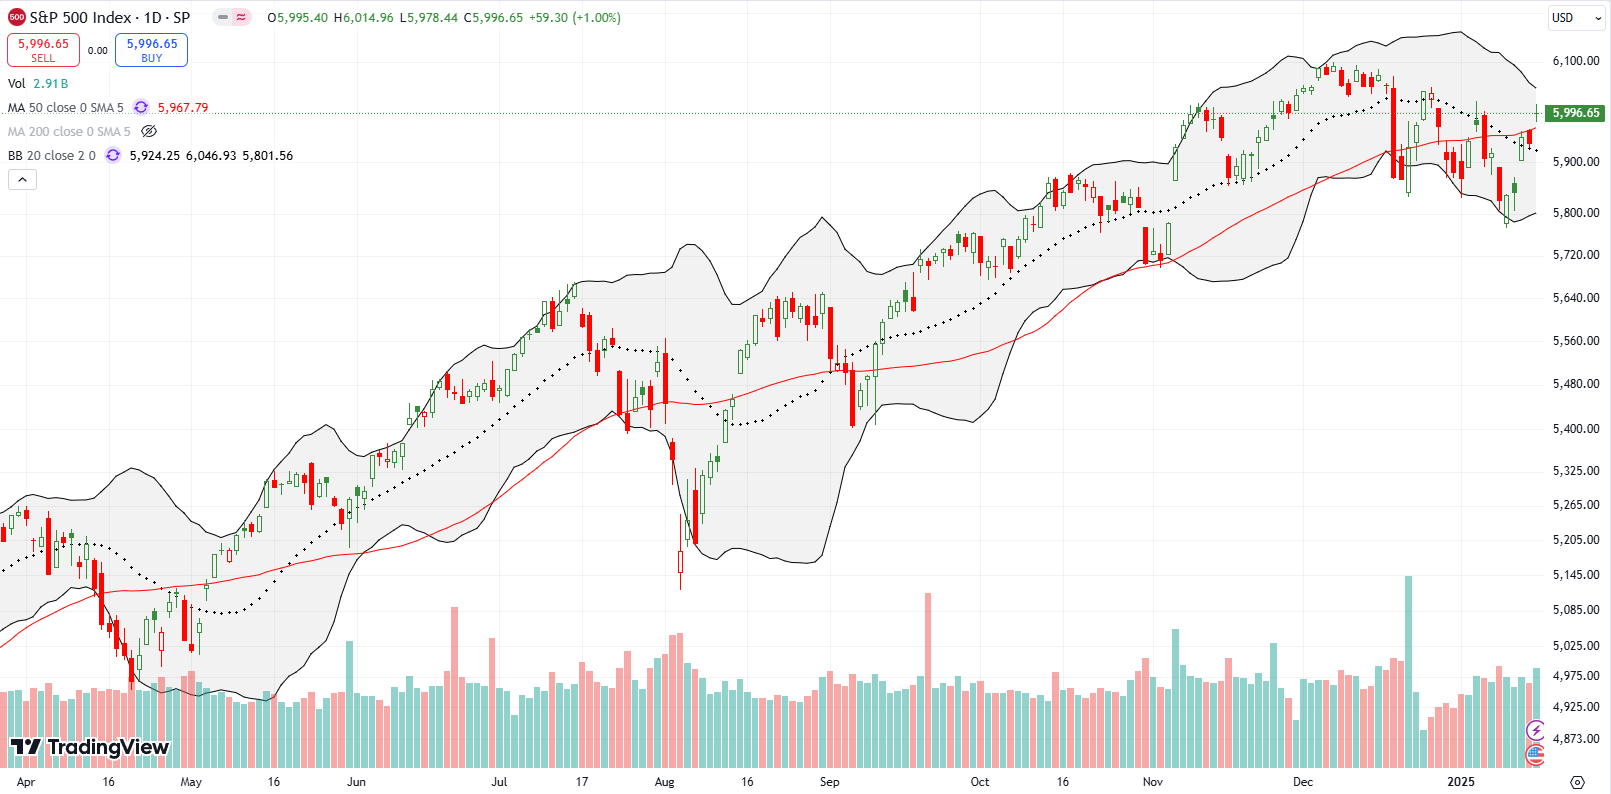
The S&P 500 (SPY) came into the week with a confirmed breakdown below its 50-day moving average (DMA) (the red line below). A gap down open looked set to extend the pullback that started with mid-December’s plunge. Buyers jumped in and barely looked back from there. After a brief pause at 50DMA resistance on Thursday, buyers ended the week with a 50DMA breakout and a 3-week high. The confirmed breakout above the 20DMA (dashed line below) ends a short-term downtrend.
Although the S&P 500 is repositioned for bullish momentum, I used the opportunity to refresh a hedge against bullishness with a March $565/550 put spread.
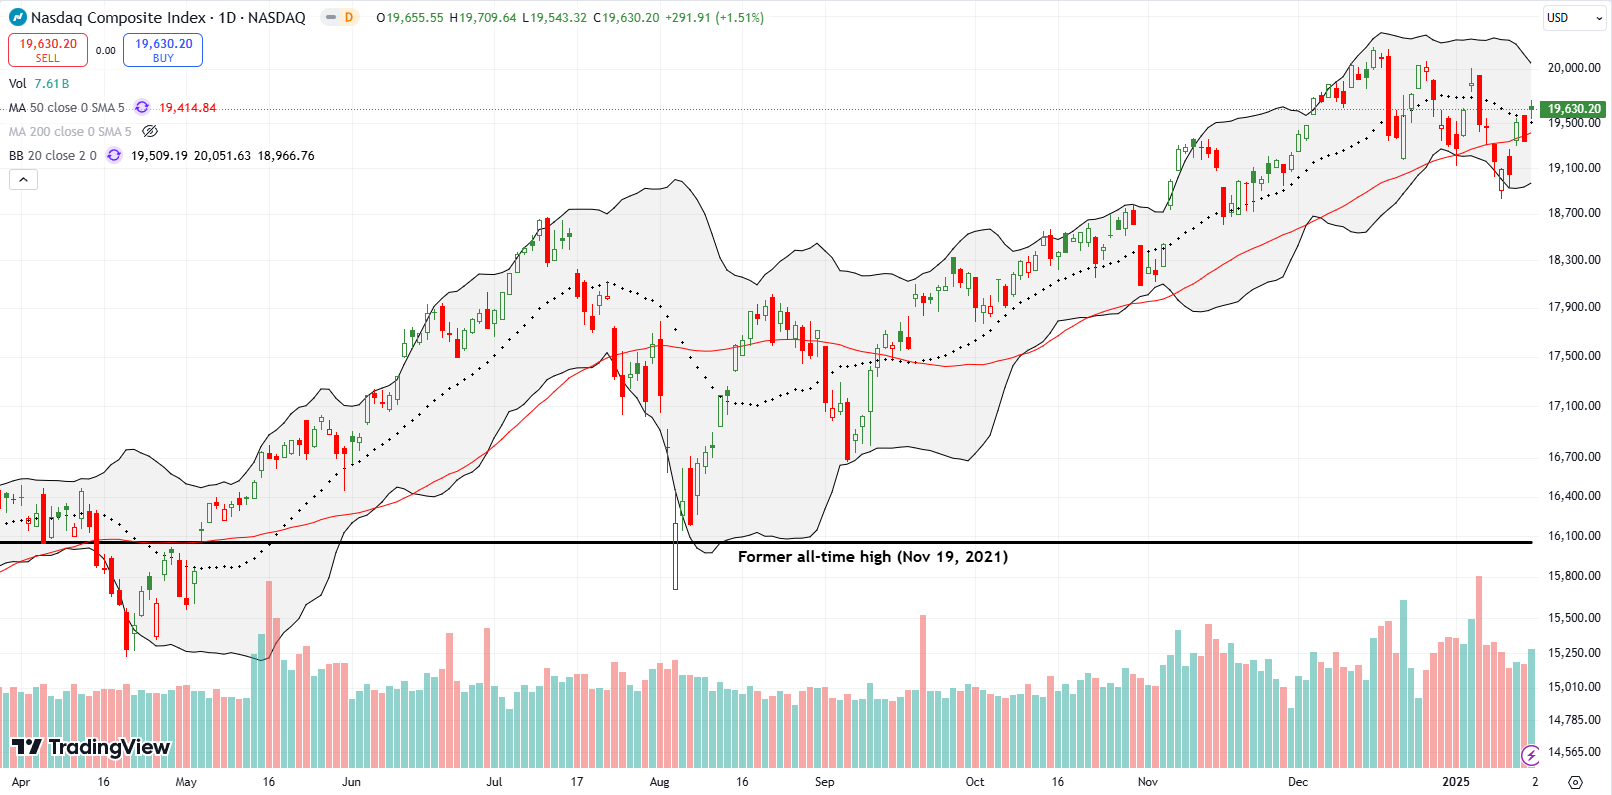
The NASDAQ (COMPQX) went into the week with a fresh 50DMA breakdown. The tech-laden index confirmed the 50DMA breakdown despite a sharp rebound off Monday’s intraday low. Next, a fade and further weakness on Tuesday looked ominous. The post-CPI rally on Wednesday saved the NASDAQ with a 50DMA breakout that got confirmed by Friday’s gain and 20DMA breakout. The rapid sequence of bearish and bullish moves is characteristic of yo-yo action around and through important trendlines.
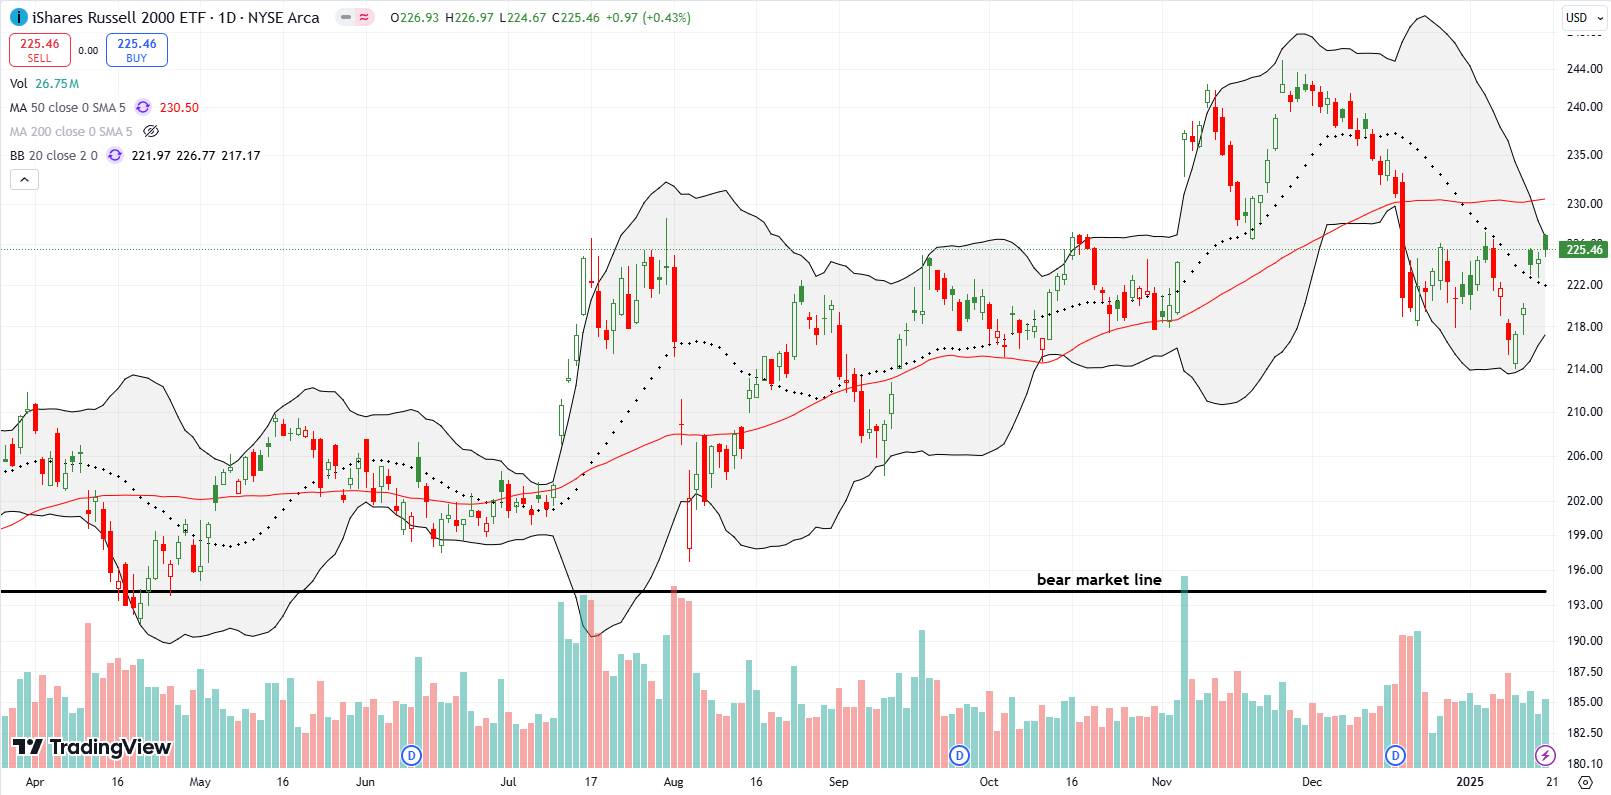
The iShares Russell 2000 ETF (IWM) started the week with a 3-month low and laggard status relative to the other major indices. Buyers jumped into IWM from the open and never looked back. IWM gained every day of the week and closed the week at a new (marginal) high of the year. This spurt of enthusiasm for small caps helped push market breadth away from the oversold threshold and into its highest close of the year.
The Short-Term Trading Call After Oversold Enough
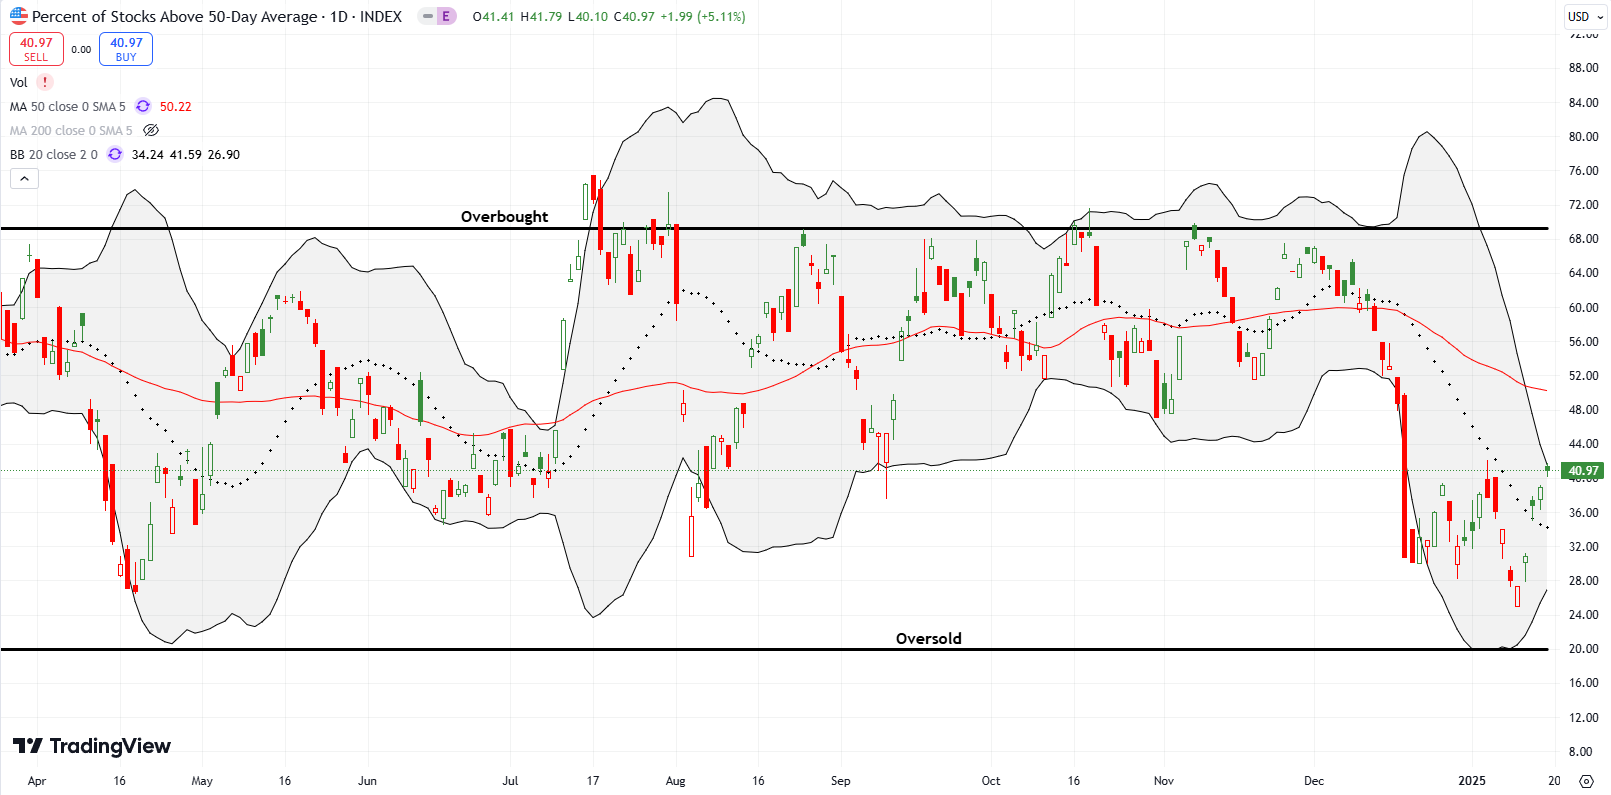
- AT50 (MMFI) = 40.1% of stocks are trading above their respective 50-day moving averages
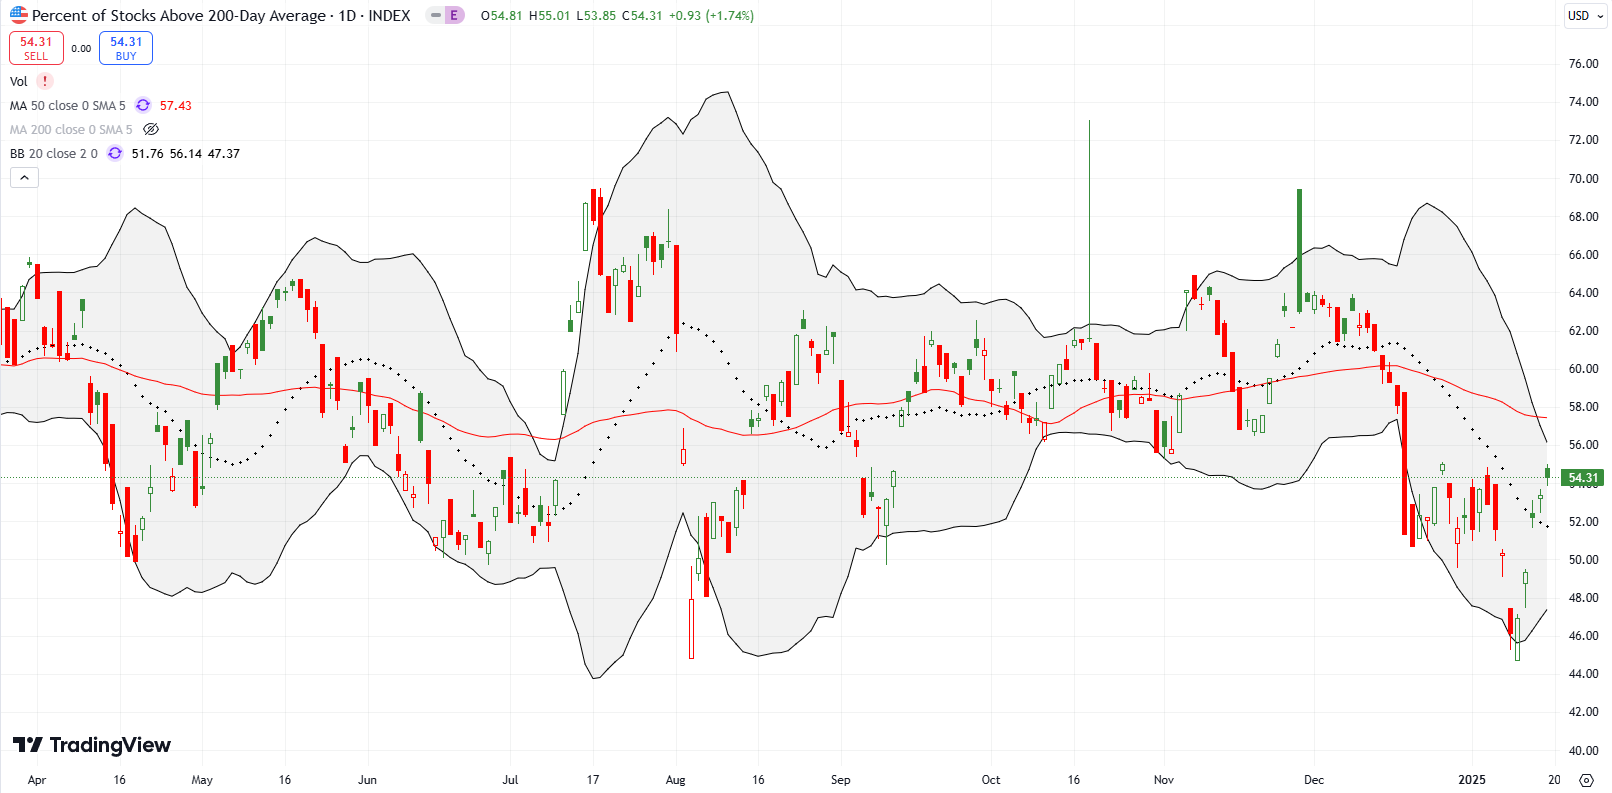
- AT200 (MMTH) = 54.3% of stocks are trading above their respective 200-day moving averages
- Short-term Trading Call: neutral
AT50 (MMFI), the percentage of stocks trading above their respective 50DMAs, closed the week at 40.1%. As stated earlier, my favorite technical indicator rallied from a near miss with the overbought threshold (at 20%) to a new high for the year. That momentum qualifies for an assumption that market breadth got oversold enough to create bullish trading conditions. However, since I anticipate more choppy trading, I am patiently leaving the short-term trading call at neutral. The main lesson from the market’s latest bounce back is that the raging bull market remains well-intact….even with plenty of room ahead for disappointment.
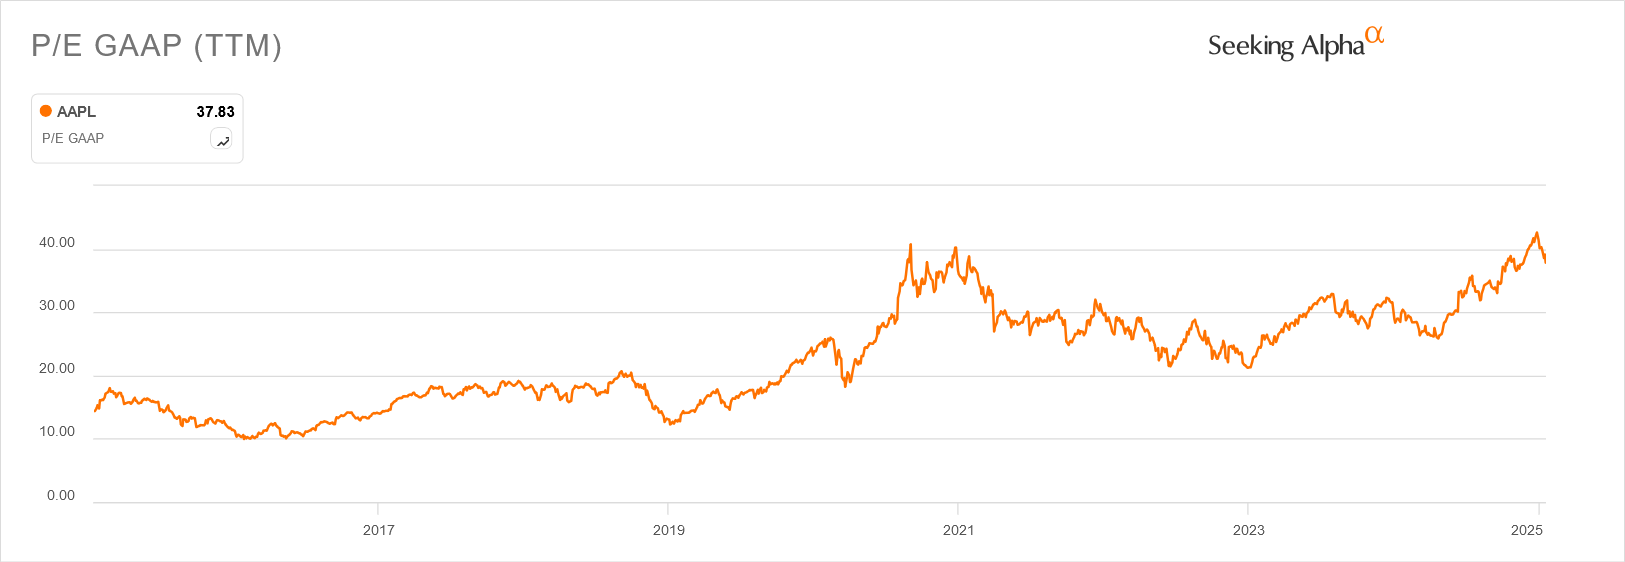
Apple Inc (AAPL) is again a key feature stock. AAPL ended the previous week with an ominous 50DMA breakdown. AAPL’s subsequent rebound stopped cold at 50DMA resistance with a 4.0% slide confirming resistance. Once again AAPL faces concerns about demand in China. Each time this kind of news trots into the foreground, investors forget about the headlines in short order. The general market’s rebound currently supports an imminent recovery. However, I duly note that a major pullback is long overdue given AAPL’s lofty valuation.

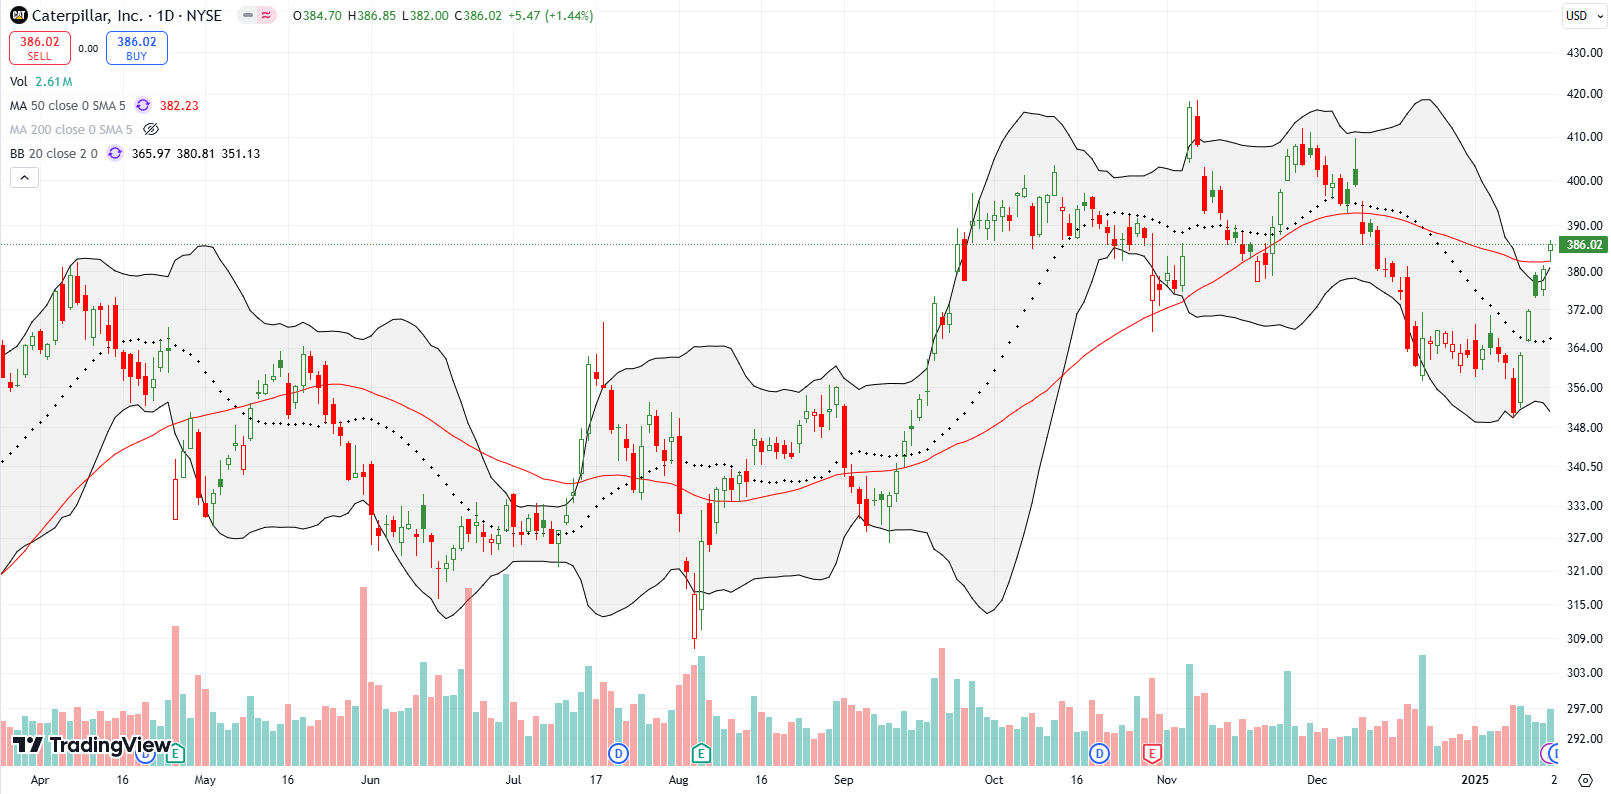
In the previous week, I held a put spread on Caterpillar, Inc (CAT) as a hedge on bullishness. Buyers wasted no time in laying waste to that position. CAT bounced sharply on Monday by 3.3% and set the tone for the week. CAT ended the week with a 50DMA breakout and even stretched above its upper Bollinger Band (BB). That stretch motivated me to return to a fresh hedge, a weekly $375/365 put spread.
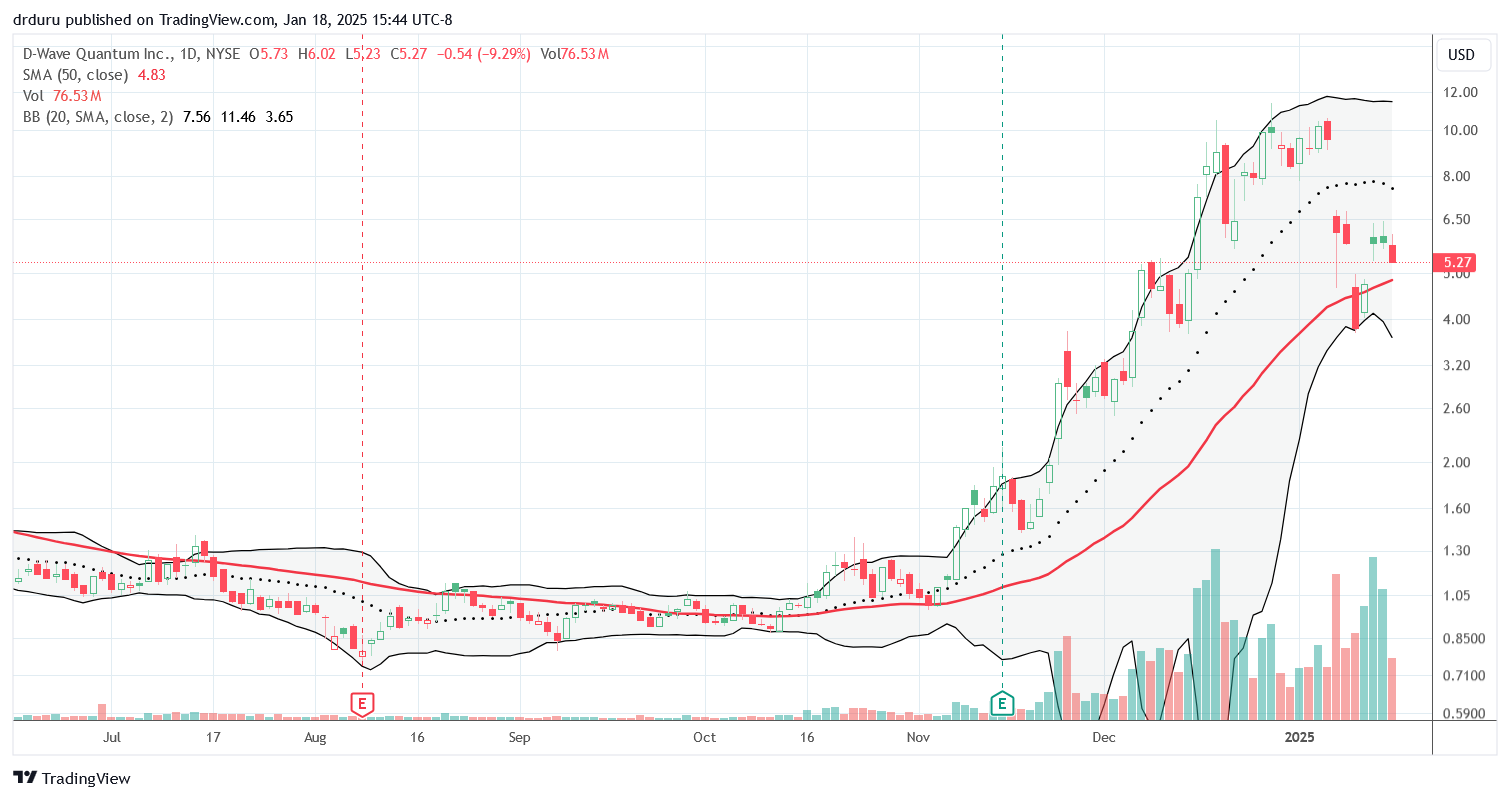
My guess that D-Wave Quantum Inc (QBTS) would not hold 50DMA support turned out to be correct for a whole day. The same guy who started the quantum sell-off gave quantum speculation fresh life, thus saving QBTS just in time from a confirmed bearish breakdown. NVIDIA Corporation (NVDA) surprisingly announced quantum day for March 20th. Not only will CEO Jensen Huang speak but also a whole host of quantum companies will get an opportunity to contribute to the quantum excitement, including QBTS! Here is the list of chosen ones:
- Alice & Bob
- Atom Computing
- D-Wave
- Infleqtion
- IonQ (IONQ)
- Pasqal
- PsiQuantum
- Quantinuum
- Quantum Circuits
- QuEra Computing
- Rigetti (RGTI)
- SEEQC
QBTS rebounded 23.5% on the news and closed above its 50DMA. After another 22.4% gain, QBTS stopped cold. Still, with NVDA providing a tailwind to the space, I am very tempted to get back into the game speculating on these stocks. For now, the technicals look quite toppy across the board with questionable support from the last pullback.
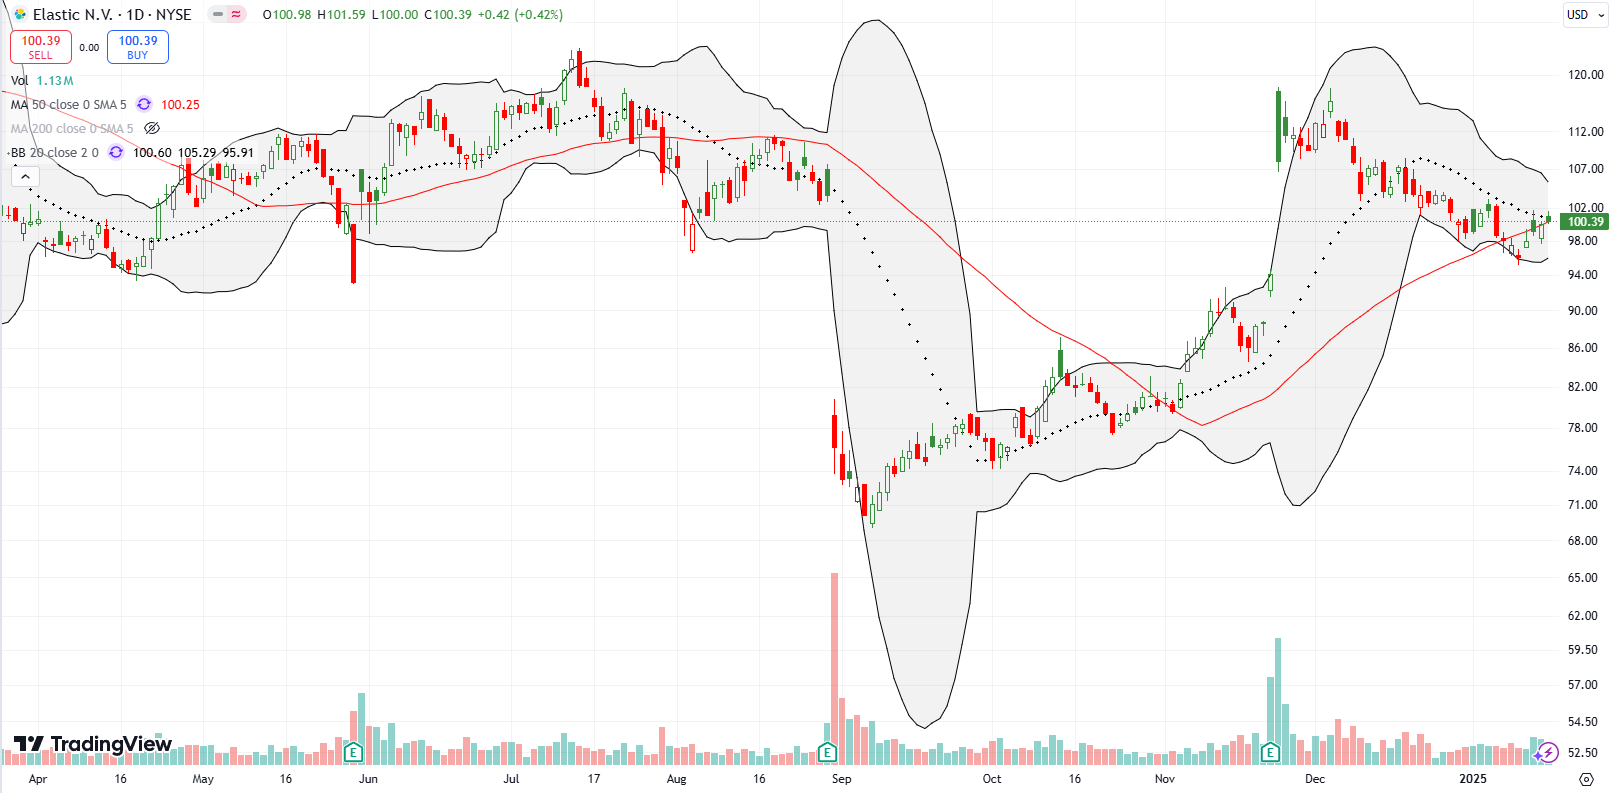
Elastic N.V. (ESTC) failed to follow through on its post-earnings surge. After a brief push, ESTC has dribbled lower for six weeks. Now buyers must stand their ground at the 50DMA alongside downtrending resistance with the 20DMA. A higher close from here gets me back in.
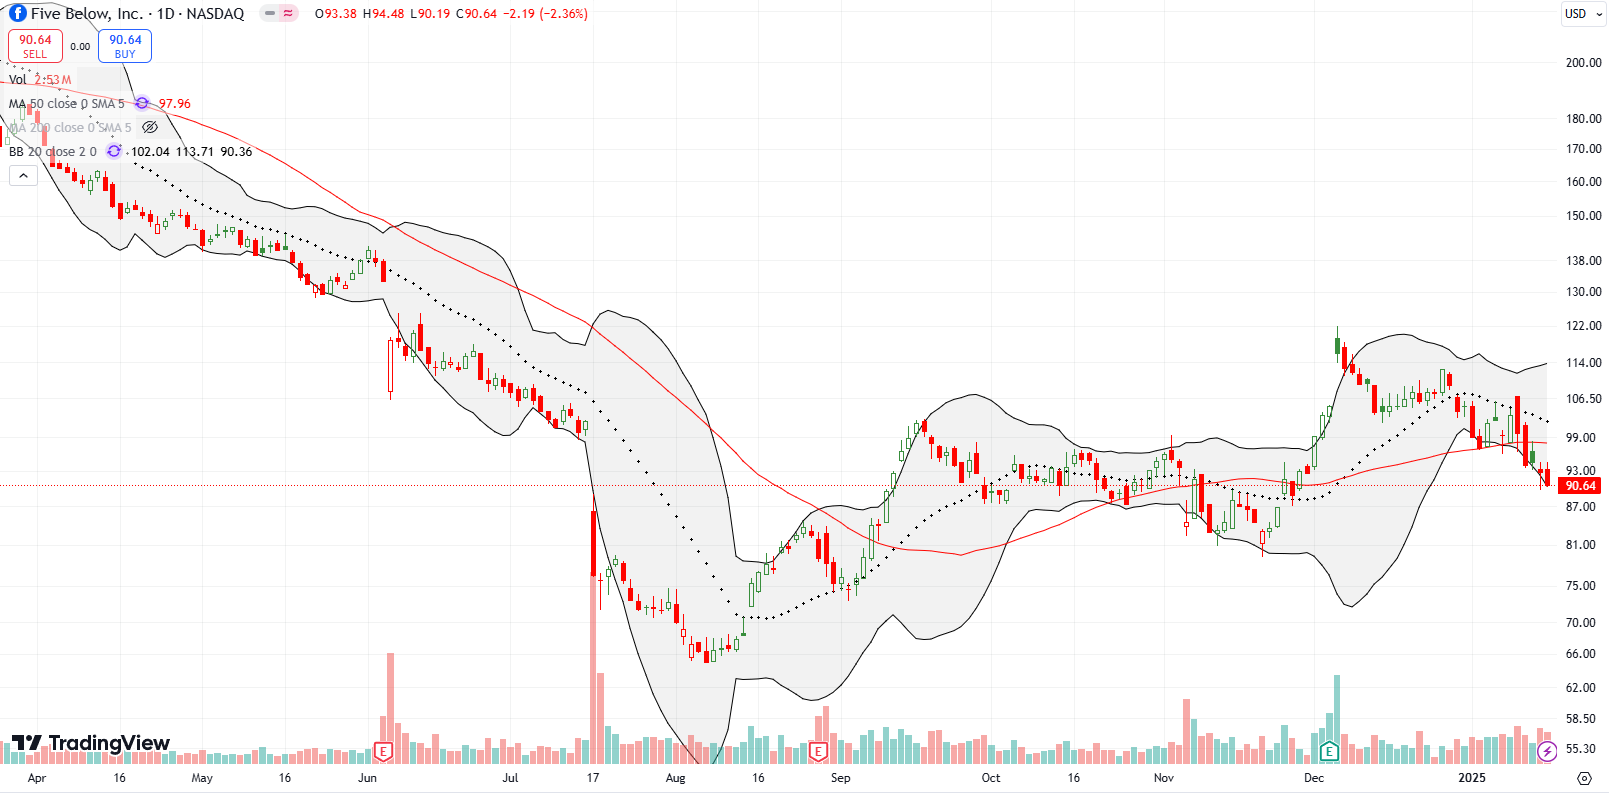
I was bullish on Five Below Inc (FIVE) going into and coming out of earnings. Unfortunately, FIVE never followed through on its pre-earnings momentum. The stock is now suffering from a confirmed 50DMA breakdown and is back in bearish position.
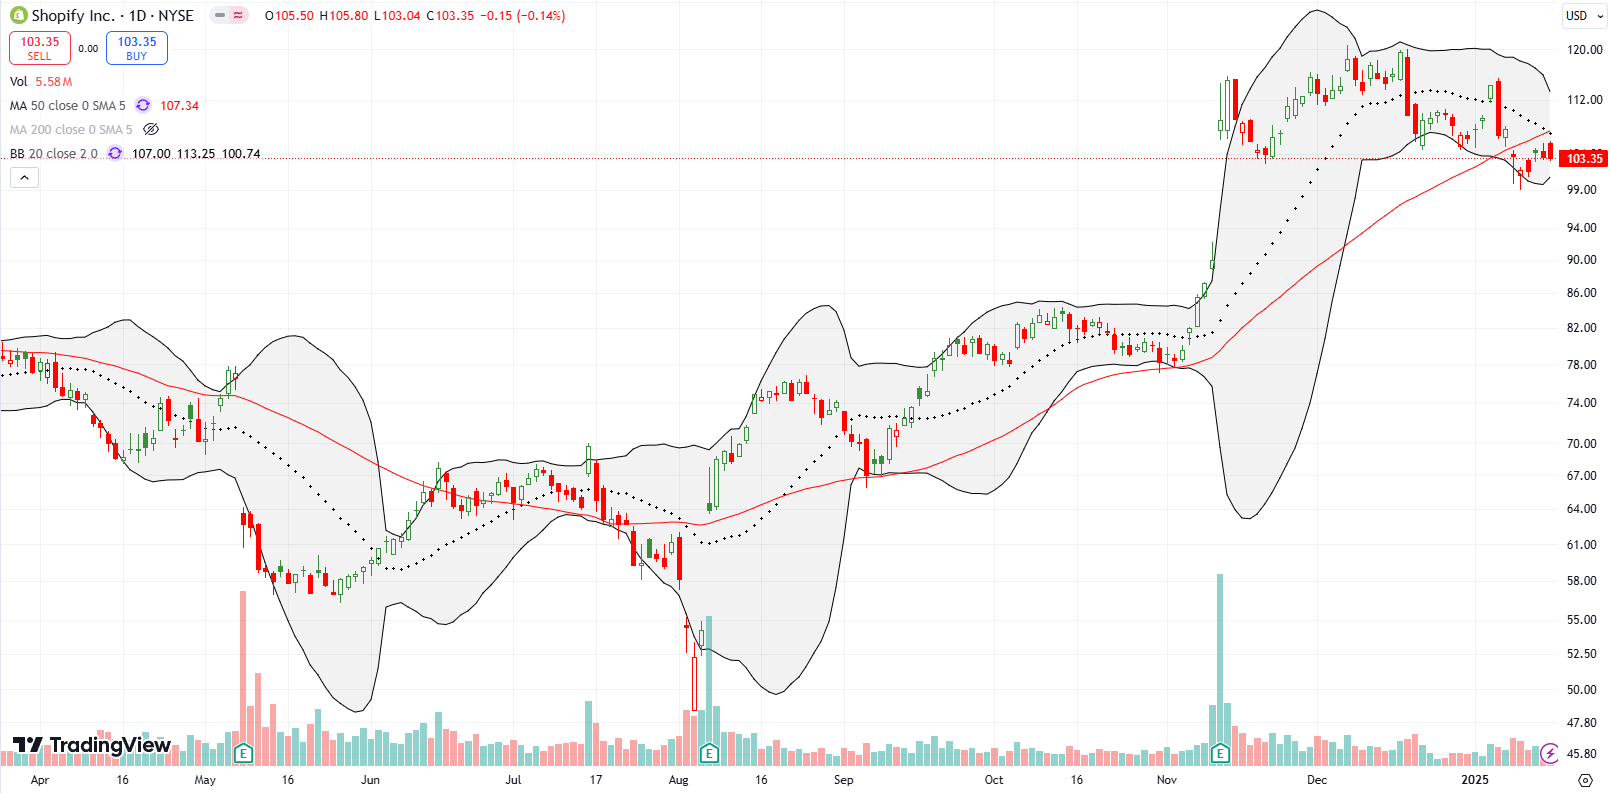
Shopify, Inc (SHOP) is also in bearish position despite significant momentum from its last earnings report. SHOP spent the week feebly trying to recover from a confirmed 50DMA breakdown. Now the stock is fighting converged resistance from its 50 and 20DMAs.
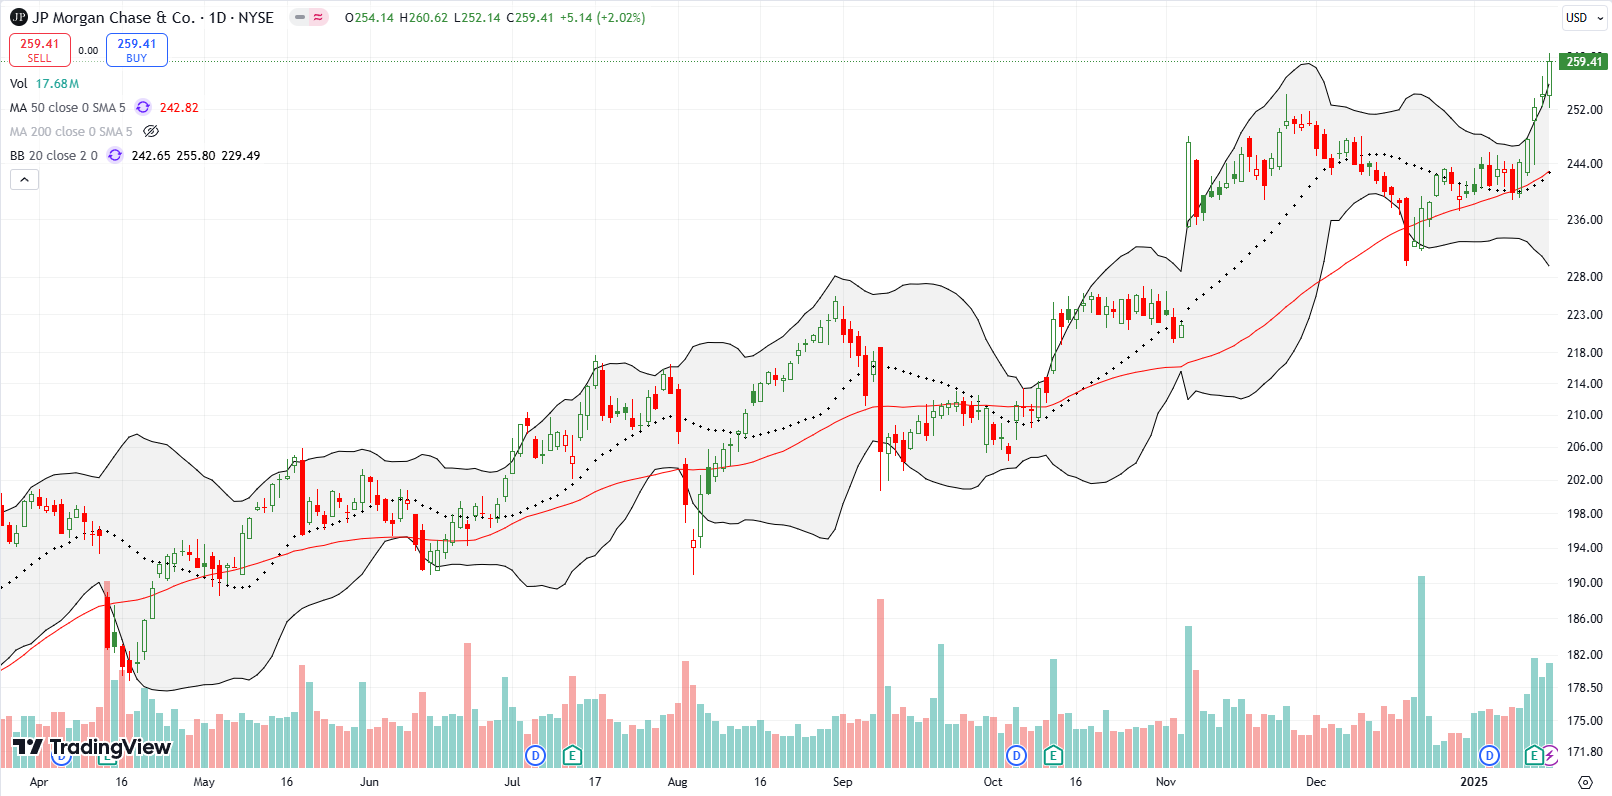
Financials tried to deliver an exclamation mark on the bottom created by the market reaching “oversold enough”. JP Morgan Chase & Co (JPM) gained 2.0% post-earnings and kept rallying from that all-time high. I chased financials by buying February call options on SPDR Select Sector Fund – Financial (XLF) to play its 50DMA breakout.
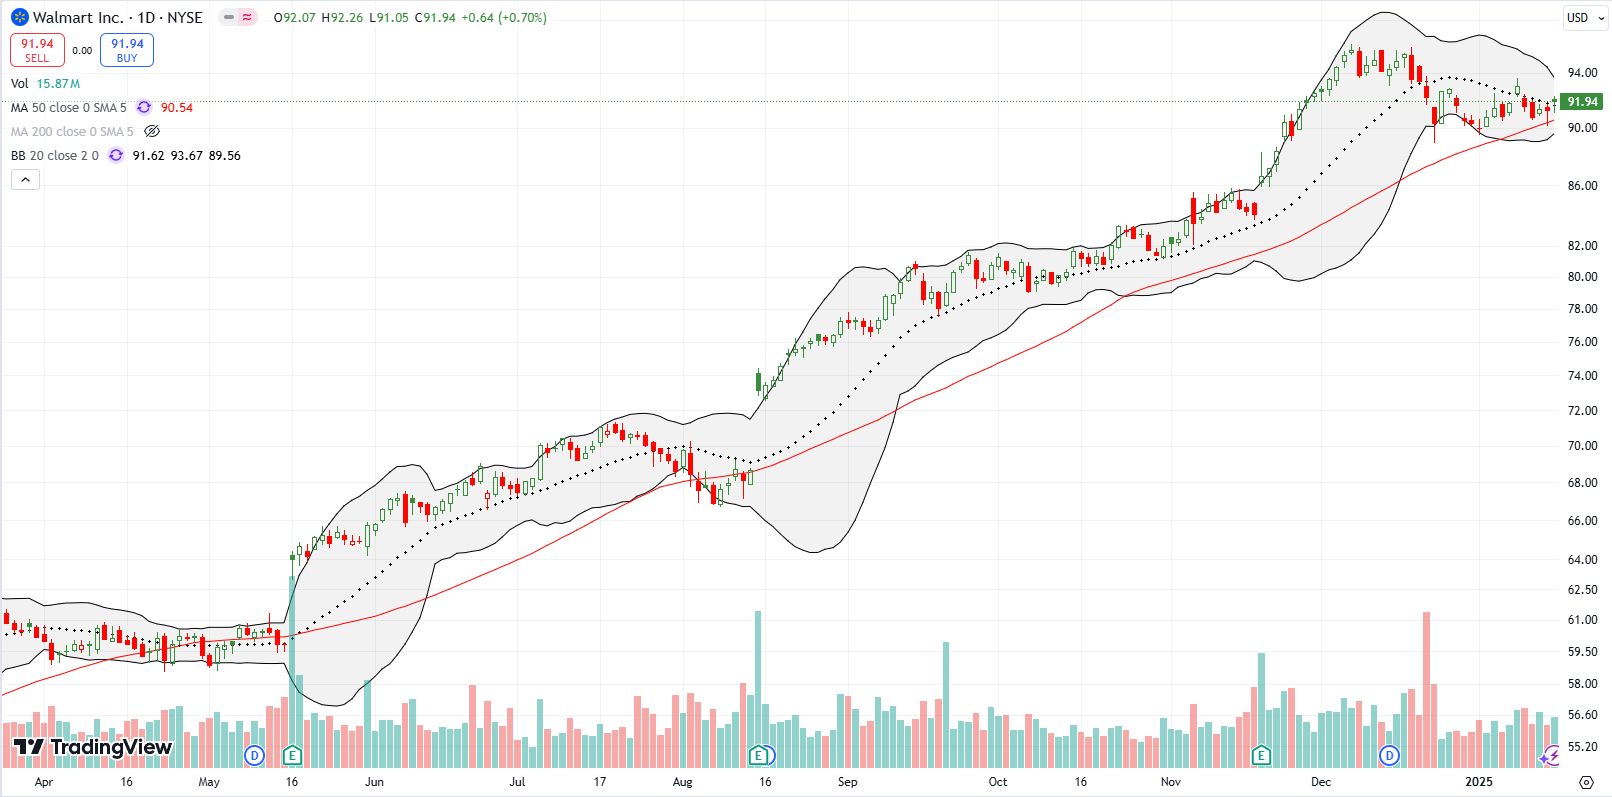
Walmart Inc (WMT) has had an impressive and beautiful uptrend for over a year. From a technical standpoint, I have little excuse for failing to lock WMT into the longer-term portfolio. Now, WMT has sagged enough since the December all-time high to slide along a short-term downtrend defined by the 20DMA. On Thursday, WMT tentatively tested 50DMA support. I am assuming after this test, WMT will resume its rise to $100. I just need to see a higher close before I participate in THAT run…
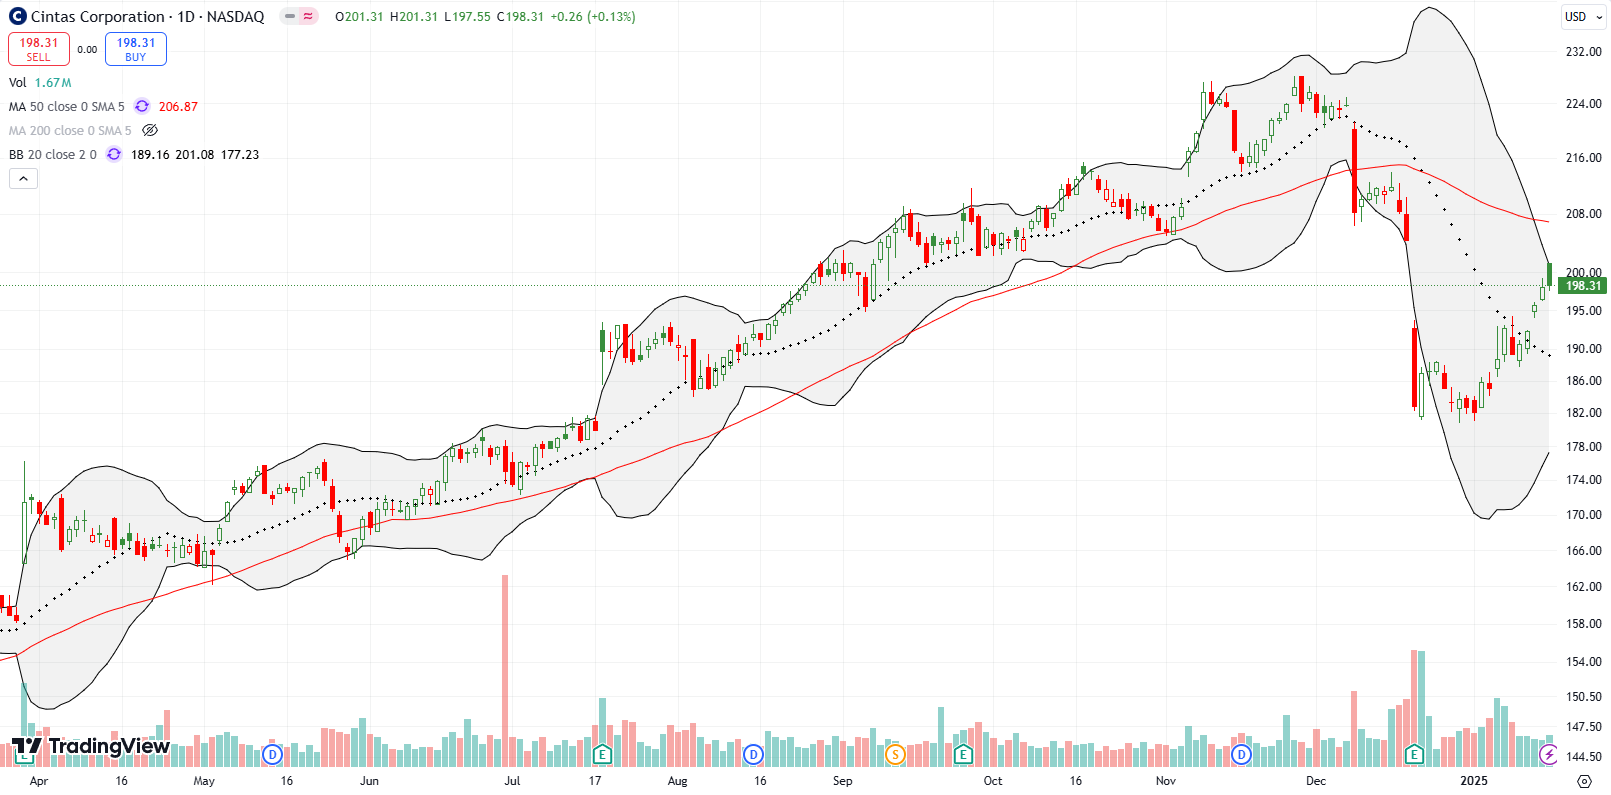
I assumed Cintas Corporation (CNTAS) would continue its post-earnings malaise with further selling. Instead, after a bit of cooling, CTAS has managed to rally almost all month. The provider of workplace outfits looks set to finish reversing its post-earnings loss with a test of overhead 50DMA resistance.
Be careful out there!
Footnotes
Subscribe for free to get email notifications of future posts!
“Above the 50” (AT50) uses the percentage of stocks trading above their respective 50-day moving averages (DMAs) to measure breadth in the stock market. Breadth defines the distribution of participation in a rally or sell-off. As a result, AT50 identifies extremes in market sentiment that are likely to reverse. Above the 50 is my alternative name for “MMFI” which is a symbol TradingView.com and other chart vendors use for this breadth indicator. Learn more about AT50 on my Market Breadth Resource Page. AT200, or MMTH, measures the percentage of stocks trading above their respective 200DMAs.
Active AT50 (MMFI) periods: Day #283 over 20%, Day #4 over 30% (overperiod), Day #16 under 40%, Day #16 under 50%, Day #20 under 60%, Day #121 under 70%
Source for charts unless otherwise noted: TradingView.com
Full disclosure: long SPY put spread, long IWM, long CAT put, long XLF calls
FOLLOW Dr. Duru’s commentary on financial markets via StockTwits, BlueSky, and even Instagram!
*Charting notes: Stock prices are not adjusted for dividends. Candlestick charts use hollow bodies: open candles indicate a close higher than the open, filled candles indicate an open higher than the close.

