Stock Market Commentary
Fades were on display, especially on Thursday, as the stock market showed signs of exhaustion. Bad news in and for the semiconductor industry seemed to motivate sellers. For example, earnings for Microsoft (MSFT) and Meta Platforms (META) seemed to release some steam on hyped expectations for the AI chips both companies will need for their AI (artificial intelligence) build-outs. Selling in big caps and semiconductors was enough to press on the market across the board. Important support levels braced against key fades. The next day, the October jobs report was a wash as the mere 12,000 jobs created was severely impacted by a host of confounding factors including multiple strikes and a hurricane. The unemployment rate sat at 4.1%. The bond market got the message and sent long-term rates running higher again: the economy remains stronger than it expected.
The iShares 20+ Treasury Bond ETF (TLT) finished reversing its entire breakout from the beginning of the summer (lower prices mean higher rates).
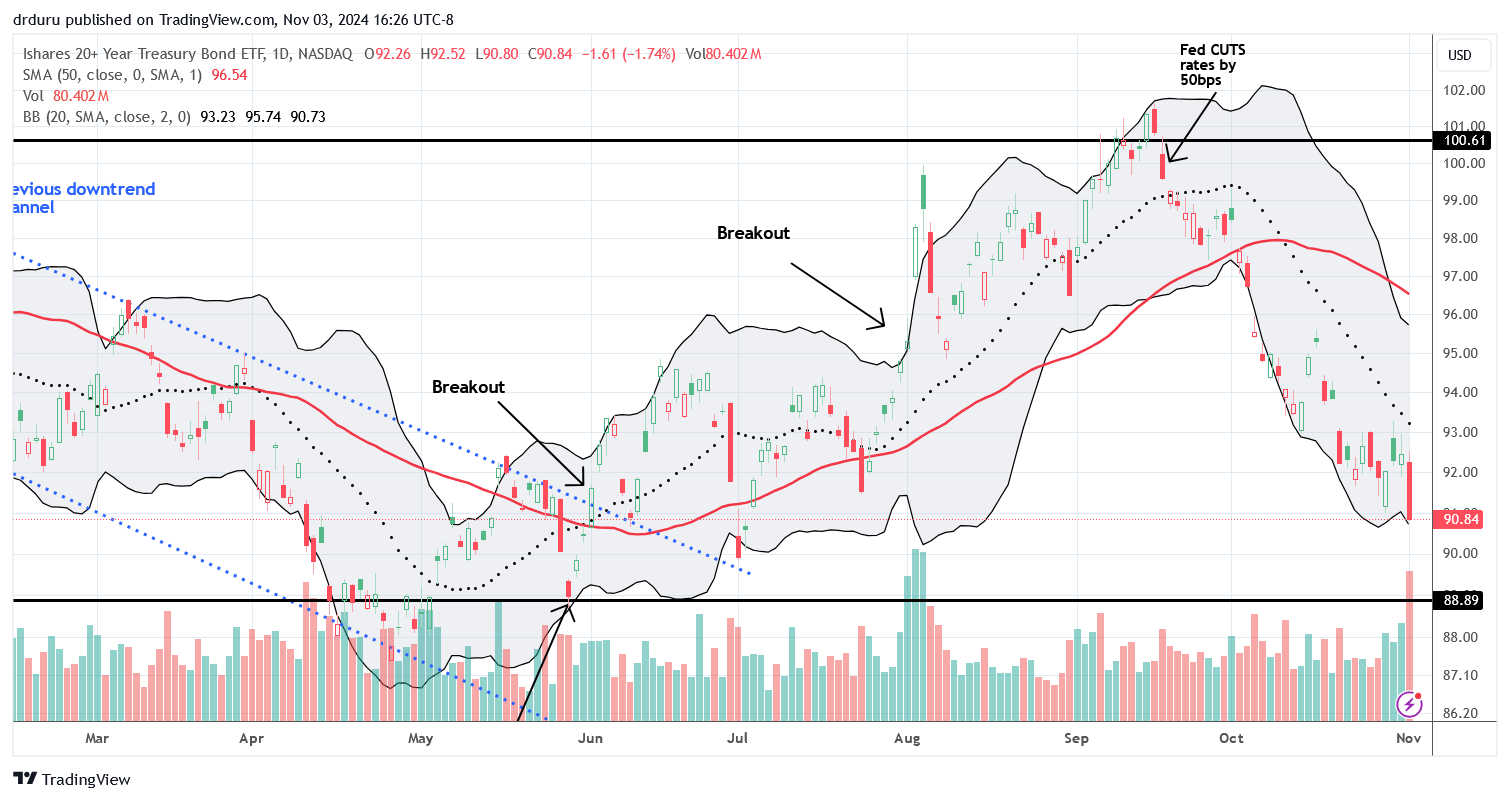
Stocks have done well to largely ignore higher rates up until now. Fades last week suggests the weight is finally wearing a bit on buyers.
The Stock Market Indices
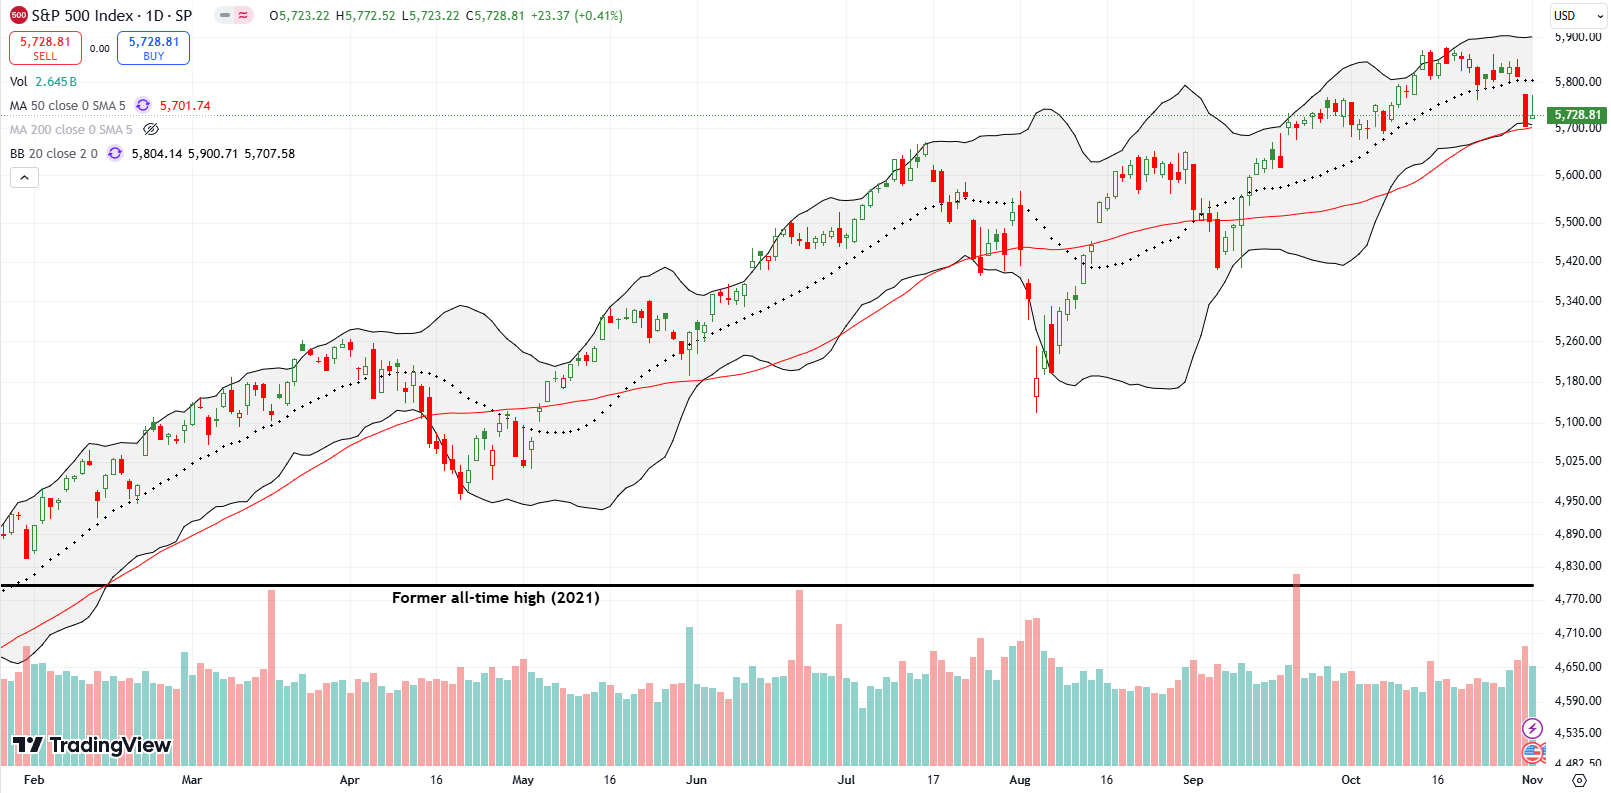
The S&P 500 (SPY) dropped 1.9% on Thursday. Given the tight range of trading that fall was enough to send the index into a test of support at its 50-day moving average (DMA). This breakdown finally validated the bearish signals from the last two weeks. So now the current bear teaser is this teetering on support. Sellers faded the index’s attempt to break away on Friday. Thus the drama going into the presidential election is wound as tight as can be expected in a persistent bull market.
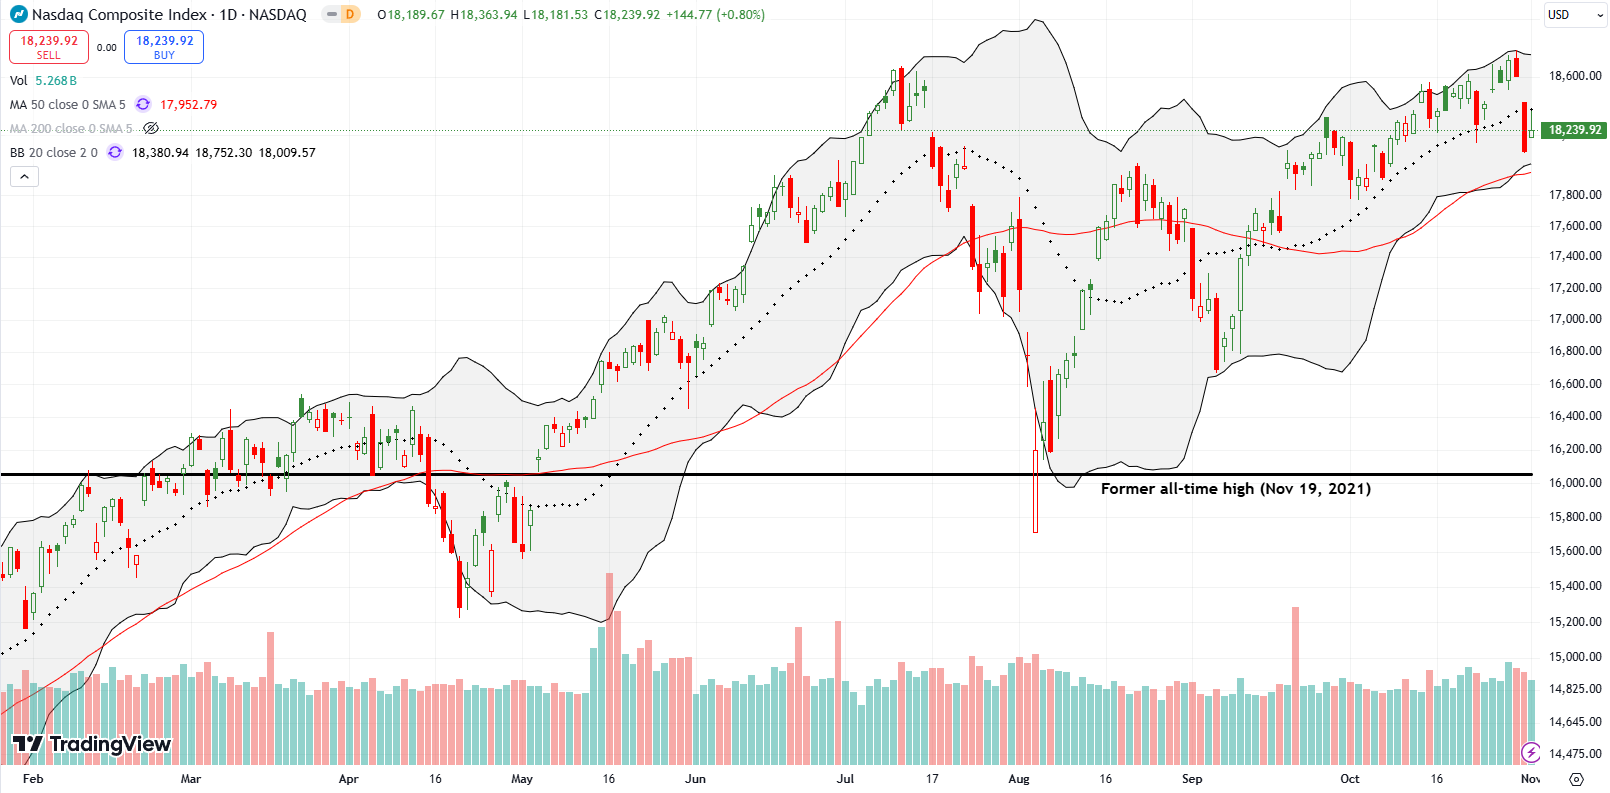
The NASDAQ fell 2.8% on Thursday but did not test 50DMA support. Friday’s rally faded from 20DMA resistance (the dotted line). Still, the NASDAQ’s drop validated a double-top which in turn adds to the technical tension going into the election.
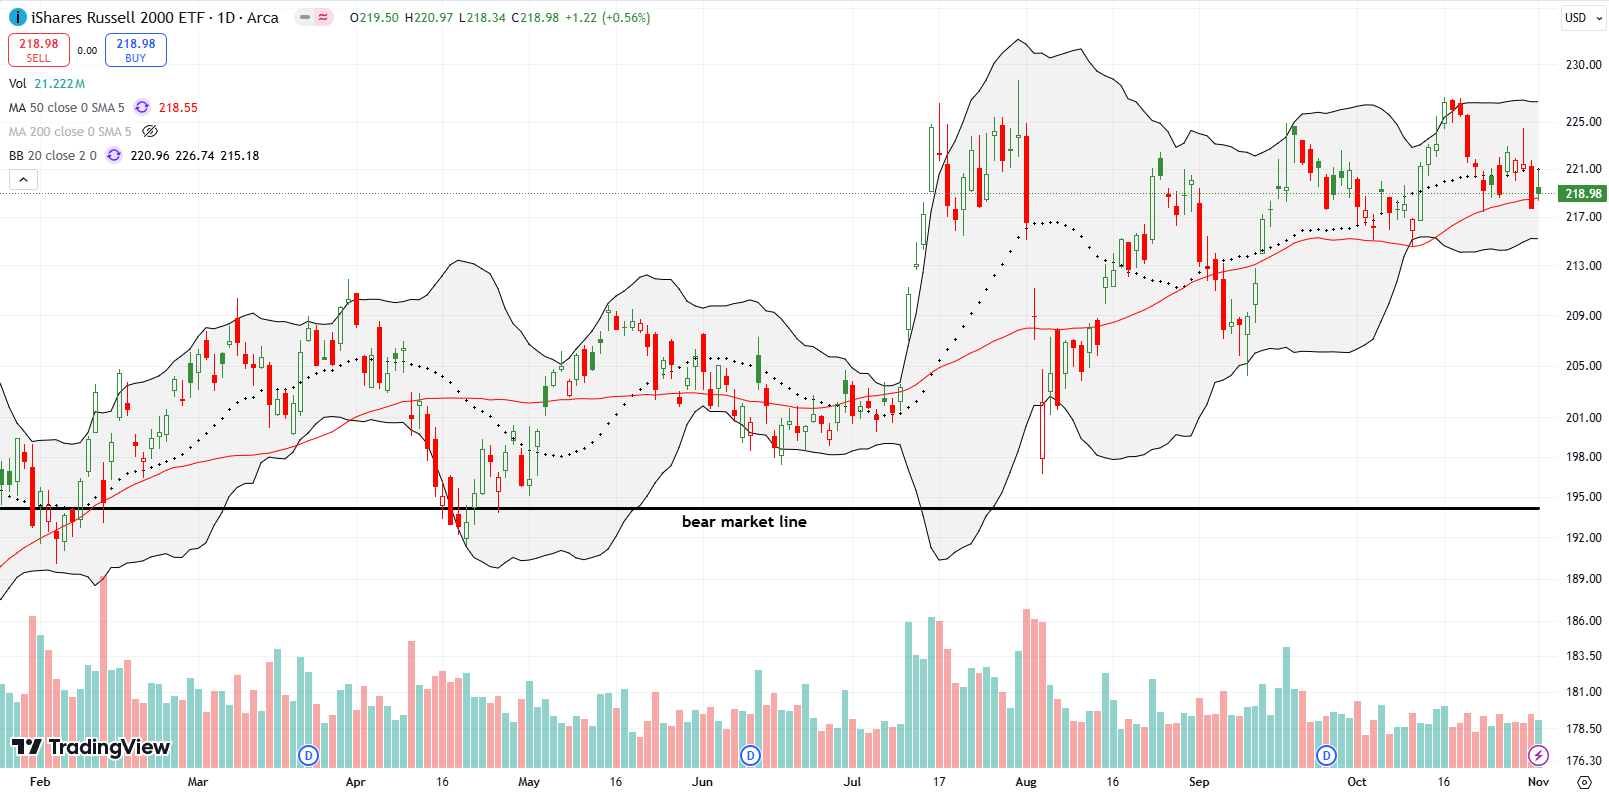
The iShares Russell 2000 ETF (IWM) fell 1.7% on Thursday. The ETF of small caps cracked 50DMA support but recovered ever so slightly the next day. I am impressed IWM still maintains an uptrending 50DMA despite the constant and wide churn since the July breakout.
The Short-Term Trading Call With Fades
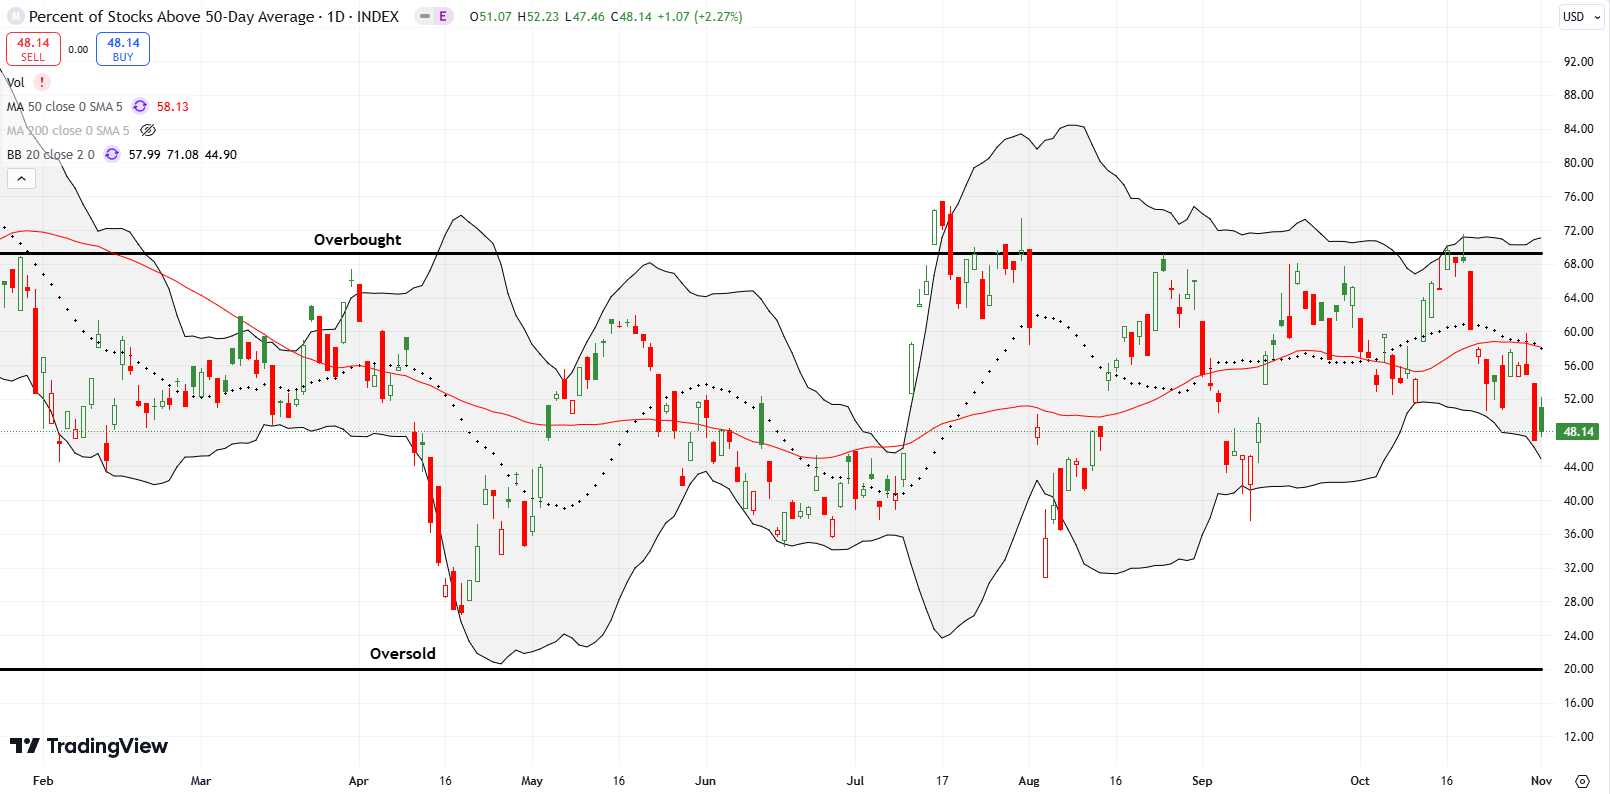
- AT50 (MMFI) = 48.1% of stocks are trading above their respective 50-day moving averages
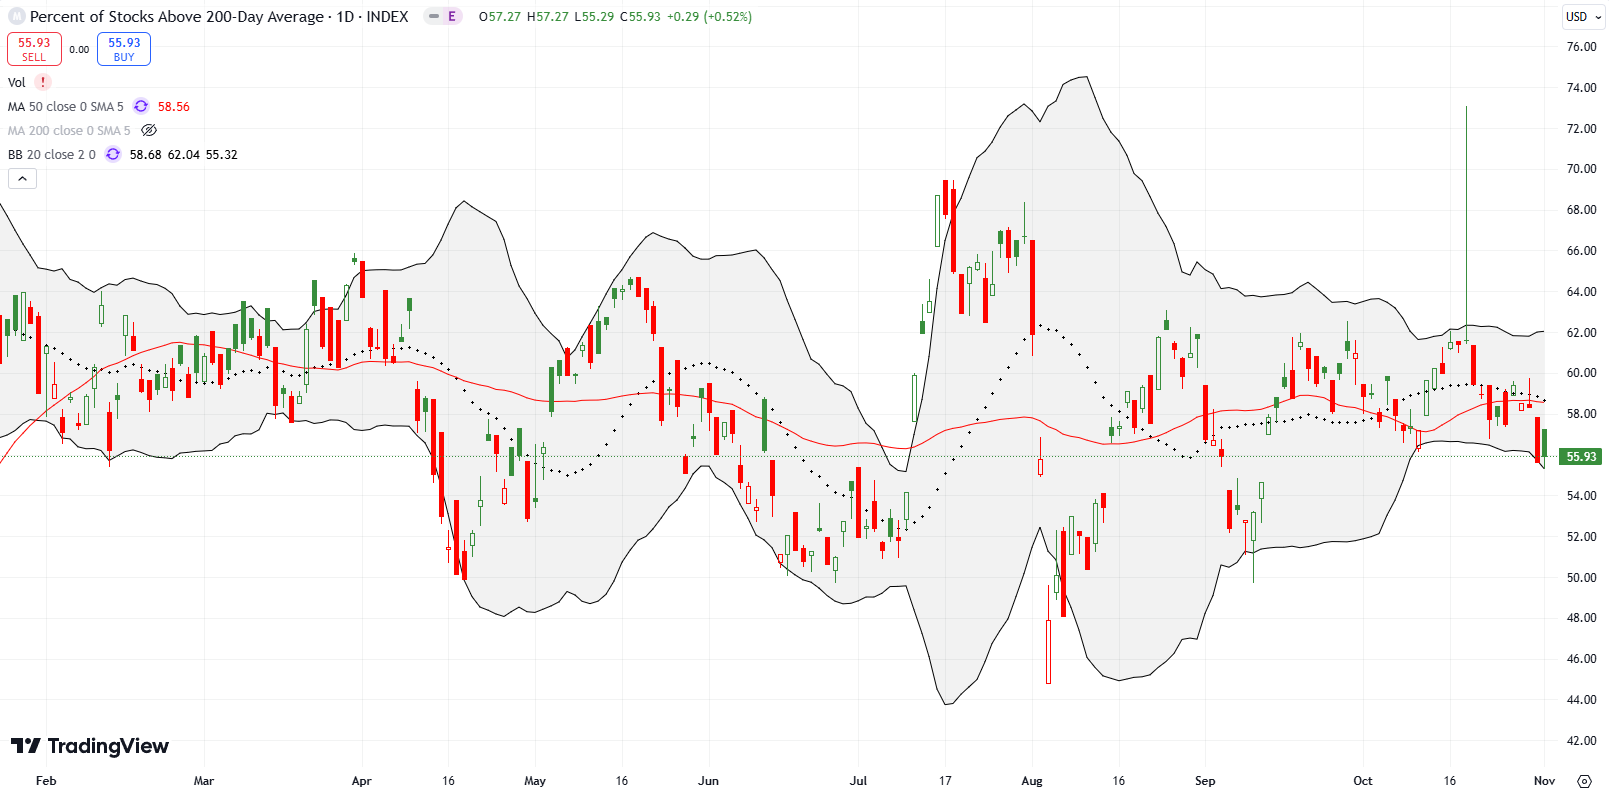
- AT200 (MMTH) = 55.9% of stocks are trading above their respective 200-day moving averages
- Short-term Trading Call: cautiously bearish
AT50 (MMFI), the percentage of stocks trading above their respective 50DMAs, closed below 50% for the first time in almost 2 months. The drop validated my bearish short-term trading call, but the stock market still does not “feel” bearish. Support holds at 50DMAs for all three of the major indices I track here. The bearish fades are easier to see in specific individual stocks which showed weakness over the course of the week. These stocks, and others, present the clearest short opportunities I have seen in a while, even during previous bearish short-term trading calls.
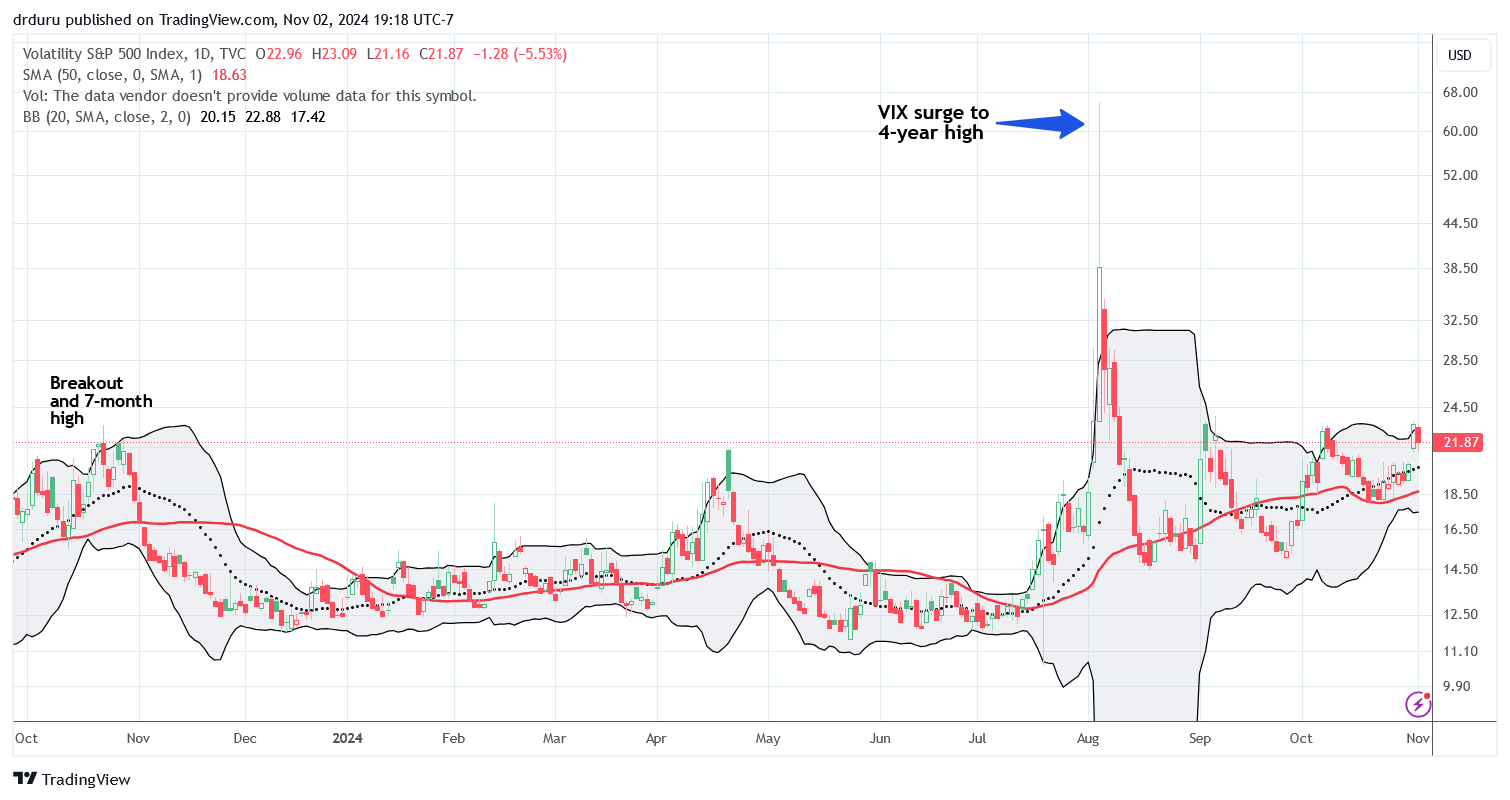
The election stands out as an obvious caveat to any market assessments, technical or fundamental. The volatility index (VIX) looks like it is getting ready for something big…or it is on the edge of its next major fade and collapse. The Federal Reserve stands ready to respond with its next announcement on monetary policy on Thursday.
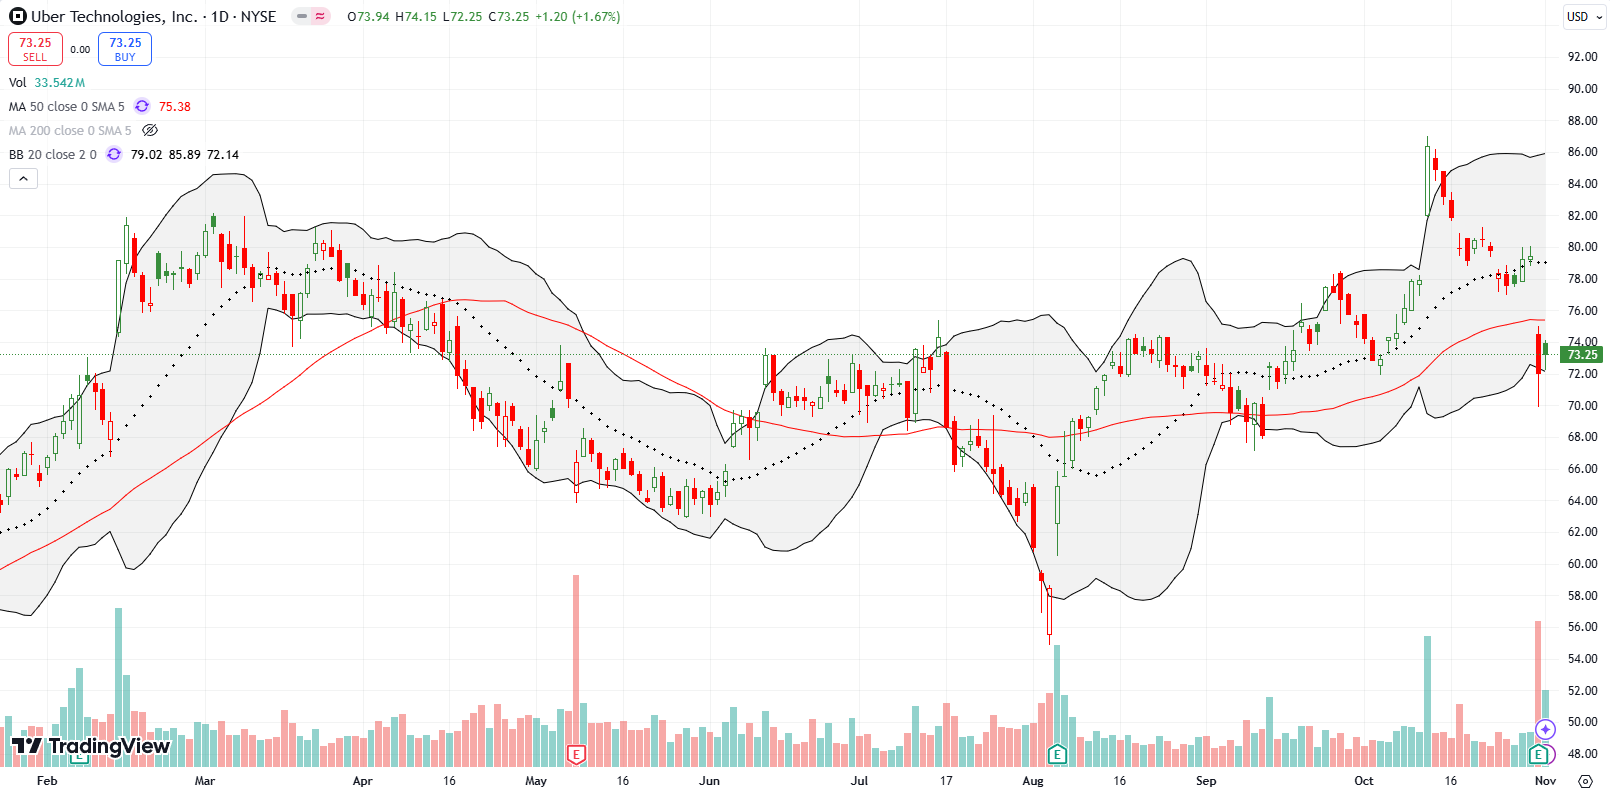
Uber Technologies, Inc (UBER) suffered a classic blow-off top. Sellers stepped in the day after the stock surged 10.8% in sympathy with Tesla’s robotaxi dud. The selling resumed with a 9% post-earnings 50DMA breakdown. UBER’s fade probably created a lasting top. I bought put options to fade Friday’s small rebound. For now, the stock is clinging to support created by the October low.
I had a different reaction to the fade in Robinhood Markets, Inc (HOOD). After a 16.7% post-earnings plunge, buyers stepped in to tentatively defend support at its 50DMA. This same point nearly aligns with the former high in July and marks a complete reversal of the October breakout. I bought shares and plan to sit on them. HOOD should be one of several beneficiaries in the coming year or so as cryptocurrencies take on greater prominence in coming years, especially as fades against ballooning government deficits around the globe. Moreover, HOOD continues to rollout out fintech innovations that keep the platform in the center of investing and trading conversations among the younger generations. If you want to open an account, please use my referral code!
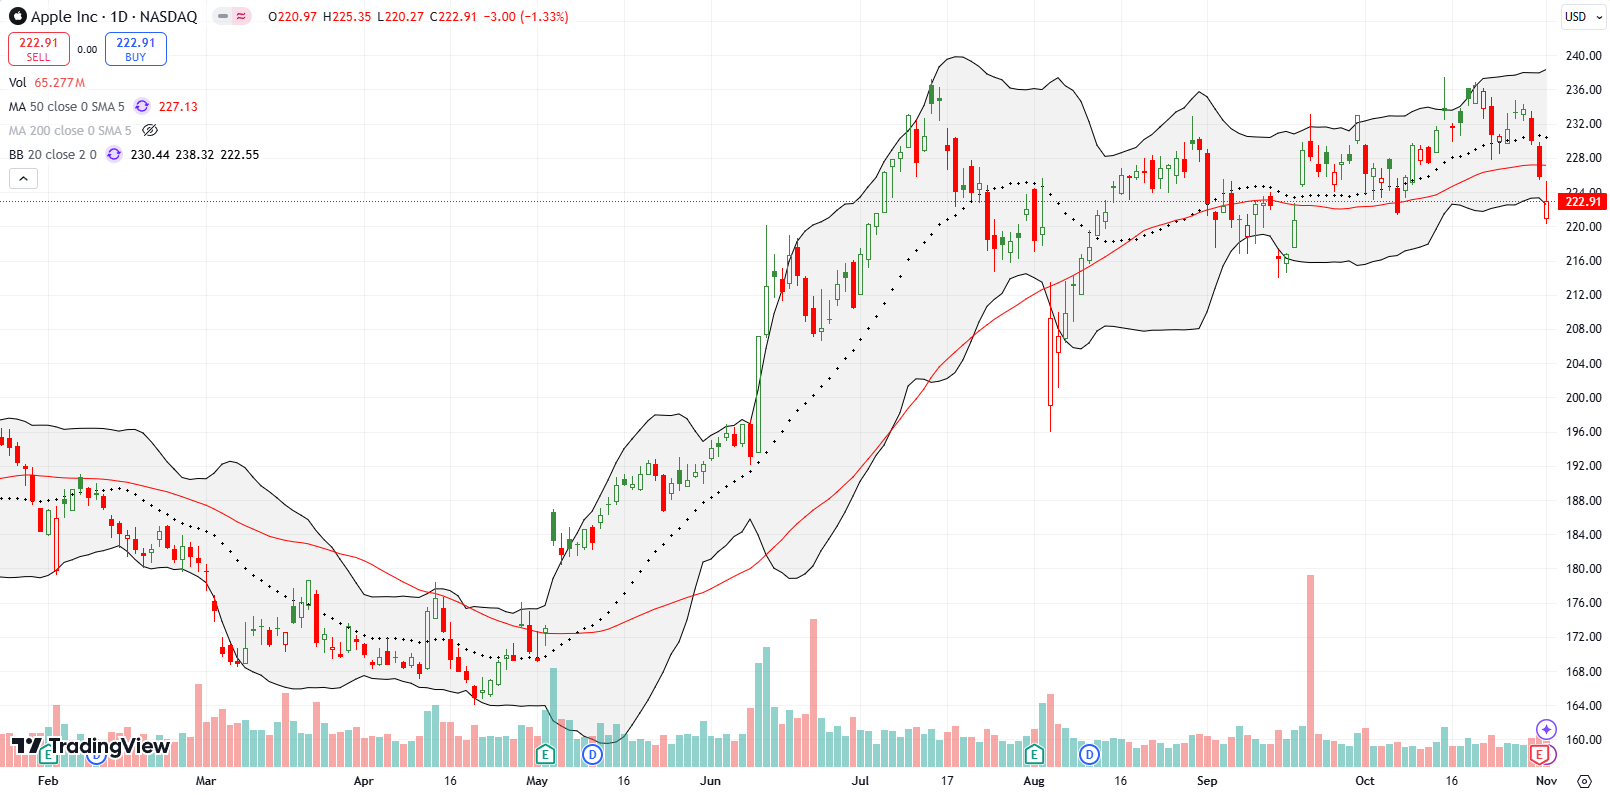
Apple (AAPL) suffered a post-earnings fade that confirmed a 50DMA breakdown. While the loss was small, it still puts my Apple Trade Model (ATM) on hold. AAPL also looks toppy given the multitude of times it has tested and failed at resistance from the all-time high set in July.
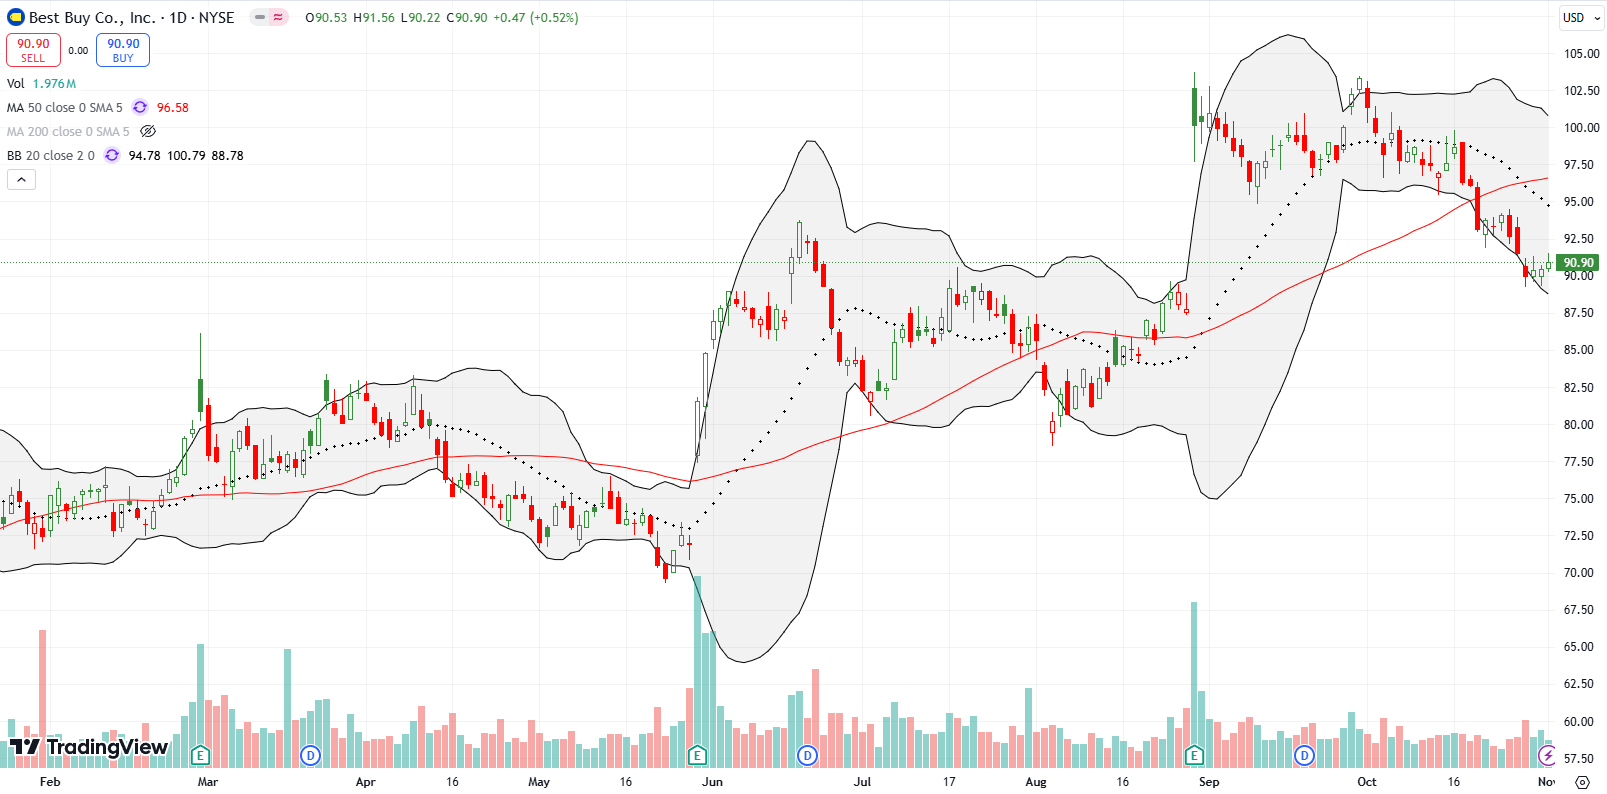
After failing to follow-through on a monster post-earnings move, Best Buy Co, Inc (BBY) has suffered a near complete fade of its earnings gains. Moreover, the stock confirmed a 50DMA breakdown which in turn confirms a double-top formed by the earnings surge and the failed rebound. The stock becomes a compelling short if it closes below the post-earnings gap. BBY is still up 16.1% for the year.
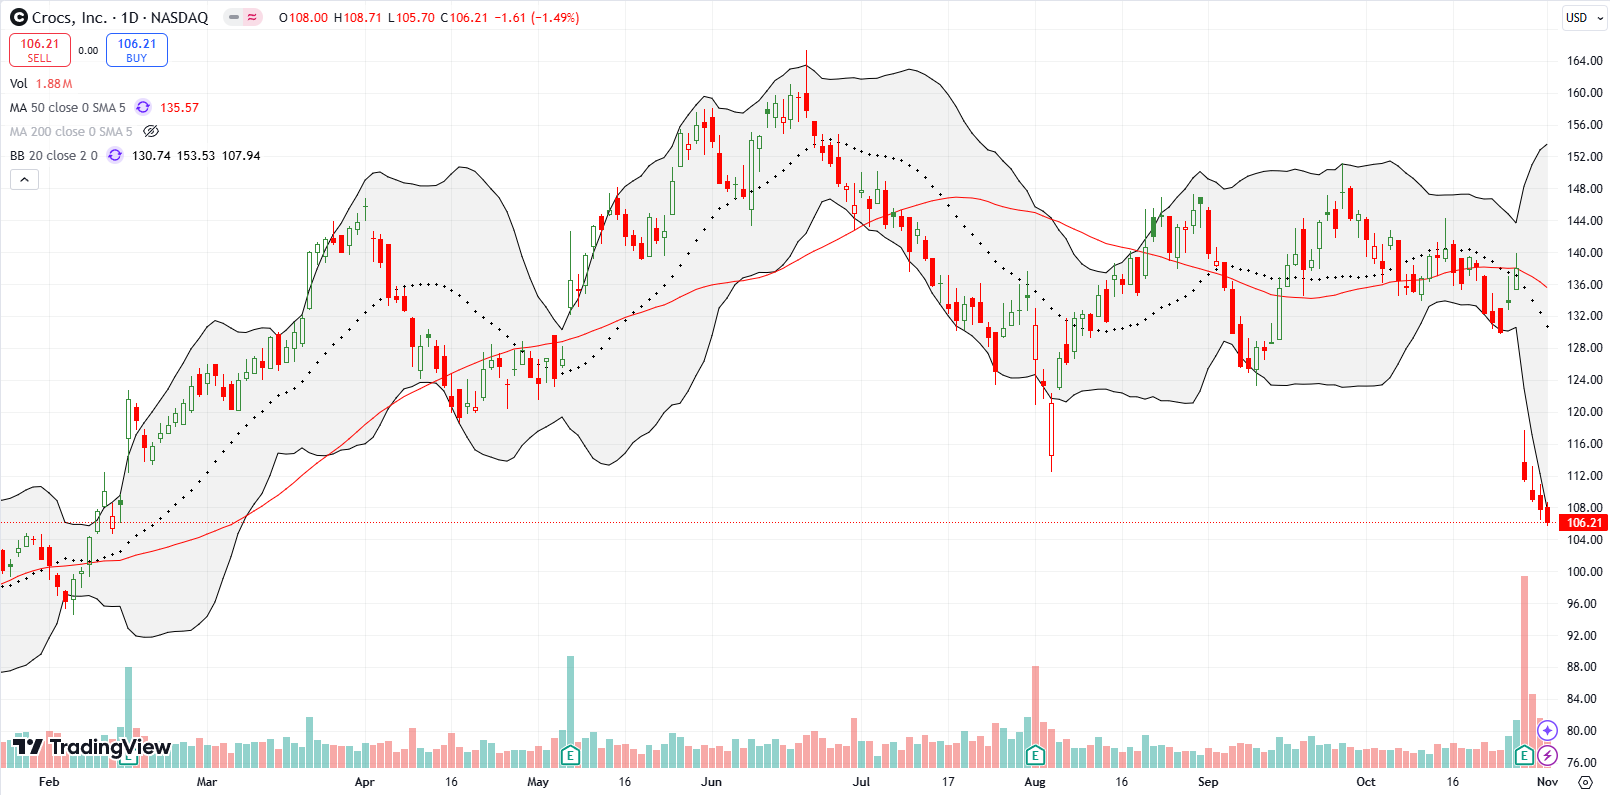
The resurgence in shoe company Crocs, Inc (CROX) looks like it is slowly grinding to a halt. In June of this year, CROX faded from a brief breakout above the 2023 high. Last week’s 19.2% post-earnings loss broke August’s low and essentially confirmed a major top in CROX. Sellers maintained the pressure and have driven CROX’s gain for the year down to 13.7%.
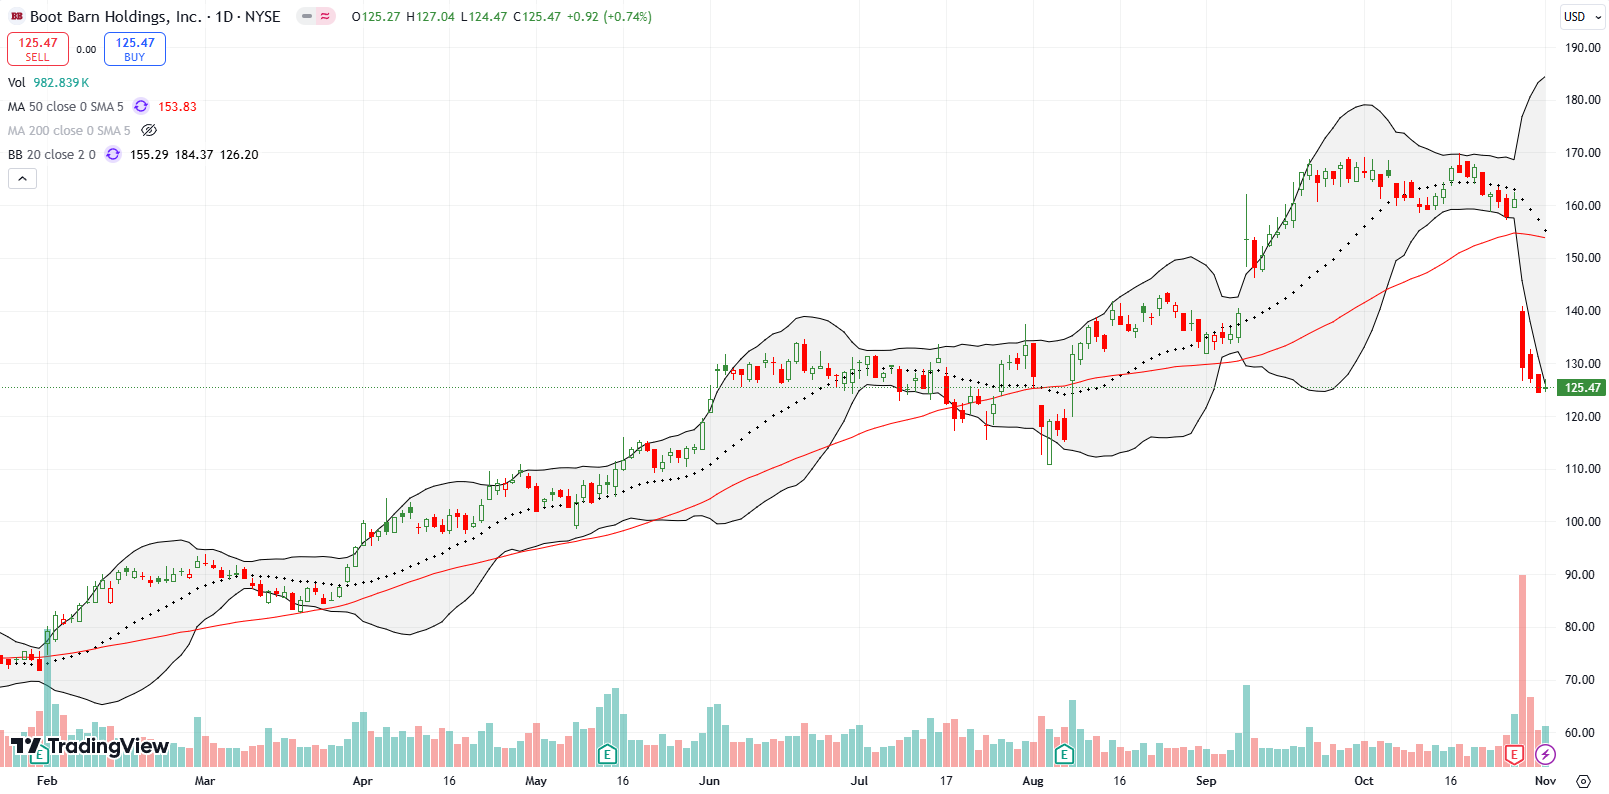
Western and work-related footwear, apparel and accessories retailer Boot Barn Holdings, Inc (BOOT) joined CROX for a plunge. BOOT suffered a 50DMA breakdown with a 19.8% post-earnings loss. Given the company slightly increased revenue guidance, I am guessing news of the CEO’s departure was a major driver of losses. Sellers maintained the pressure until Friday. Ironically, BOOT surged to an all-time high almost 2 months ago after reporting sales comp data at an investor’s conference. Those gains are all gone now. The stock is in a critical area in the middle of its summer consolidation area. If the CEO news is the main part of the panic, I expect BOOT will find a bottom in due time.
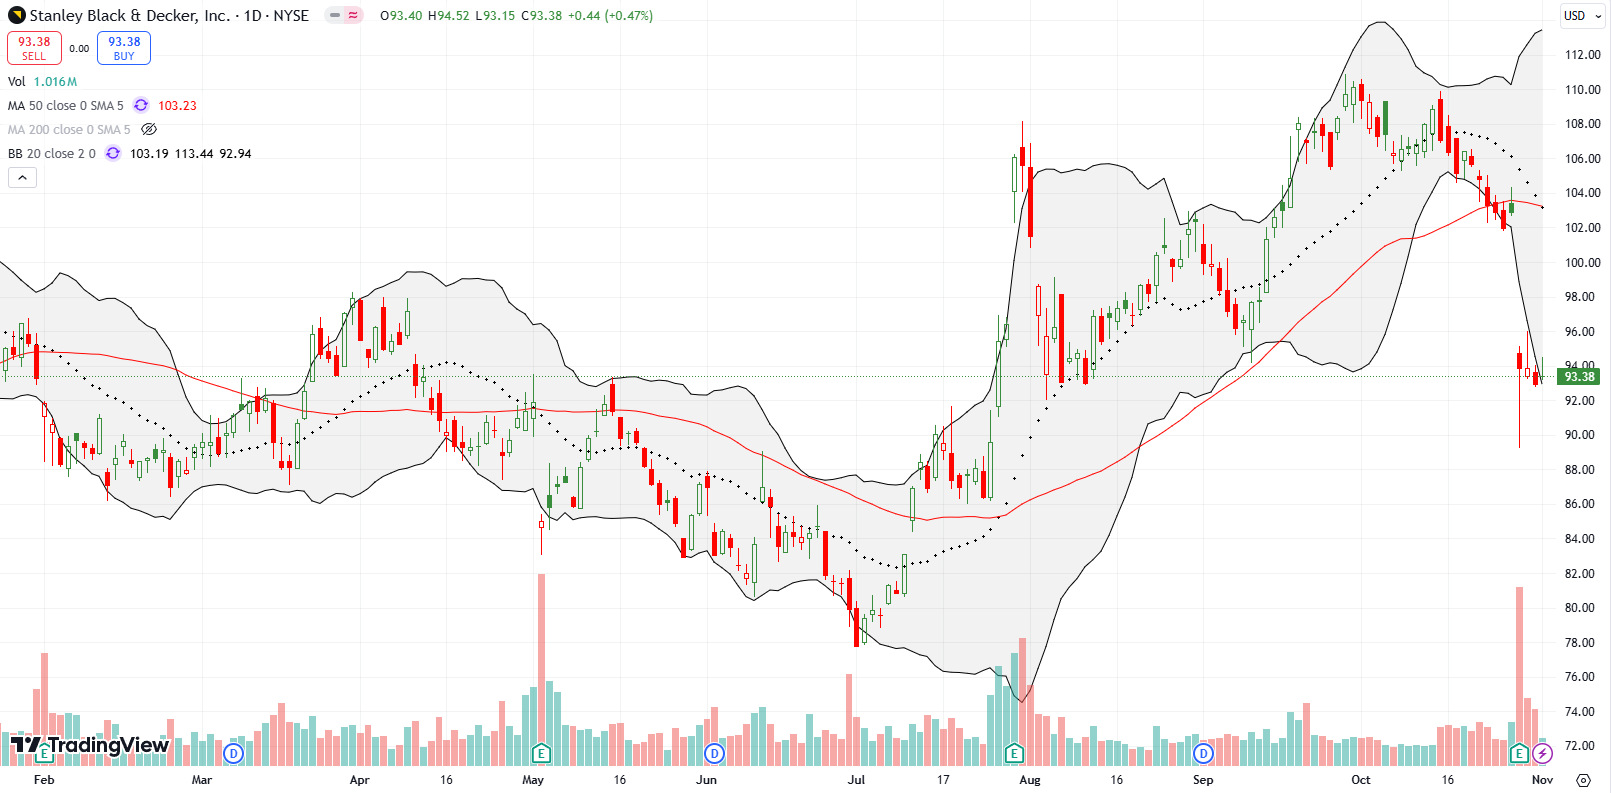
The current reckoning in home builder stocks extends to related stocks like Stanley Black & Decker, Inc (SWK). The hardware and tools maker lost 8.8% post-earnings as part of a fade from 50DMA resistance. SWK closed just below its September low and is in a bearish position.
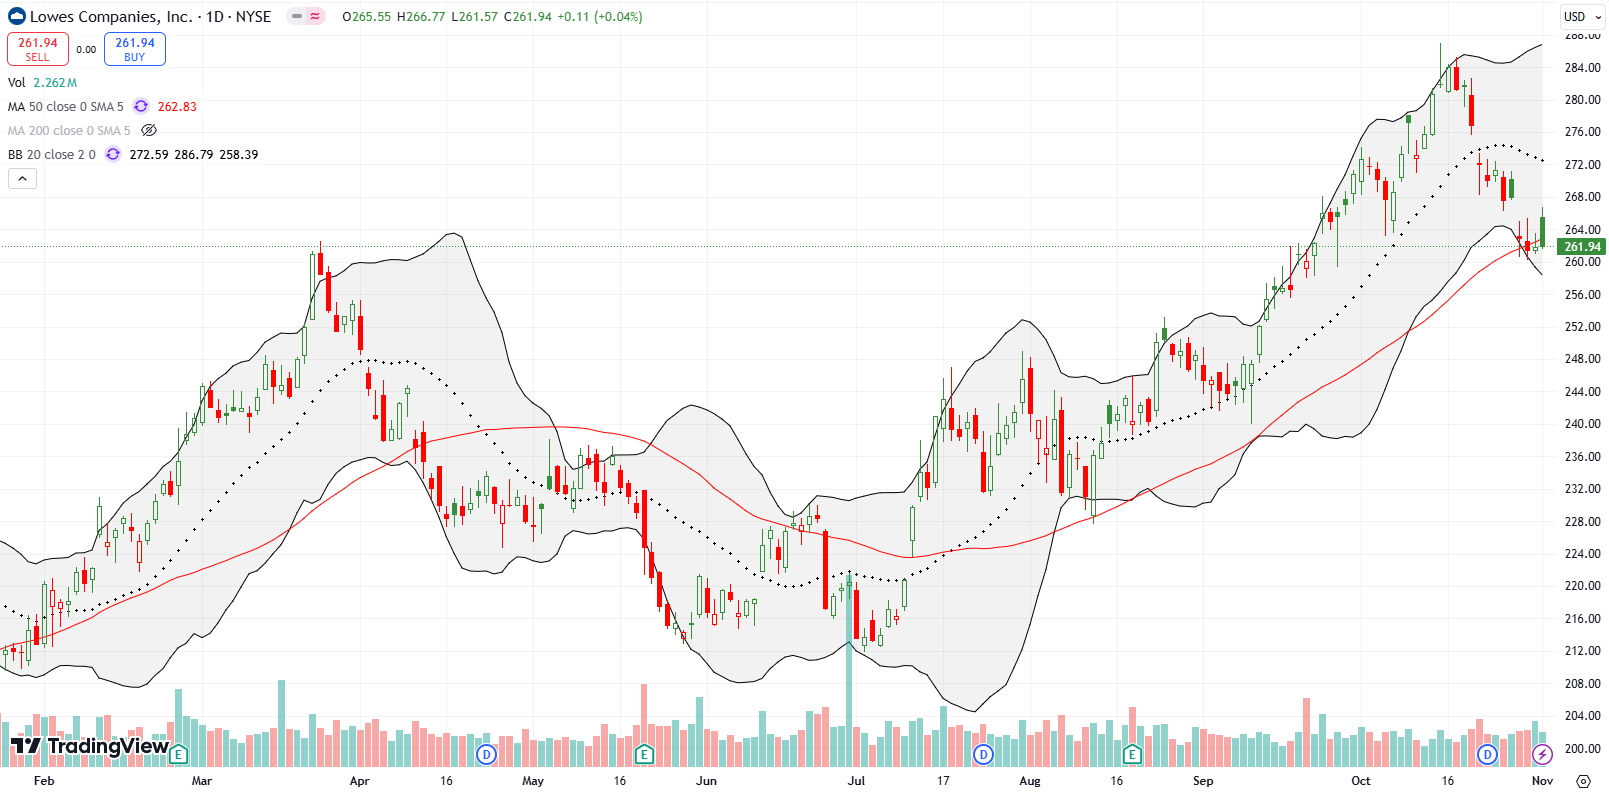
Big box hardware and do-it-yourself company Lowe’s Companies, Inc (LOW) is struggling to avoid the reckoning in housing-related stocks. LOW fell in sympathy with DR Horton’s (DHI) earnings and has been clinging to 50DMA support ever since. A lower close makes LOW a short. Home Depot (HD) is having a similar struggle.
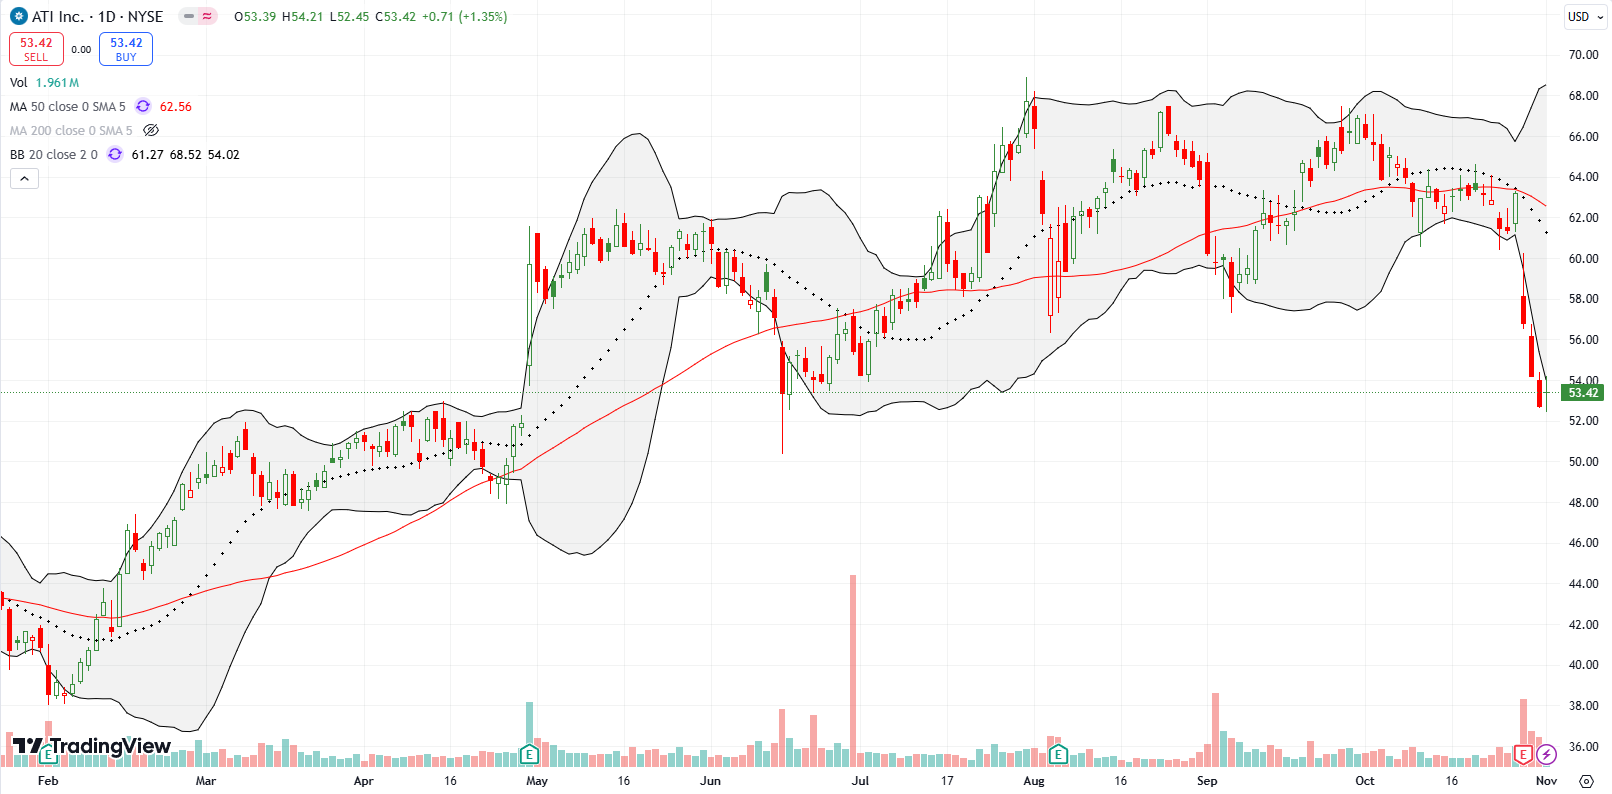
Specialty materials company ATI, Inc (ATI) confirmed 50DMA resistance with a post-earnings fade of 10.1% after cutting full year earnings guidance. Sellers maintained the pressure until Friday. ATI is now clinging to support at its June low. ATI has already confirmed a triple top stretching from July to September. Thus, unlike in previous periods of weakness, I am not interested in buying ATI without a significantly higher discount.
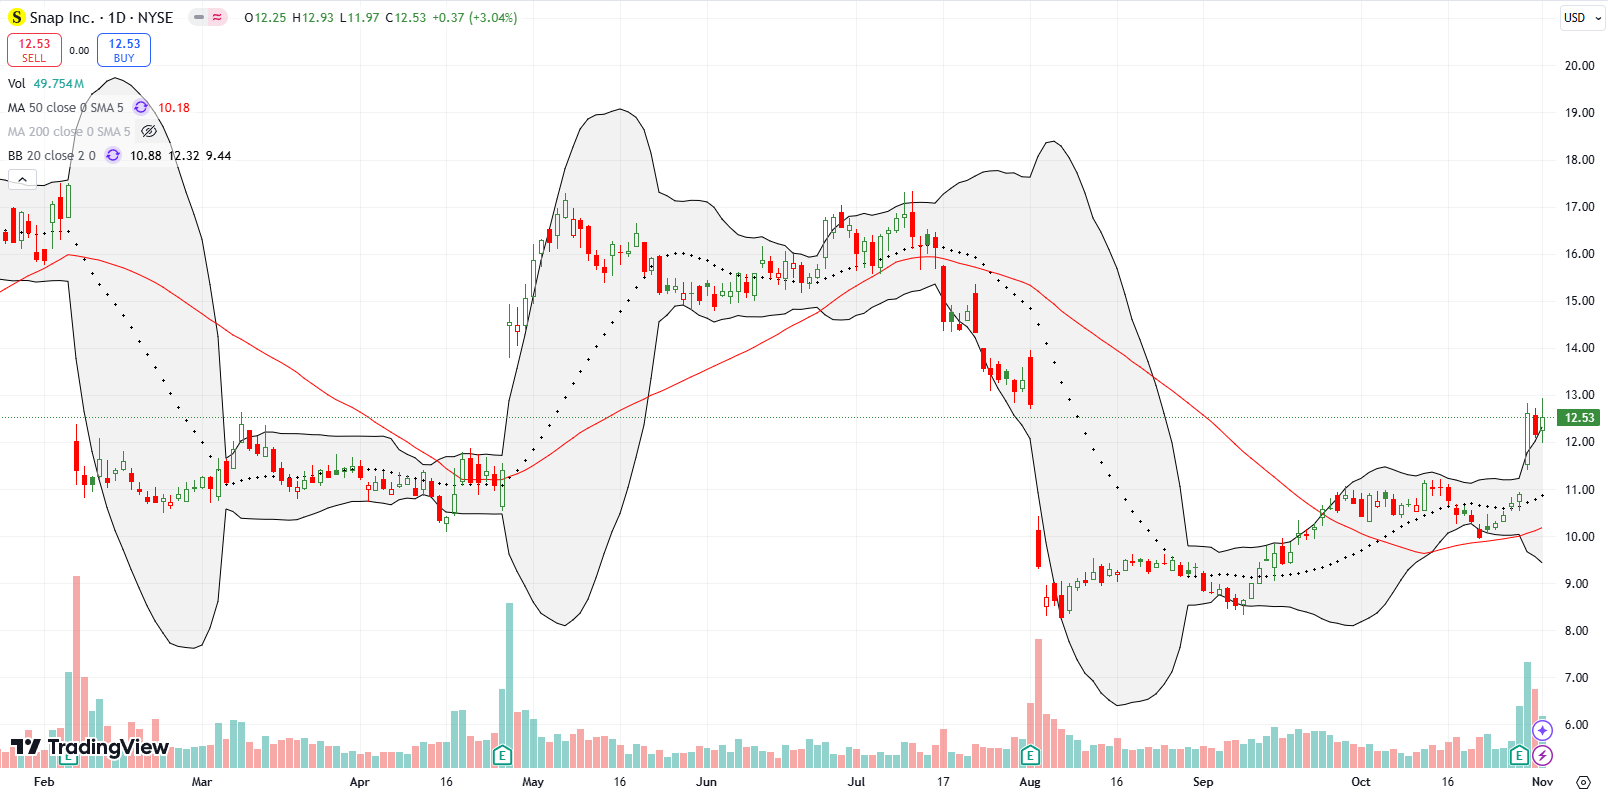
I made the case for Snap Inc (SNAP) in mid-September. The trade is already working out well: I was quite relieved to get a 15% post-earnings surge. Now the stock needs some follow-through. The stock could very well stall out for a while as it struggles to surpass the big gap down from August earnings.
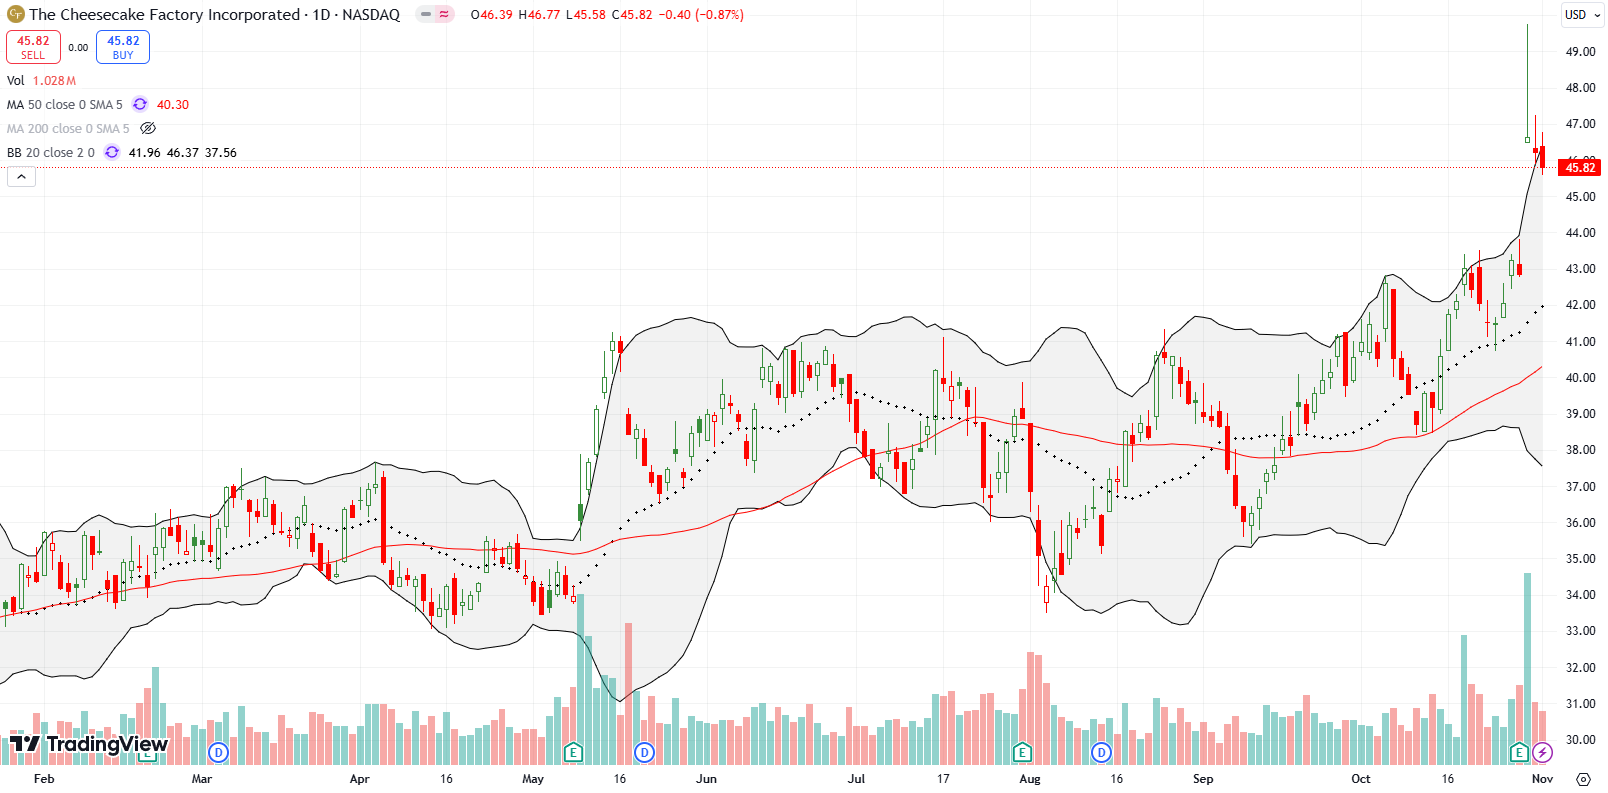
The casual dining stocks that are still doing well continue to amaze me. The Cheesecake Factory Incorporated (CAKE) held an 8.8% post-earnings gain despite a sharp fade from its intraday high. Sellers continued to take profits the last two days of the week, so CAKE is at risk of filling its gap up. CAKE trades at a 3-year high.
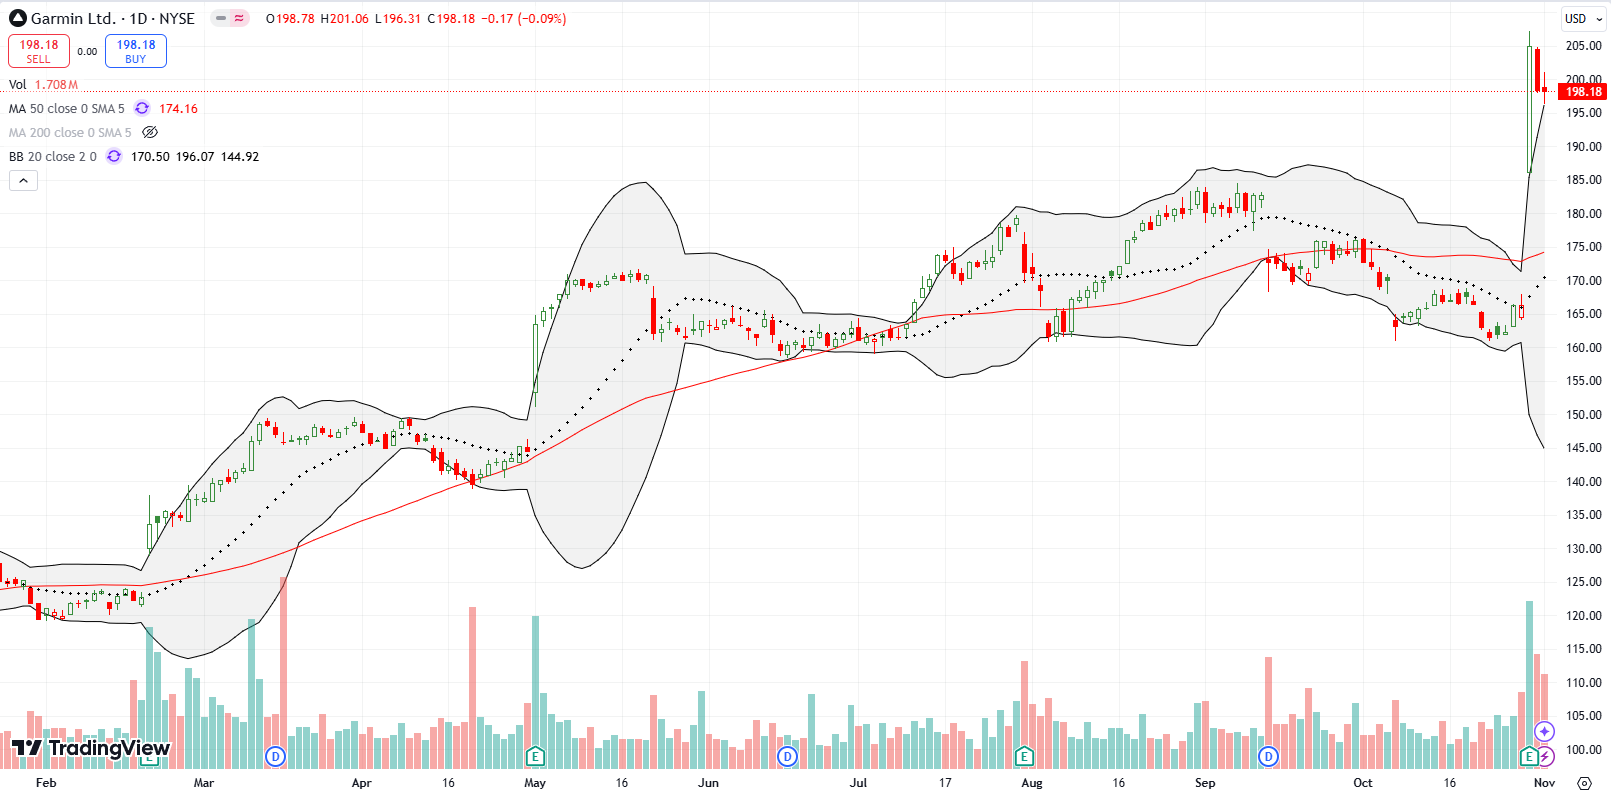
Back in January, Garmin Ltd (GRMN) looked like a tempting but risky trade. Roll the tape 10 months forward and GRMN has pulled off its second post-earnings surge of the year. This time, GRMN gained 23.3% and hit an all-time high. Needless to say, GRMN is a buy the dips from here despite my bearish short-term trading call.
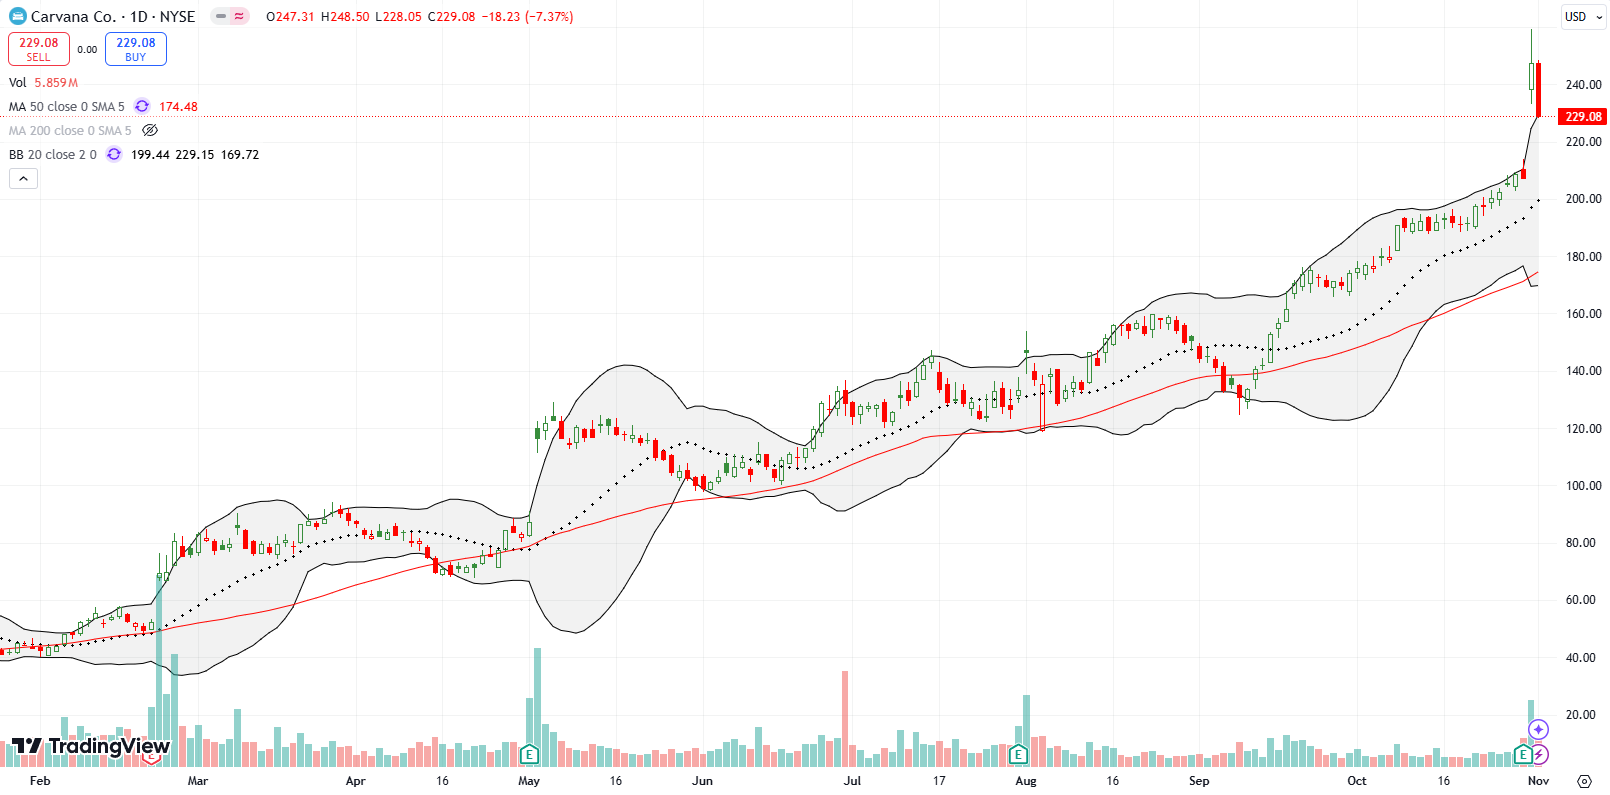
Has online used car seller Carvana Co. (CVNA) finally exhausted the buyers? While the major indices tumbled on Thursday, CVNA jumped 19.3% post-earnings to a near 3-year high. However, on Friday, CVNA suffered a partial fade with a 7.4% reversal on a bearish engulfing move. Now, CVNA is a short until/unless invalidated by a new high. CVNA looks at risk for filling its post-earnings gap up in short order. CNVA has been one of the most incredible stocks in 2024. Its persistent and stubborn uptrend has delivered a 333% year-to-date gain on top of 2023’s 1,149% gain (NOT a typo!).
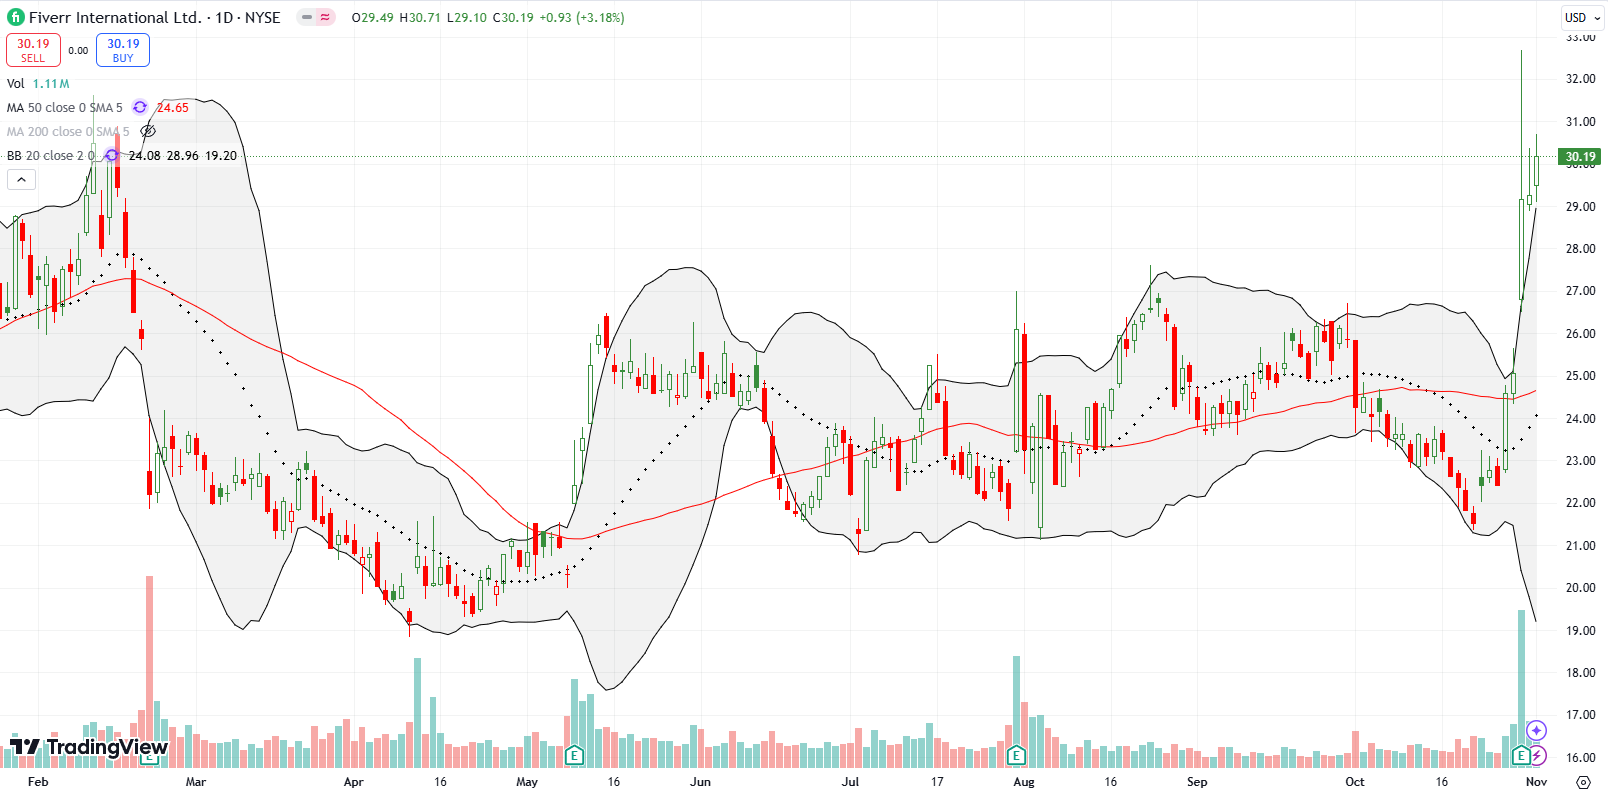
In February, I wrote “How Price Action Can Betray Good News: Stock Spotlight TWLO and FVRR“. My first trade buying into FVRR’s sell-off failed. FVRR finally came to life again in May and filled the February gap down but failed to go anywhere from there. I soon lost interest and took my eye off the ball. Last week, FVRR enjoyed a 16.3% post-earnings jump and closed the week near its high for the year. I do not want to chase FVRR higher given my short-term bearish trading call on the market as a whole, but the stock does look good for a buy on dips.
The company caused excitement by raising its full-year guidance: “The strong performance in Q3 gave us confidence to raise our full-year guidance range for both revenue and Adjusted EBITDA. This also translates into strong cash flow generation and puts us well on track to deliver the three-year targets on Adjusted EBITDA and free cash flow that we laid out last quarter.” Now can Fiverr International Ltd sustain the excitement into 2025?
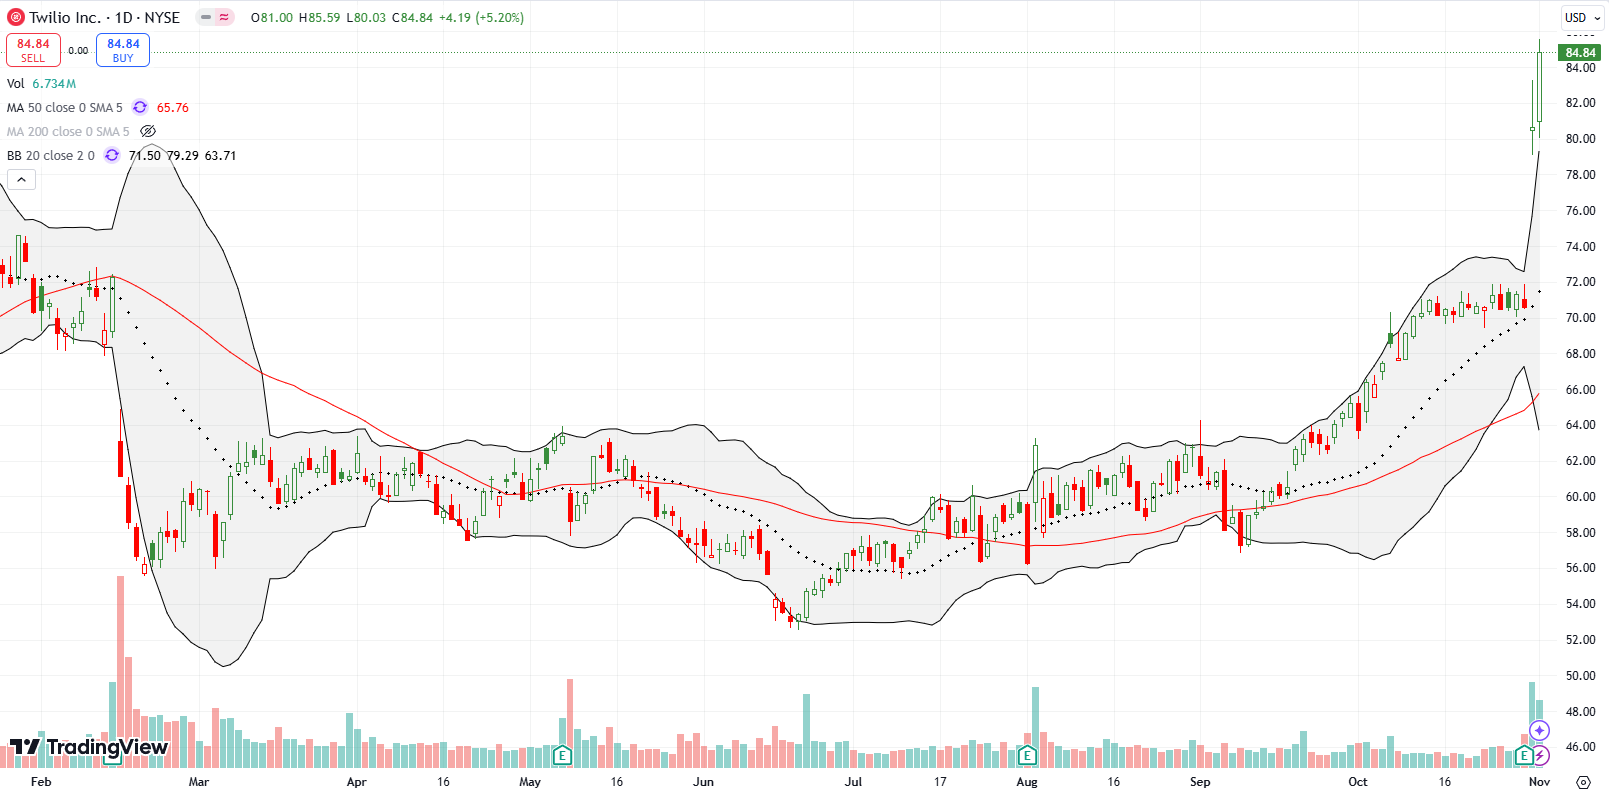
Having missed FVRR, I determined to get aggressive on Twilio, Inc (TWLO) (yes, making another exception to my short-term bearish call on the stock market). I speculated on a call spread and was rewarded with a 14.3% post-earnings gain. On Friday, buyers added an exclamation point with a 5.2% press to a 2+ year high.
Like FVRR, I lost interest in TWLO during weeks and months of churn. In TWLO’s case, my inattentiveness blinded me to the important breakout in September and the eventual fill of the February post-earnings gap down. TWLO consolidated from there into earnings.
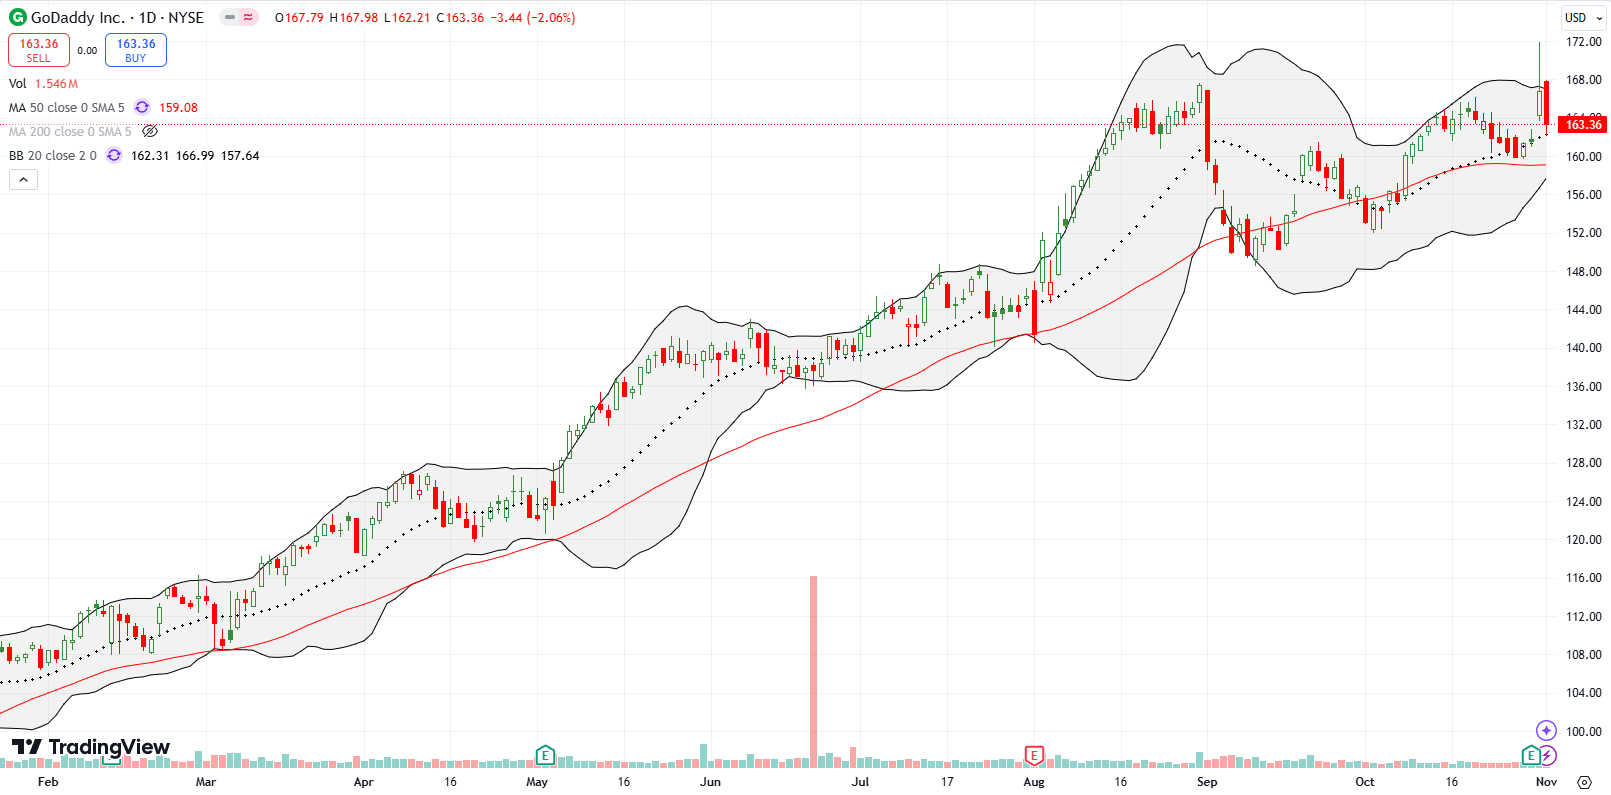
Has GoDaddy, Inc (GDDY) finally exhausted buyers? GDDY has enjoyed a persistent and consistent uptrend all year. The September pullback ended conveniently at uptrending 50DMA support. However, a 3.2% post-earnings gain included a sharp fade from the intraday high with sellers following through on Friday with a near complete reversal of the gains. The pattern looks like a blow-off top and made all the more convincing by a double top. GDDY becomes a short on a confirmed 50DMA breakdown.
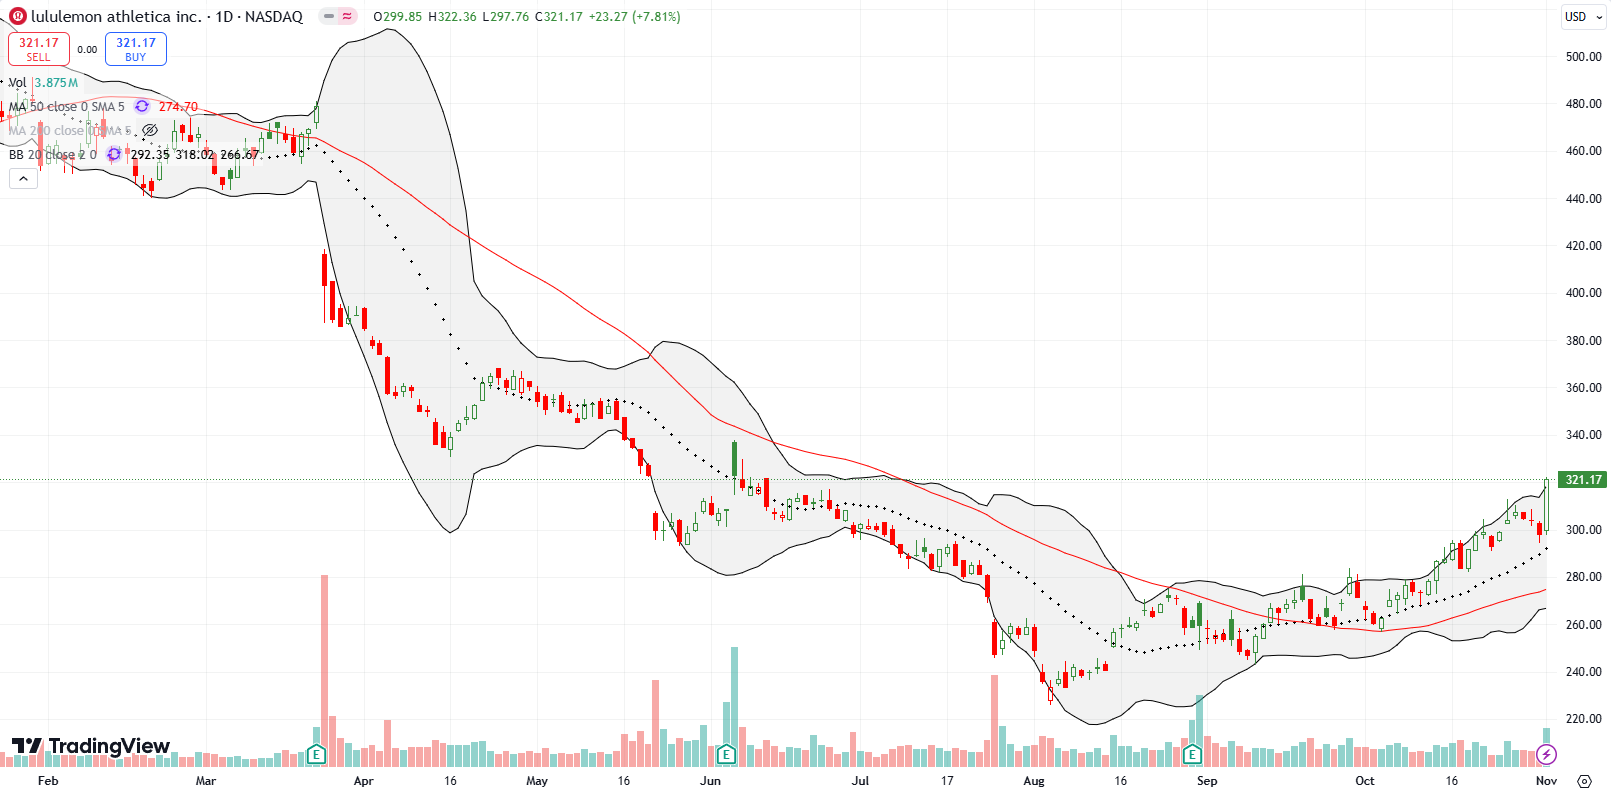
lululemon athletica inc (LULU) is a turn-around stock that came back to life in a big way on Friday. A 7% surge took LULU to a 5-month high. LULU looks ready to resume its steady recovery from a 4+ year low.
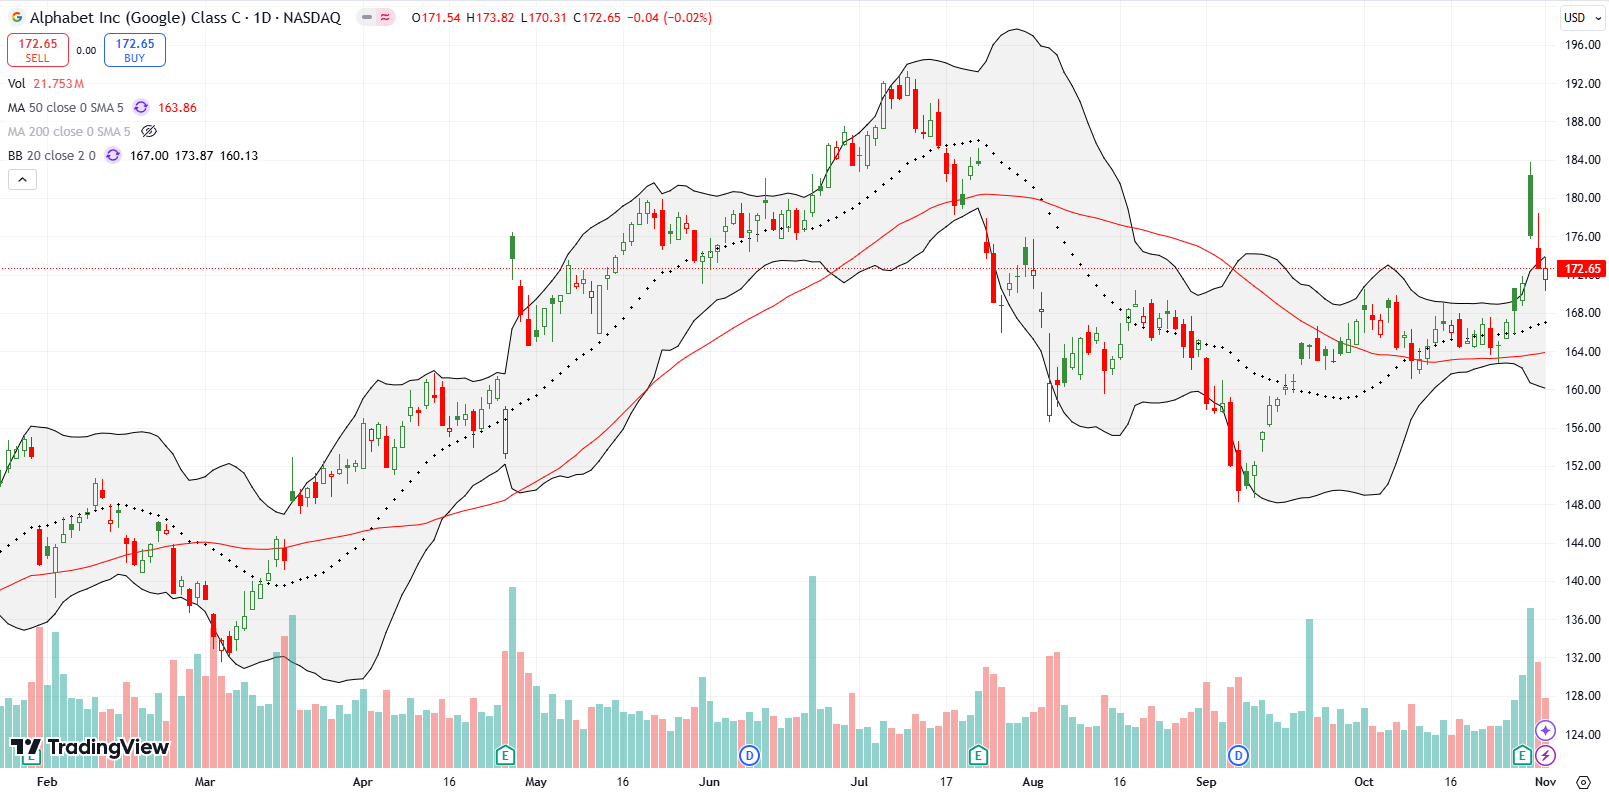
Alphabet Inc (GOOG) provided a good pre-earnings setup. I took the bait on what looked like a coiled spring. I took profits quickly as GOOG’s post-earnings gap suffered a rapid fade. By the close of the week, GOOG finished reversing that gap. The stock is now printing a “calm after the storm.” I am a buyer again on a move above Friday’s intraday high. GOOG is still near the bottom of my perma-bull generative AI trading plays.
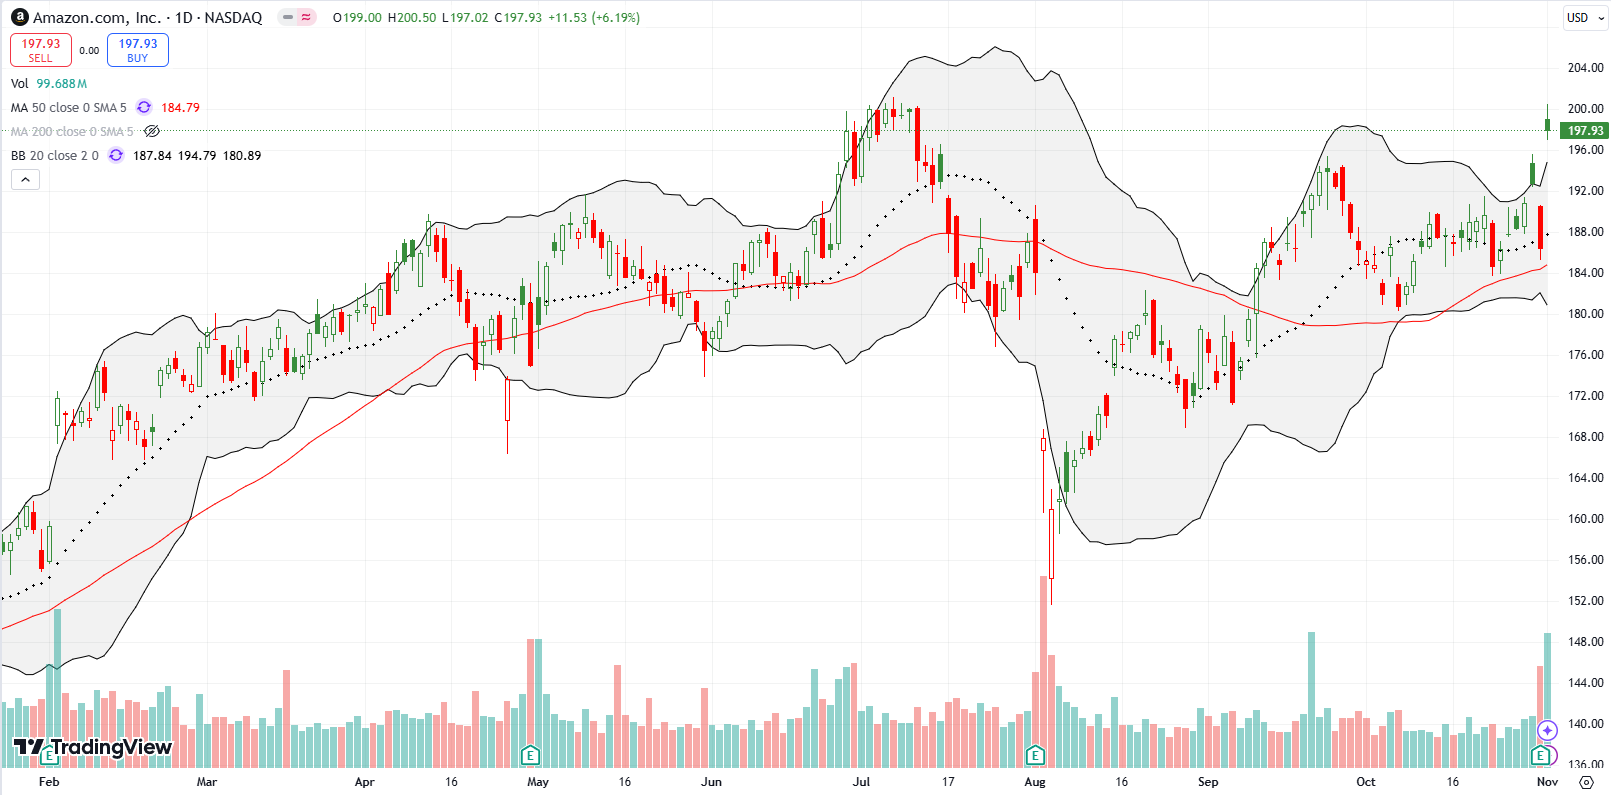
Amazon.com (AMZN) took a tumble on Thursday along with the market and its big cap cousins. The 3.3% loss respected 50DMA support and set up a 6.2% post-earnings jump. AMZN stopped just short of its all-time high. While I have a post-earnings trading rule on AMZN that expects higher prices in the subsequent two weeks, I decided to sit on my hands for this round. I cannot justify a trade on a stock extended well above its upper Bollinger Band, facing down resistance from an all-time high, all while I have a bearish short-term trading call in play.
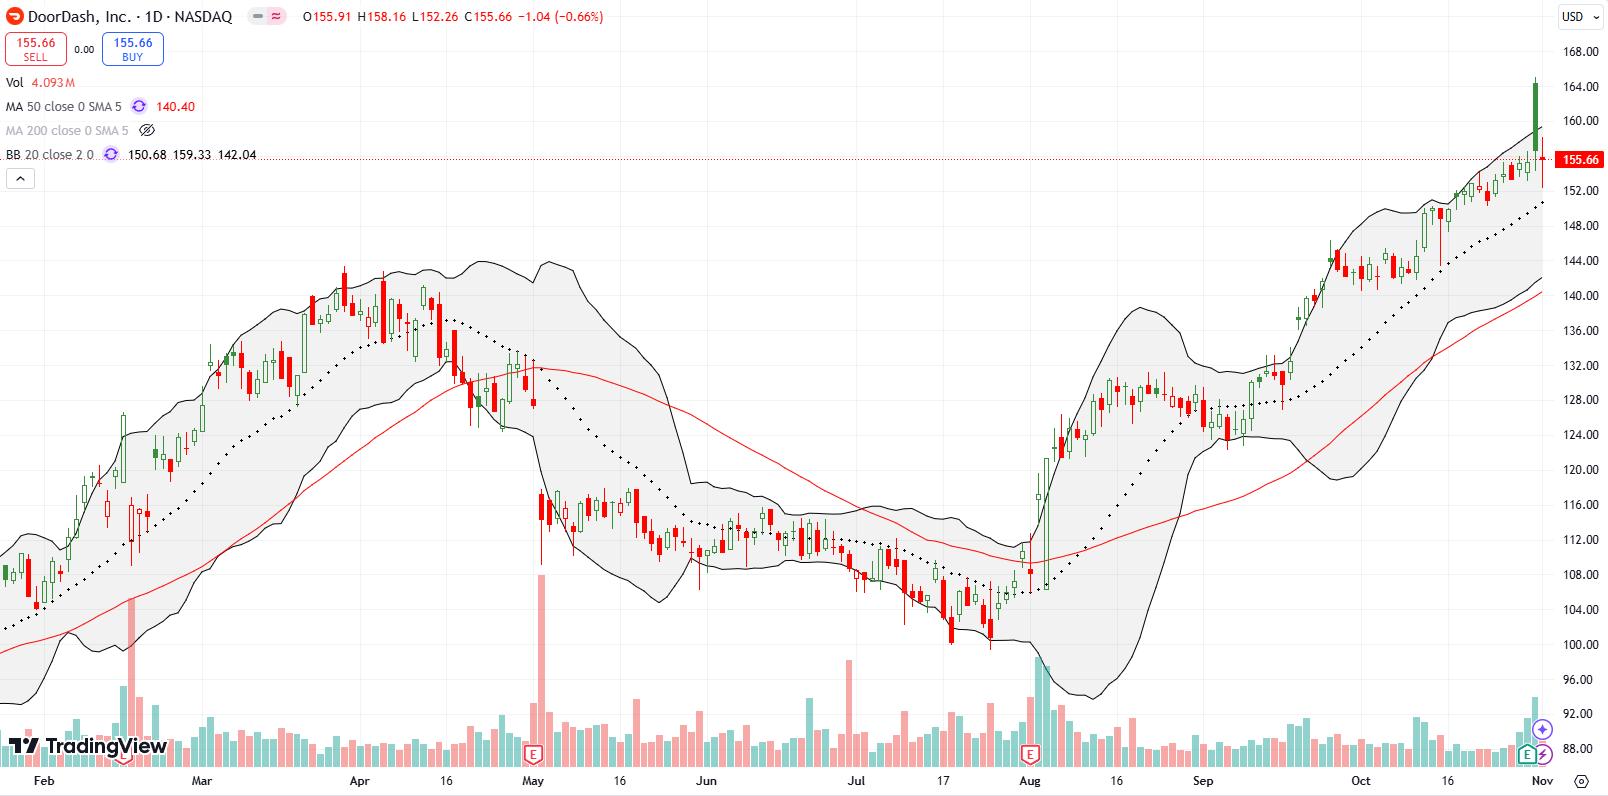
DoorDash, Inc (DASH) is yet another strong stock that suffered a post-earnings fade. DASH gapped up to a near 3-year high but faded to a full reversal of the gains. Sellers on Friday finished the job. Still, DASH is not a short until a break below its strong 20DMA uptrend.
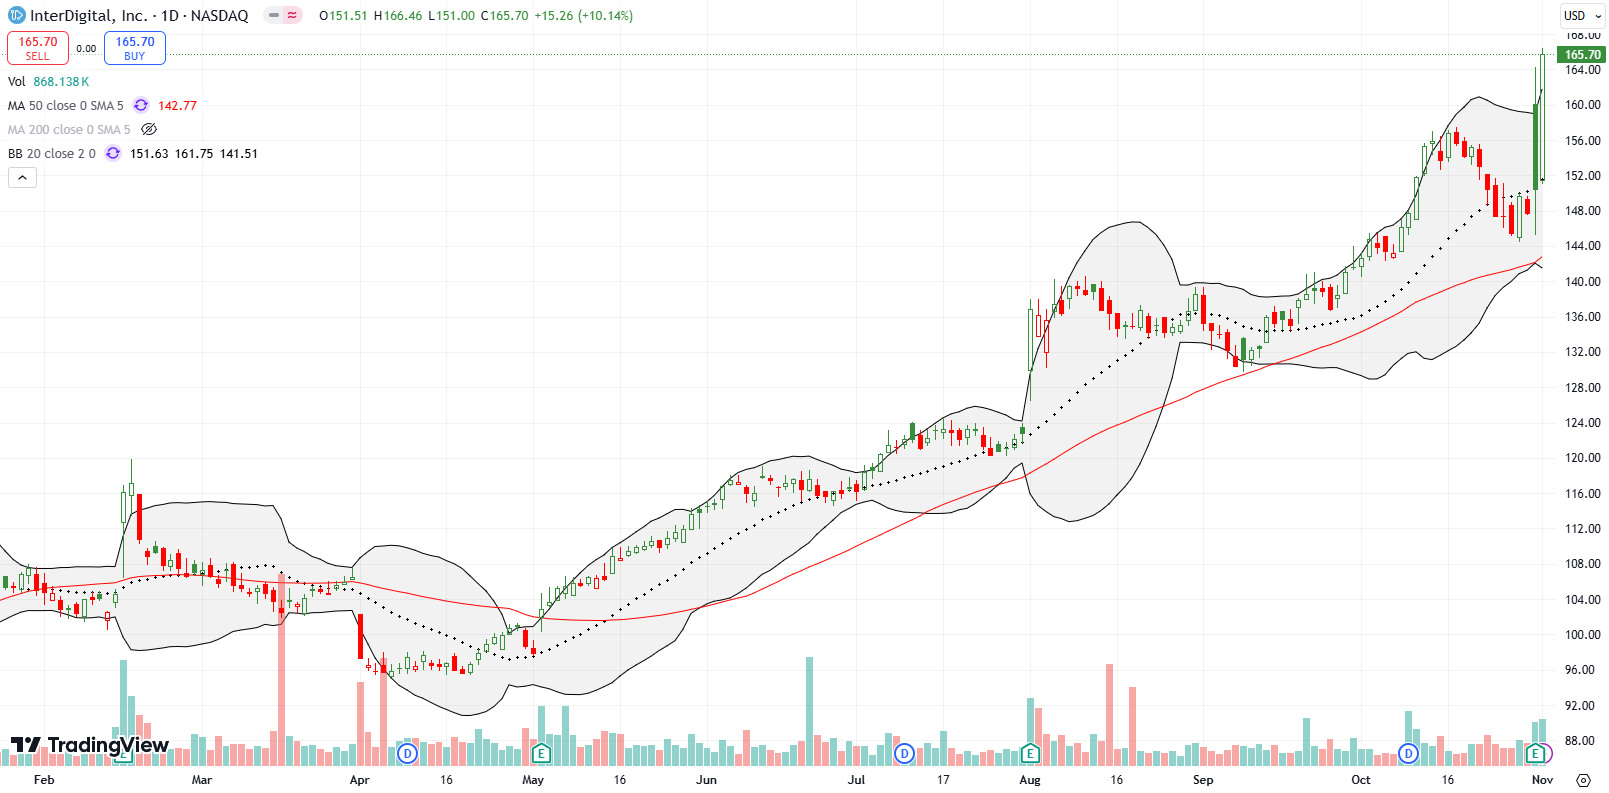
InterDigital, Inc (IDCC) is a stock that REALLY fell off my radar. I wrestled and lost with this stock back in the dotcom bubble and bust days. Last week, I noticed IDCC in a list of stocks on the move post-earnings. IDCC gapped higher to an all-time high, but, like DASH, reversed all its gains at one point. Unlike DASH, buyers returned in force on Friday to send IDCC to a new all-time high. I noticed the company has expanded its technology research and development (and IP collection) into AI. This addition must be helping to drive excitement this year.
Be careful out there!
Footnotes
Subscribe for free to get email notifications of future posts!
“Above the 50” (AT50) uses the percentage of stocks trading above their respective 50-day moving averages (DMAs) to measure breadth in the stock market. Breadth defines the distribution of participation in a rally or sell-off. As a result, AT50 identifies extremes in market sentiment that are likely to reverse. Above the 50 is my alternative name for “MMFI” which is a symbol TradingView.com and other chart vendors use for this breadth indicator. Learn more about AT50 on my Market Breadth Resource Page. AT200, or MMTH, measures the percentage of stocks trading above their respective 200DMAs.
Active AT50 (MMFI) periods: Day #238 over 20%, Day #137 over 30%, Day #61 over 40%, Day #2 under 50%, Day #9 under 60%, Day #76 under 70%
Source for charts unless otherwise noted: TradingView.com
Full disclosure: long SPY put spread, long IWM shares and calls, long QQQ put spread, long UBER put, long HOOD, long SNAP, long LULU
FOLLOW Dr. Duru’s commentary on financial markets via StockTwits, Twitter, and even Instagram!
*Charting notes: Stock prices are not adjusted for dividends. Candlestick charts use hollow bodies: open candles indicate a close higher than the open, filled candles indicate an open higher than the close.


