

Stock Market Commentary
A strong September jobs report woke up the stock market from lethargic trading. The numbers handily beat expectations and reset expectations for future rate cuts and economic growth. Surprisingly, the good news was not bad news; the market has typically been antsy about getting lower interest rates. Instead of fearing a longer path to rate cuts, the stock market celebrated with broad based gains. This awakening from lethargic trading sets up the stock market for an October rally absent a significant pullback.
The maximum drawdown so far this month is 1.1% whereas the average maximum pullback is around 3%. The market survived a lot of bad news converging into the beginning of October. Thus I cannot imagine what fresh catalyst gets the ball rolling for a seasonal pullback. Earnings season starts this week, but I cannot even remember the last time earnings results created a significant negative impact on the stock market as a whole.
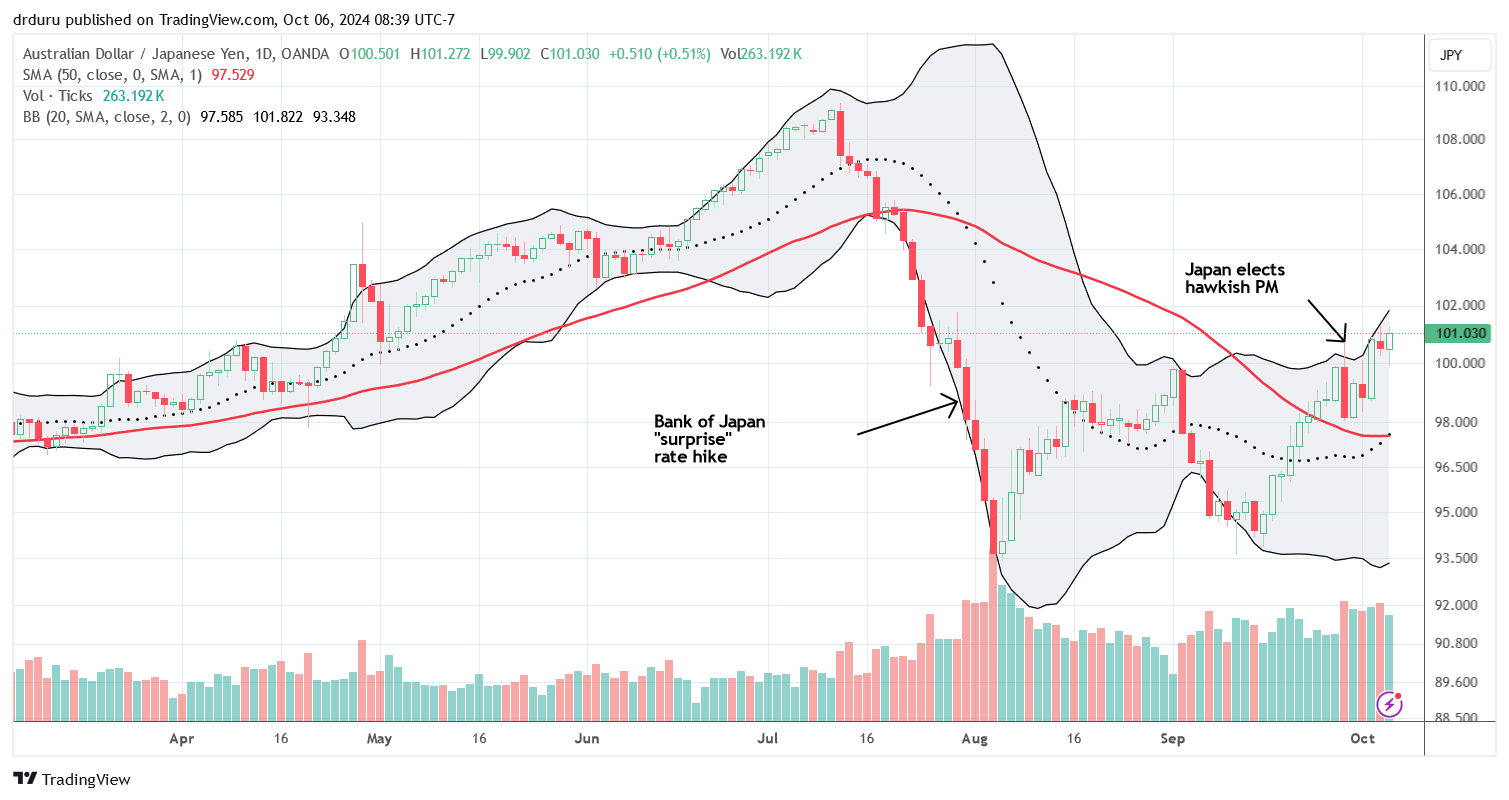
The currency market is moving in the stock market’s favor and even leaning against lethargic trading. The Japanese yen (FXY) continues to weaken as if traders are rushing right back into carry trades. My favorite forex indicator of market sentiment, AUD/JPY, has been in rally mode since mid-September. Last week AUD/JPY broke out to a new 2+ month high. AUD/JPY even quickly rebounded from a post-election pullback. Heavy fiscal and monetary stimulus from China is bound to help Australia as well. So I am now getting strong market cues from AUD/JPY.
The Stock Market Indices
A lethargic mood weighed the S&P 500 (SPY) toward support at its 20-day moving average (DMA) (the dotted line) until the strong jobs report woke up the index. The index gained 0.9% and jumped right back to its all-time high. The price action looks repositioned for a fresh rally, especially given the tailwind from AUD/USD.
")
A lethargic mood also weighed the NASDAQ (COMPQ) toward its 20DMA support ahead of the strong jobs report. The 1.2% gain did not place the tech laden index in the clear. Not only did the NASDAQ fall well short of the previous high, but also the index has yet to challenge the bearish engulfing top from the July.
")
The iShares Russell 2000 ETF (IWM) has suffered from lethargic trading since mid-September. The ETF of small caps held 50DMA support (the red line) ahead of the strong jobs report. The 1.4% gain took IWM above its 20DMA. IWM almost looks poised to make a run at its previous high.
")
The Short-Term Trading Call With Lethargic Trading
- AT50 (MMFI) = 59.6% of stocks are trading above their respective 50-day moving averages
- AT200 (MMTH) = 59.7% of stocks are trading above their respective 200-day moving averages
- Short-term Trading Call: neutral
AT50 (MMFI), the percentage of stocks trading above their respective 50DMAs, jumped to 59.6% in the wake of the strong jobs report. Lethargic trading weighed on my favorite technical indicator starting with its 4th (bearish) failure from the overbought threshold in the last 2 months. While I have little reason for bearishness right now, I also cannot get bullish given the overall tepid and lethargic trading. Even a fresh breakout of the S&P 500 may not get the job done until the NASDAQ invalidates its topping signal. Thus, my short-term trading call stays at neutral.
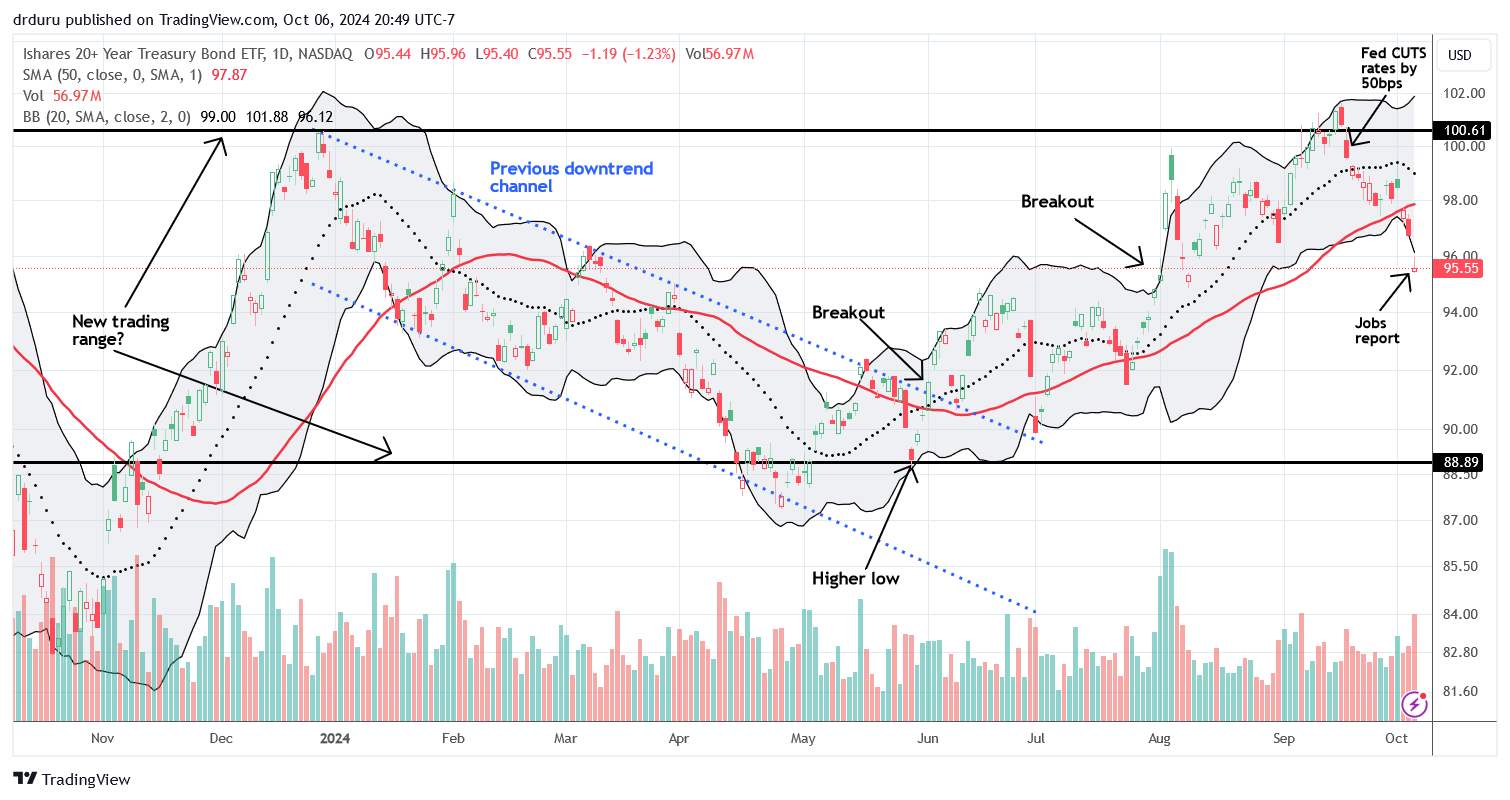
A post-Fed lethargic mood in the Ishares 20+ Year Treasury Bond ETF (TLT) accelerated into a 50DMA breakdown last week. The creep upward in long-term interest rates (lower TLT) hinted about the market’s disagreement with the dovish implications of the Fed’s 50 basis point cut. With a strong September jobs report on the books, the bond market must feel vindicated. I took profits on my TLT put options ahead of the jobs report. I next hope to fade TLT at 50DMA resistance.
Housing-related stocks weakened in the face of higher long-term rates even though good news on employment should put a floor under the market. My trade on online listing company Redfin Corporation (RDFN) failed after the stock sliced through 20DMA support. I stopped out of the position the next day and flipped to put options given the confirmed breakdown. I am looking for a test of 50DMA support.
")
My trade on the hype over the Tesla, Inc (TSLA) robotaxi event this week got interrupted by the market’s disappointment with Tesla’s latest car delivery numbers. The profit on the put options was small consolation for losing the long side of the hedge trade. Undeterred, I refreshed the trade to directly play the robotaxi hype. I sold a put spread to pay for a call spread and hedged the position with shares in the Tradr 2X Short TSLA Daily ETF (TSLQ). The trade profits on almost any lift up to the strike of the short side of the call spread. Downside losses are limited given the position in the put spread, but I profit from a larger correction.
")
Humana Inc (HUM) ran into fresh trouble last week with an 11.8% gap down and loss the day after the stock lost 11.8% on a confirmation of 20DMA resistance. The first hit came after Humana released new 2025 Medicare Advantage offerings that spooked investors. The next day HUM gapped down and collapsed from bad news released in an 8K filing. The first paragraph of the disclosure probably says it all:
“Based on preliminary 2025 Medicare Advantage (MA) Star Ratings data provided by the Centers for Medicare and Medicaid Services (CMS), which became available in CMS Plan Finder as of October 1, 2024, Humana Inc. (“the Company”) has approximately 1.6 million, or 25%, of its members currently enrolled in plans rated 4 stars and above for 2025, a reduction from 94% in 2024. A significant driver of these results was contract H5216 decreasing to a 3.5-star rating from a 4.5-star rating in 2024. H5216 contains approximately 45% of Humana’s MA membership, including greater than 90% of its employer group waiver plan (Group MA) membership. The decline in Stars performance for 2025 will impact Humana’s quality bonus payments in 2026. 2025 Star rating details are expected to be formally released by CMS on or around October 10th.”
HUM is now back to the lows from the immediate wake of the pandemic. This year has been the year that everything fell apart for HUM.
")
The Children’s Place, Inc (PLCE) experienced a slow burn after it collapsed in February, wildly rebounded, and then continued to sell off. PLCE soared 85.7% after reporting earnings last month and almost doubled from there before topping out. I am now watching closely to see whether PLCE can hold 20DMA support for a continued rebound.
")
I did a hedged call and put trade on Roblox Corporation (RBLX) as the stock tested 50DMA support. The position seemed to quickly pay off as the stock pulled back further despite the market rally on the strong jobs report. A late rally brought the position back to flat. So now I wait to see whether a comeback is strong enough to generate a 50DMA breakout and a resumption of the rally from the May post-earnings low.
")
")
")
Be careful out there!
Footnotes
Subscribe for free to get email notifications of future posts!
“Above the 50” (AT50) uses the percentage of stocks trading above their respective 50-day moving averages (DMAs) to measure breadth in the stock market. Breadth defines the distribution of participation in a rally or sell-off. As a result, AT50 identifies extremes in market sentiment that are likely to reverse. Above the 50 is my alternative name for “MMFI” which is a symbol TradingView.com and other chart vendors use for this breadth indicator. Learn more about AT50 on my Market Breadth Resource Page. AT200, or MMTH, measures the percentage of stocks trading above their respective 200DMAs.
Active AT50 (MMFI) periods: Day #218 over 20%, Day #117 over 30%, Day #41 over 40%, Day #16 over 50%, Day #4 under 60%, Day #56 under 70%
Source for charts unless otherwise noted: TradingView.com
Full disclosure: long SPY put spread, long IWM shares and call options, short AUD/JPY; long TSLQ, short TSLA put spread, long TSLA call spread; long QQQ put spread, long RDFN puts, long RBLX strangle,
FOLLOW Dr. Duru’s commentary on financial markets via StockTwits, Twitter, and even Instagram!
*Charting notes: Stock prices are not adjusted for dividends. Candlestick charts use hollow bodies: open candles indicate a close higher than the open, filled candles indicate an open higher than the close.