Stock Market Commentary
The S&P 500 is down 4.1% month-to-date. This loss makes this month a below average September for a maximum drawdown and fulfills September’s reputation as one of the index’s three most dangerous months of the year. As I noted last week, August’s extreme drawdown significantly increased the risk of September being worse than its average maximum drawdown of -2.9%. The market has realized this risk, so now what?
Given market breadth is still quite a ways away from oversold trading conditions, I have to assume significant downside risk remains for this month. The volatility index (VIX) closed at a 1-month high and looks ready to go much higher. While the August calamity was unable to drive market breadth to oversold conditions, I suspect a fresh surge in the VIX could do the trick.
Interestingly, this fresh weakness in stocks is coming even as the market looks forward to rate cuts from the Federal Reserve. However, expectations are so high that the meeting actually runs the risk of delivering a major disappointment (I wrote about this prospect in Seeking Alpha in “How September Got More Risky Despite The Promise Of A Rate Cut“). Fed Governor Christopher Waller stoked expectations of substantial rate cuts to come near the end of a speech appropriately titled “The Time Has Come” at the University of Notre Dame: “I was a big advocate of front-loading rate hikes when inflation accelerated in 2022, and I will be an advocate of front-loading rate cuts if that is appropriate.”
Of course, the prospect of sizeable cuts driven by the economic data implies the potential for substantial weakness in the economy. Such prospects undermine the logic of today’s lofty stock prices. Thus, bad news is bad.
Friday’s weakness in the stock market also followed a jobs report for August that delivered fewer jobs than “expected” but showed strong wage growth and a small decline in the unemployment rate. I did not interpret the report as particularly bearish or Fed-moving news.
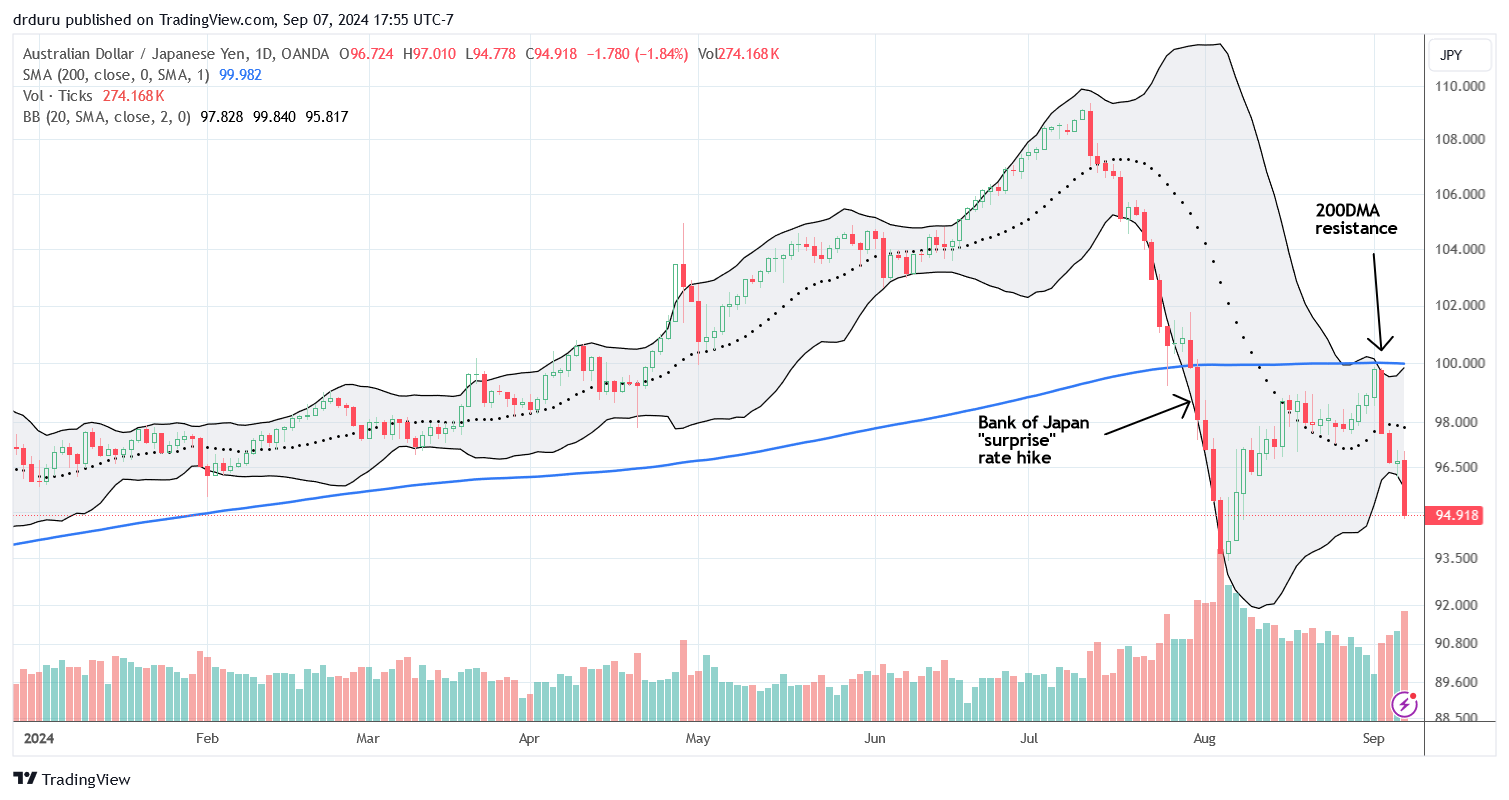
Above all, the currency market looks like the most ominous catalyst for a below average September. An unwind of the carry trade helped drive the August calamity, and the Japanese yen is strengthening again. Particularly, the Australian dollar versus the Japanese yen (AUD/JPY) plunged off the most recent high, and its weakness matched the weakness in the stock market. AUD/JPY’s close well below the lower Bollinger Band (BB) provides the prospect for a market rebound to start the coming week…but I will be ready to fade such a move given Friday’s breakdown for the S&P 500….
The Stock Market Indices
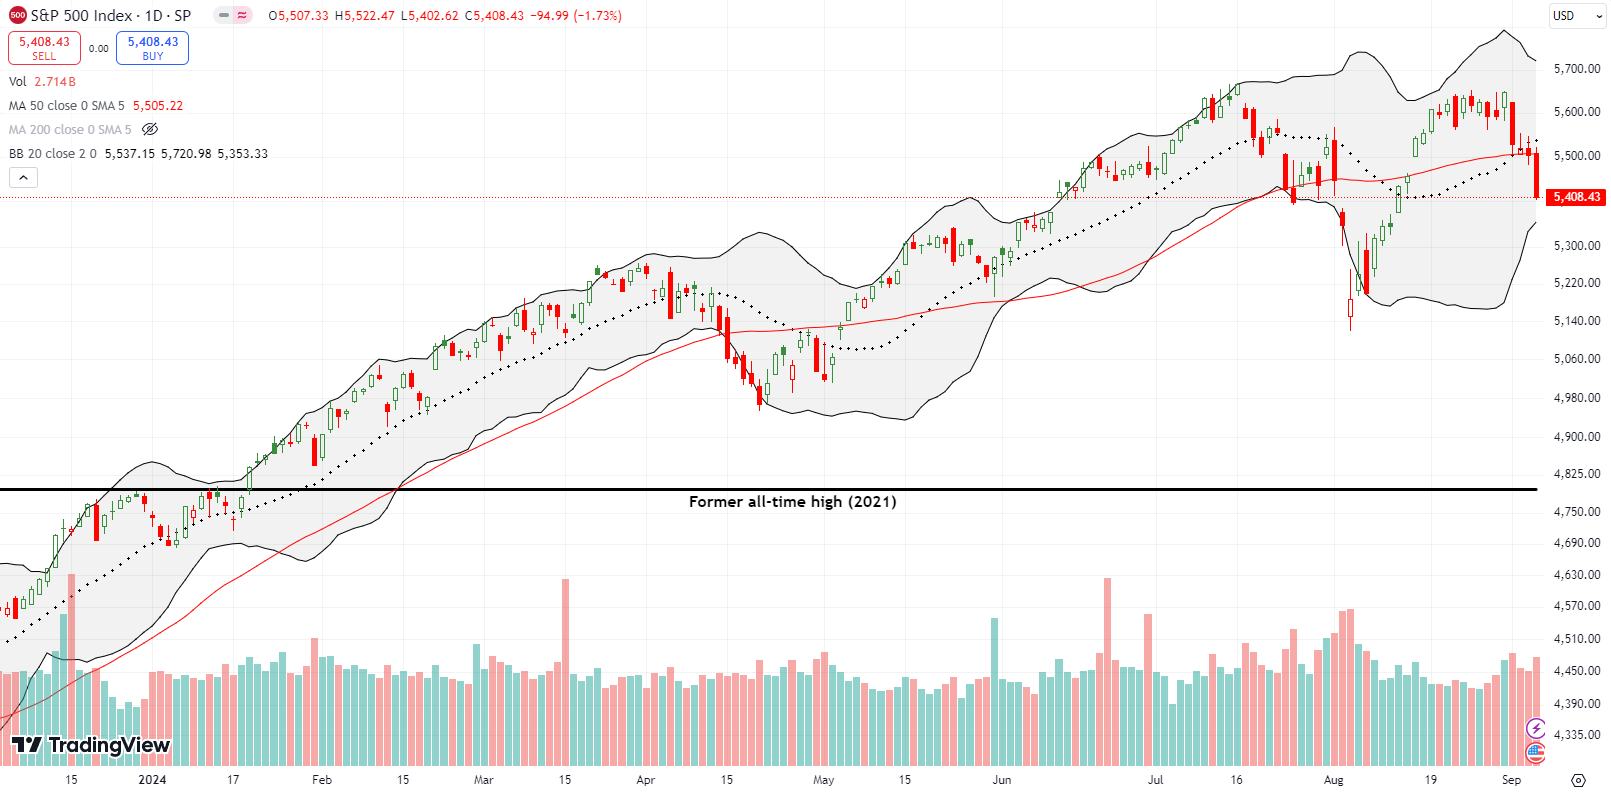
The S&P 500 (SPY) broke down below support at its 50-day moving average (DMA) (the red line below). The breakdown follows a promising end to August where the the index closed at its high of the day and looked poised for a breakout. Instead, the S&P 500 looks like it is leaving behind a double top. I took profits in SPY puts at 50DMA support. I will now look to reload on a test of 50DMA resistance.
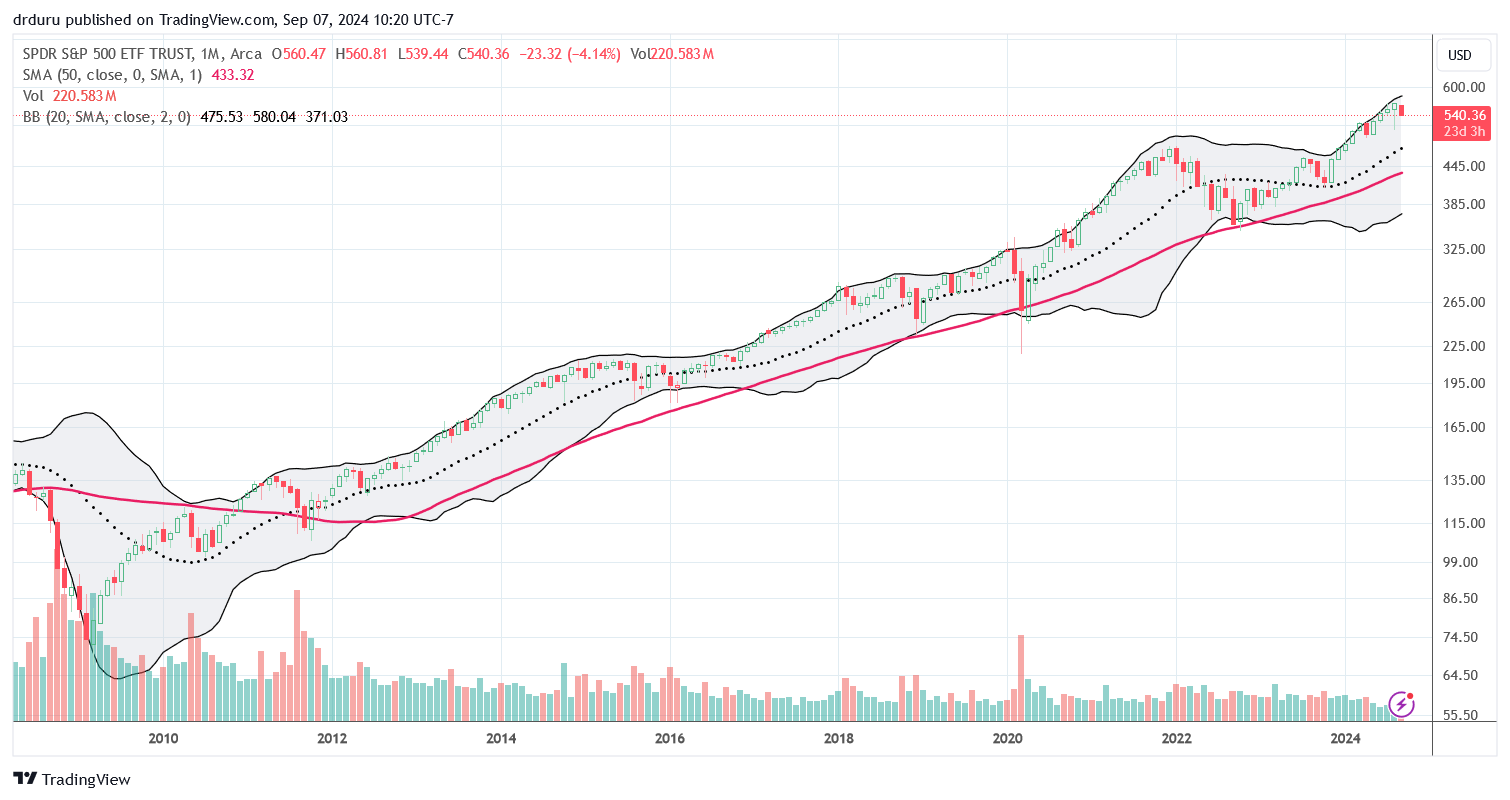
The monthly chart below provides some perspective. September’s below average drawdown may “feel” bad, but the 4.1% loss looks like a “pinprick” compared to the long-term, 15-year run-up for the S&P 500. I like checking this chart both for the awesome bullishness of it…and a reminder of just how far the market could fall in a real, extended bear market. Until the 2022 bear market, the S&P 500 experienced only brief bouts of weakness thanks to a generally supportive Federal Reserve.
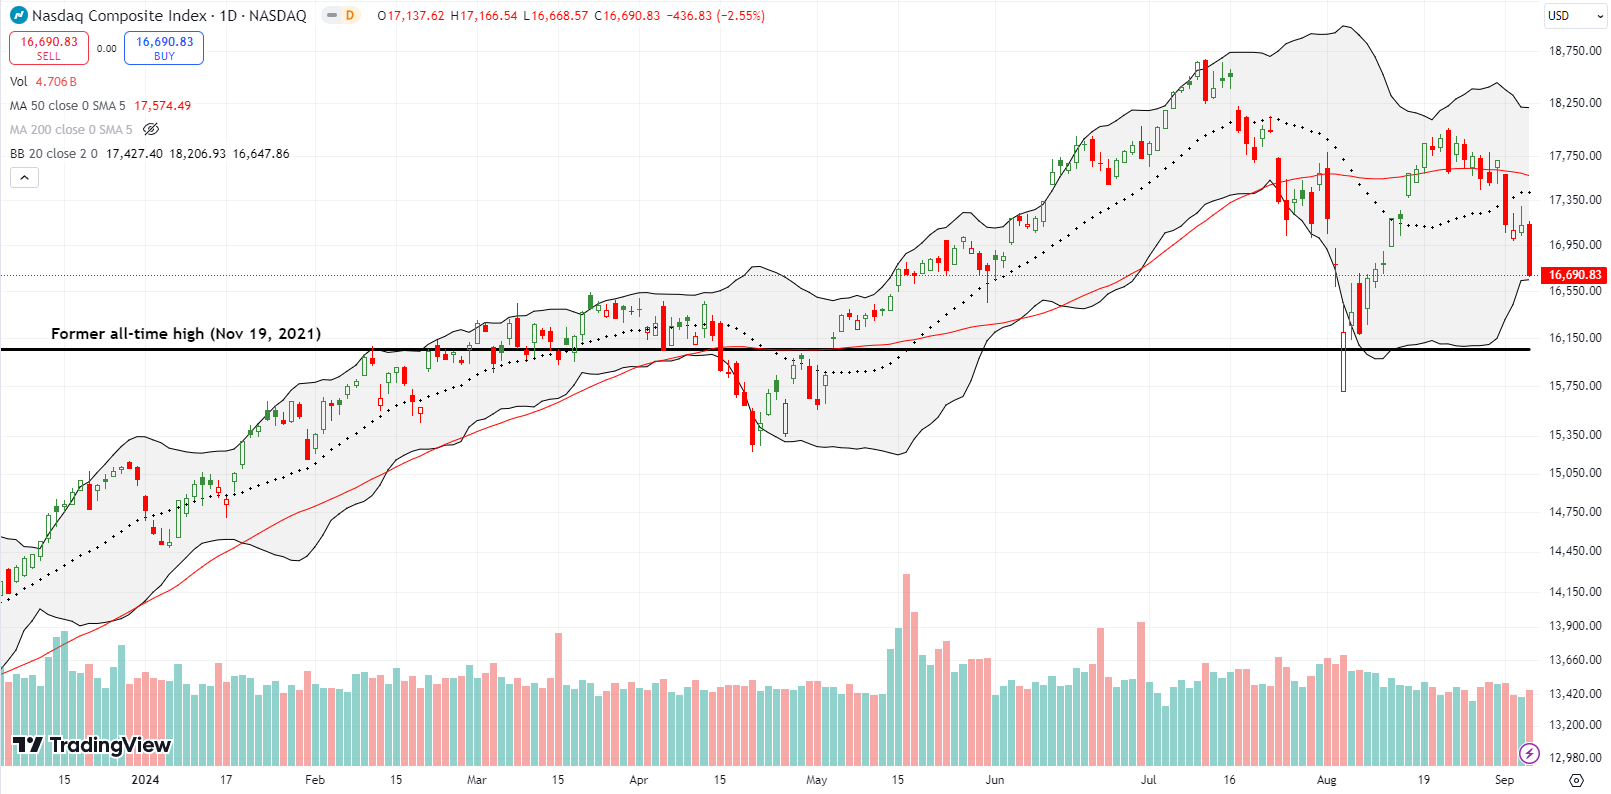
The NASDAQ (COMPQ) already looks ready to test its August lows. The tech laden index confirmed its 50DMA breakdown and is already down 5.7% for September. I bought a weekly QQQ put calendar hoping to carry a long put into the coming week. However, Friday’s plunge took the position below the strike price, so I had to take profits to avoid the short side getting exercised.
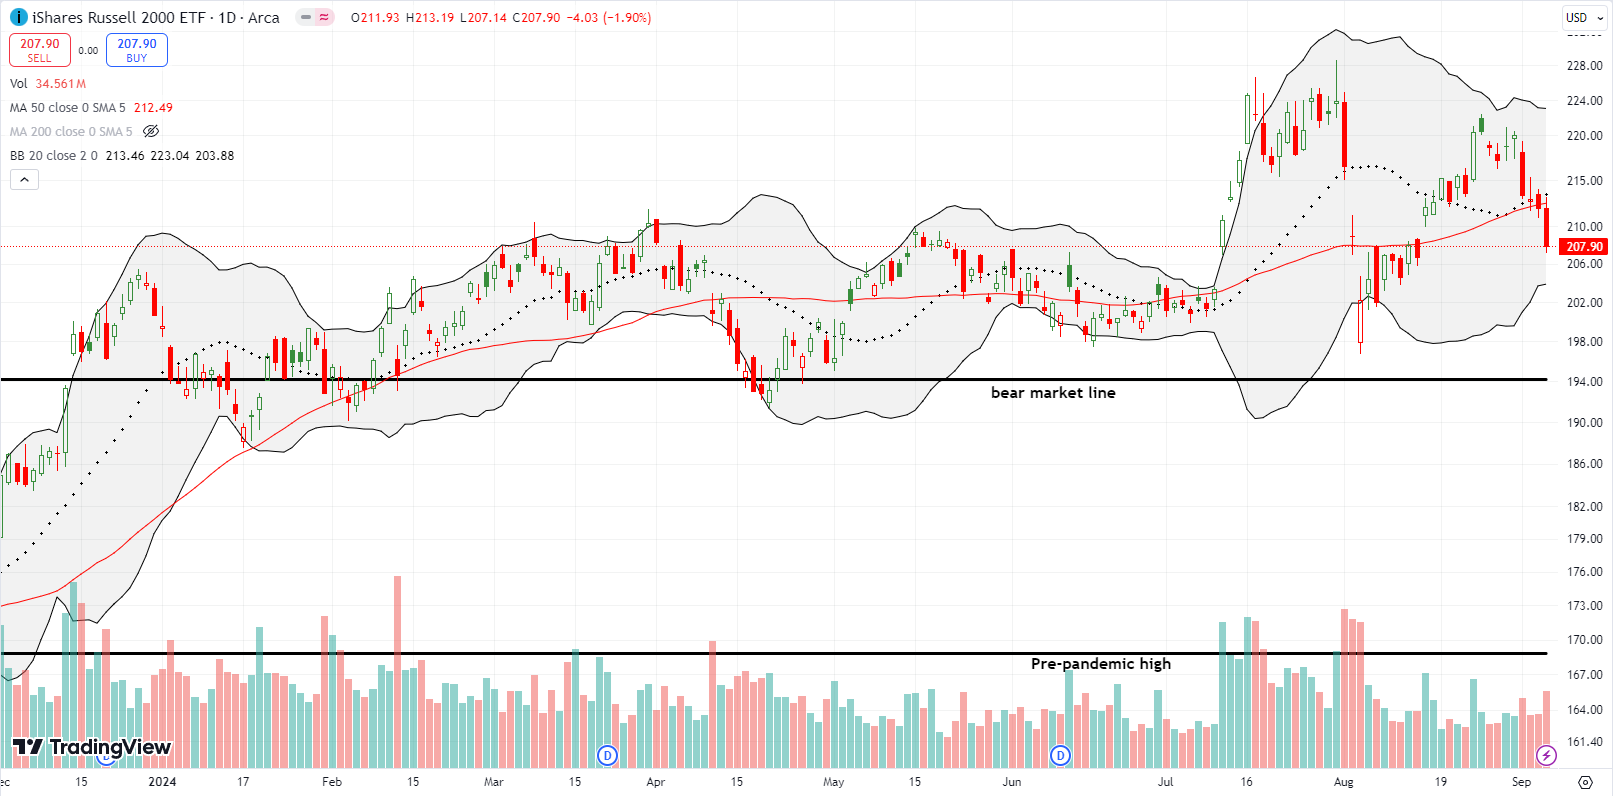
The iShares Russell 2000 ETF (IWM) also suffered a 50DMA breakdown. The 1.9% loss on Friday makes IWM look topped out for the year. So much for Tom Lee’s prediction of a 40% rally into the end of the year. The good news is that if IWM somehow turns around to follow Tom Lee’s lead, the ETF of small caps must first break out above its 50DMA and also make a new high for the year. That is, traders and investors will get plenty of signals before IWM pulls off some kind of a miraculous comeback. I bought IWM calls that are looking like they will not survive this coming Friday’s expiration.
The Short-Term Trading Call While Below Average
- AT50 (MMFI) = 44.2% of stocks are trading above their respective 50-day moving averages
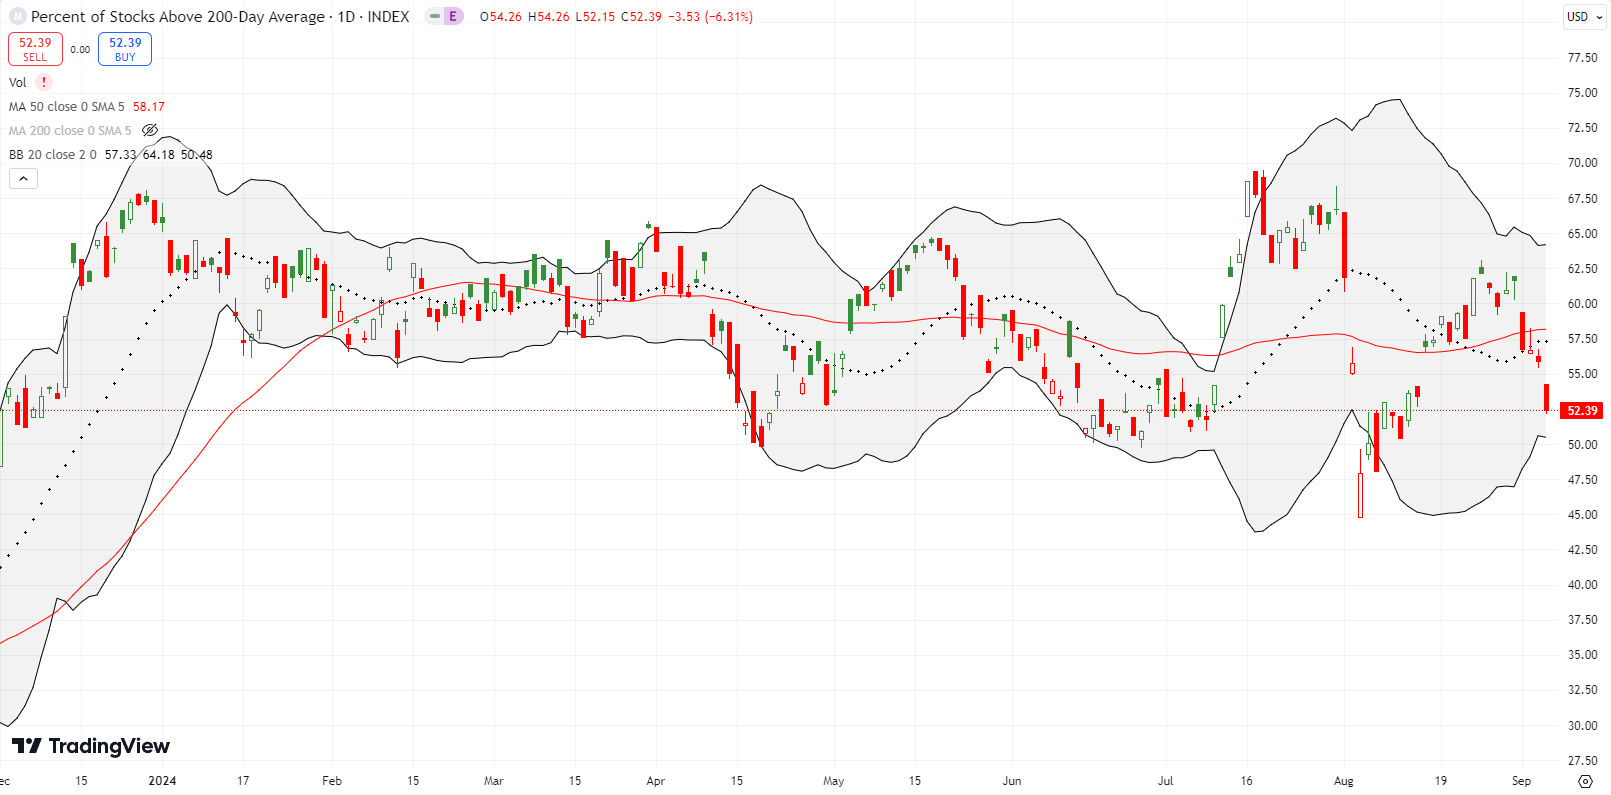
- AT200 (MMTH) = 52.4% of stocks are trading above their respective 200-day moving averages
- Short-term Trading Call: cautiously bearish
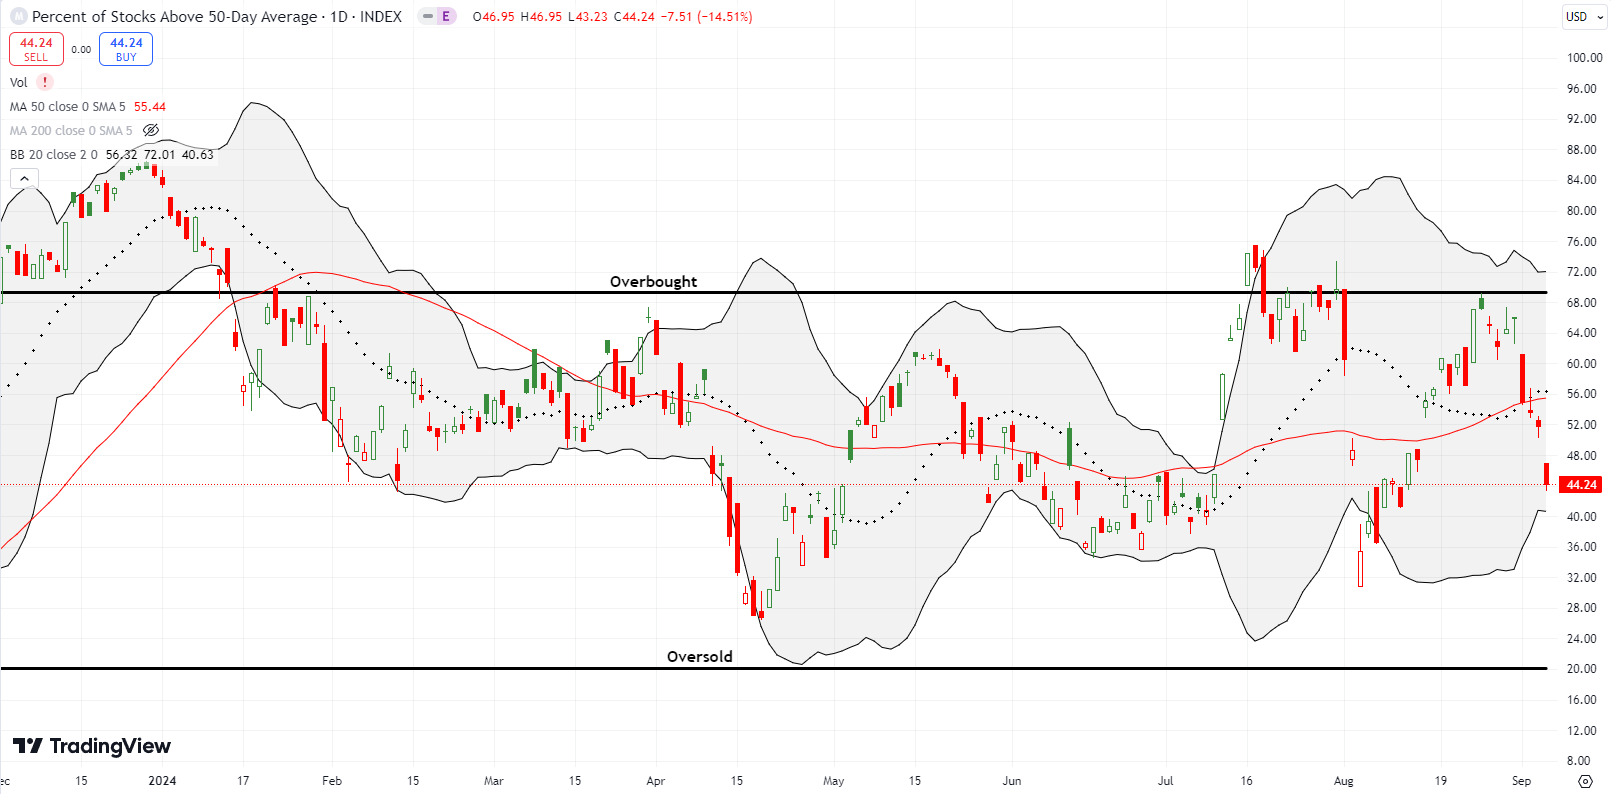
AT50 (MMFI), the percentage of stocks trading above their respective 50DMAs, plunged from 66% to 44%. I suspect this decline was swift and sharp enough to create an “oversold impression” for long-term investors. However, short-term traders should take heed to the nearly synchronized 50DMA breakdowns across the S&P 500, the NASDAQ, and IWM. All three indices look topped out and near-term upside looks limited to a rebound back to 50DMA resistance. A retest of the August lows would offer a better risk/reward opportunity. I of course want to see AT50 drop into oversold conditions (below 20%) and thus trigger the AT50 trading rules.
I am conflicted about downgrading the short-term trading call to cautiously bearish. The change aligns with my dominant trading patterns from last week, but I am mindful of the strong potential for a relief rally this week and even going into the Fed meeting the following week. The bearish signals are loud and clear. Yet, a few are getting stretched. Speaking loud and clear are 1) a confirmed rejection from the AT50 overbought threshold which triggered a bearish call per for the AT50 trading rules, 2) synchronized 50DMA breakdowns, and 3) the various topping patterns in the indices. Speaking loud but getting stretched are 1) a plunging AUD/JPY, and 2) a surging VIX (I bought VXX puts thinking the jobs report would relieve a lot of market fear).
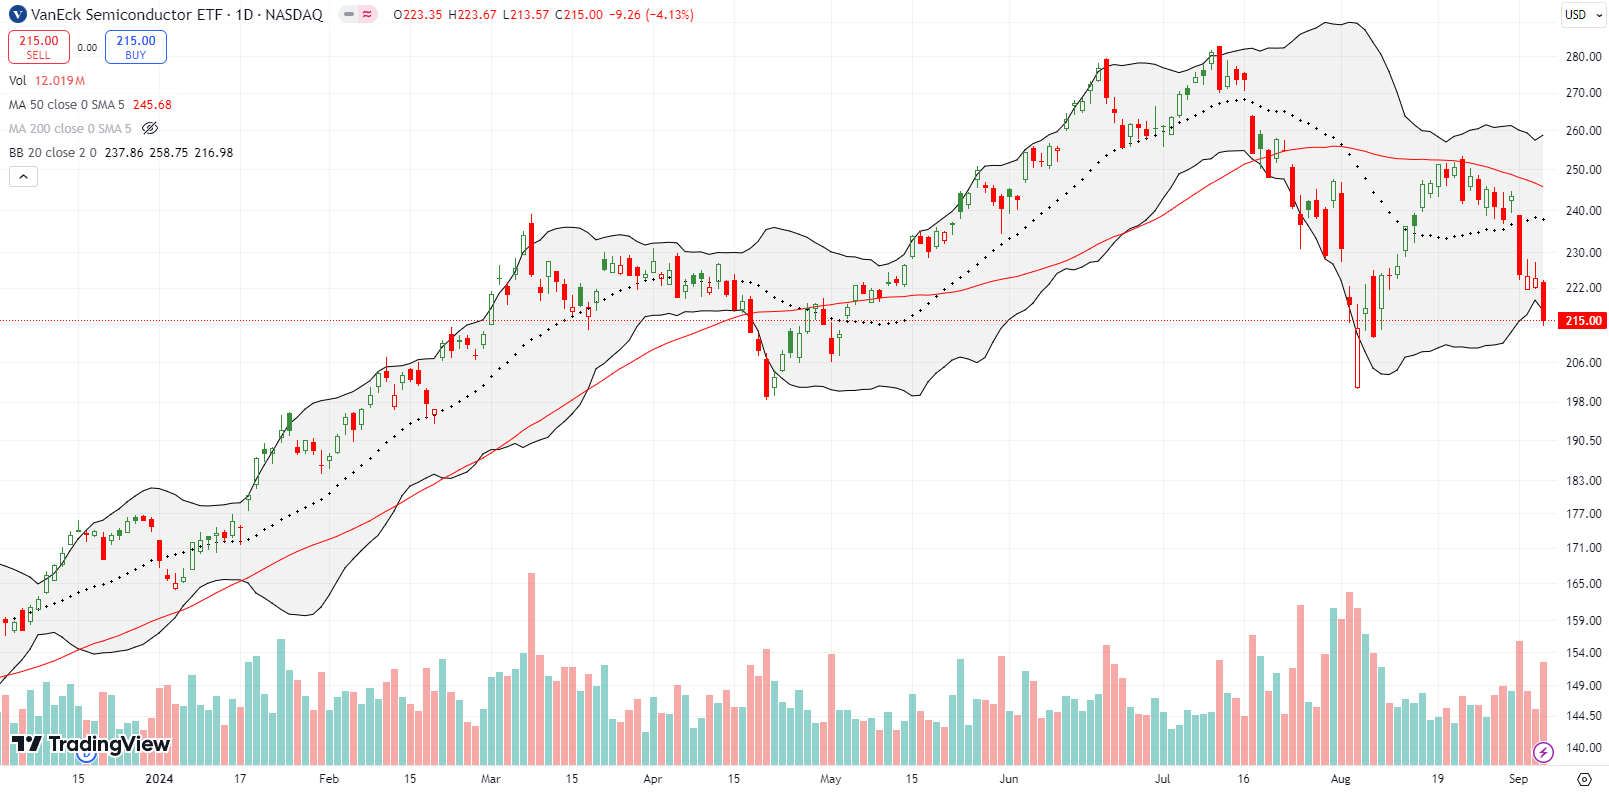
Semiconductor stocks were some of the biggest losers of the week. The VanEck Semiconductor ETF (SMH) lost a whopping 11.7% and easily confirmed a bearish rejection from 50DMA resistance. SMH even looks ready to test the August lows after breaking down below its 200DMA (not shown) on Friday. Thus, SMH looks like the proverbial canary in the coal mine for flagging bearish versus bullish sentiment. Since triple bottoms are rare, a test of the August lows – which also tested the significant April low on an intraday basis – will represent a precarious moment for the stock market! This on-going breakdown supports the bearish case.
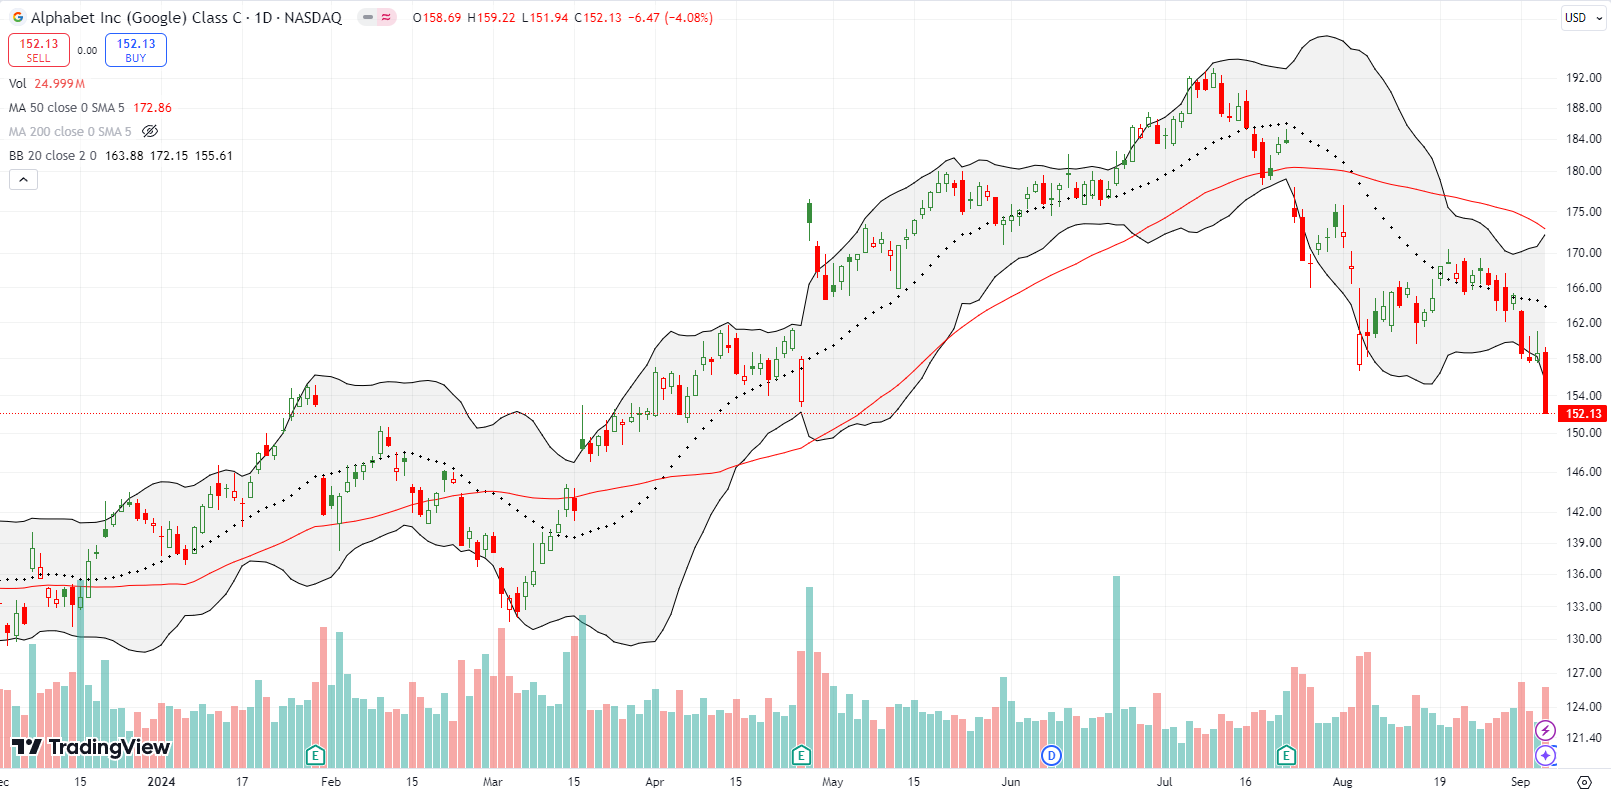
In late July, I demoted Alphabet Inc (GOOG) to the bottom of the generative AI basket. That bearish outlook now looks timely. GOOG experienced a tepid rebound from the August calamity. Last week, GOOG slipped right by the August lows, and Friday’s 4.1% loss took GOOG well below its 200DMA (not shown). GOOG is now in outright bearish territory,
To the downside, GOOG looks interesting again at the March lows. Otherwise, I will need to see a convincing and confirmed 50DMA breakout to get interested again.
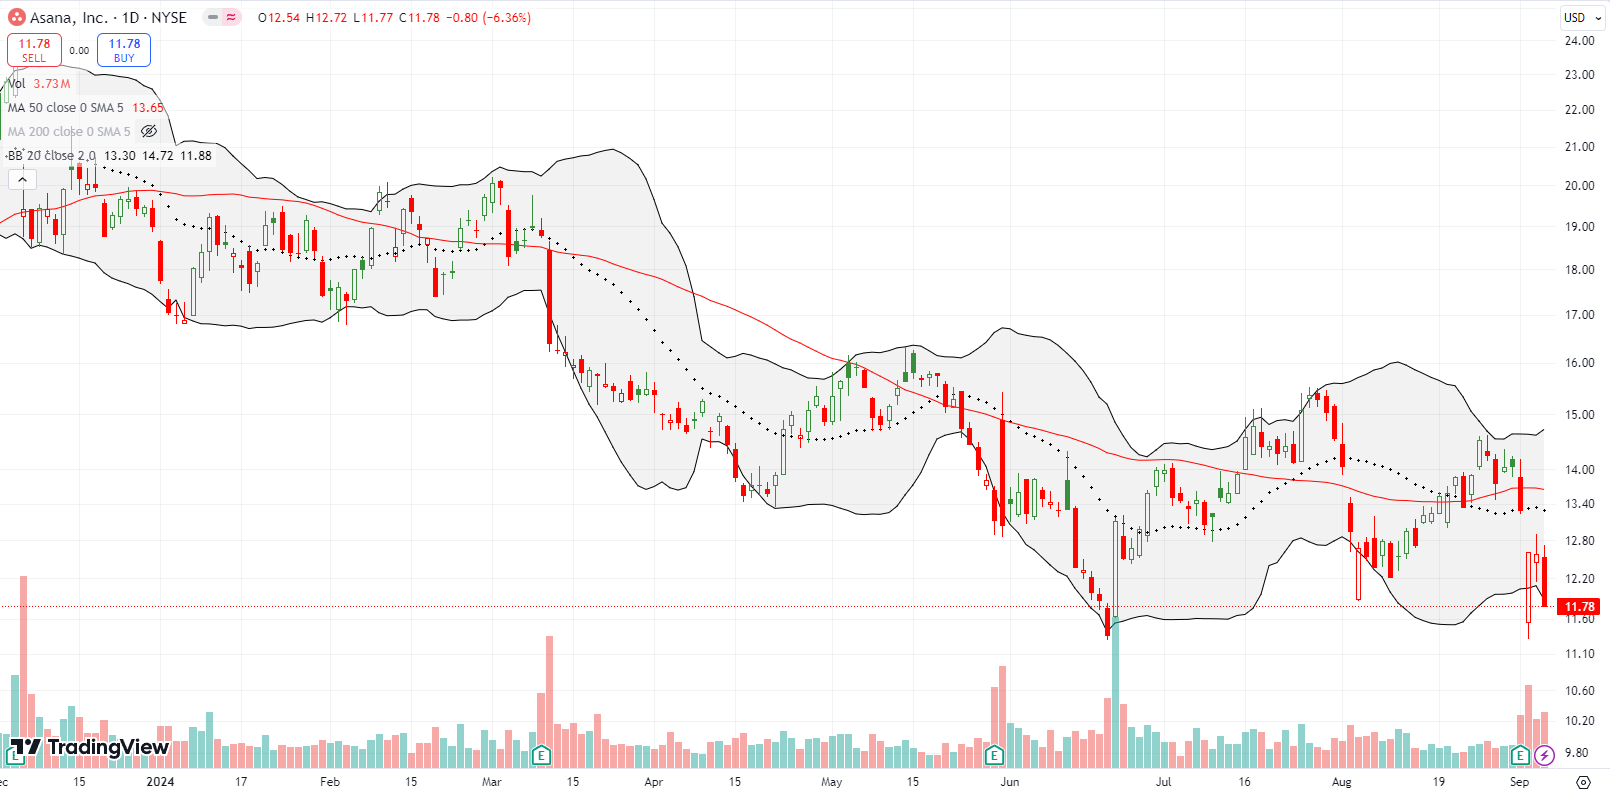
The struggles continue for Asana, Inc (ASAN) despite a $150M buyback that lifted the stock off all-time lows in June. At the time, I decided not to chase the stock a second time. After last week’s earnings, ASAN lost ground yet again. This time, buyers automagically lifted ASAN off all-time lows, but Friday’s selling turned the stock right back around. Fresh all-time lows look likely especially with the growing weakness in enterprise software stocks.
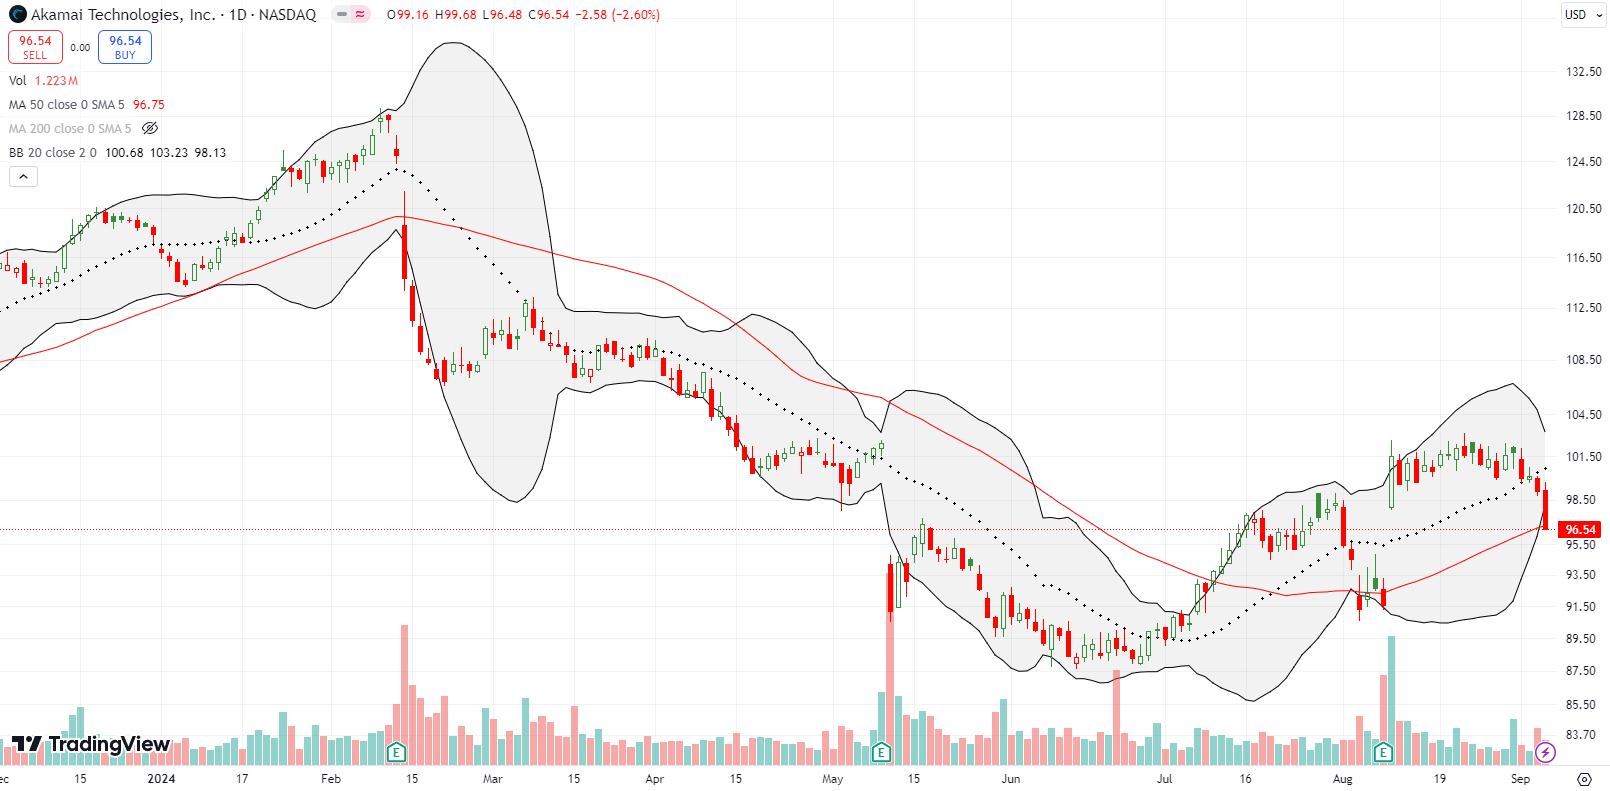
I was hopeful that the CEO’s significant purchase of shares in Akamai Technologies, Inc (AKAM) would create enough lift to insulate AKAM from the growing weakness in enterprise software stocks. AKAM held its ground after a 10.9% post-earnings pop. However, last week proved to be too much. AKAM accelerated and slammed into 50DMA support. I doubt this support will hold. Instead, AKAM looks likely to reverse its entire post-earnings gap up.
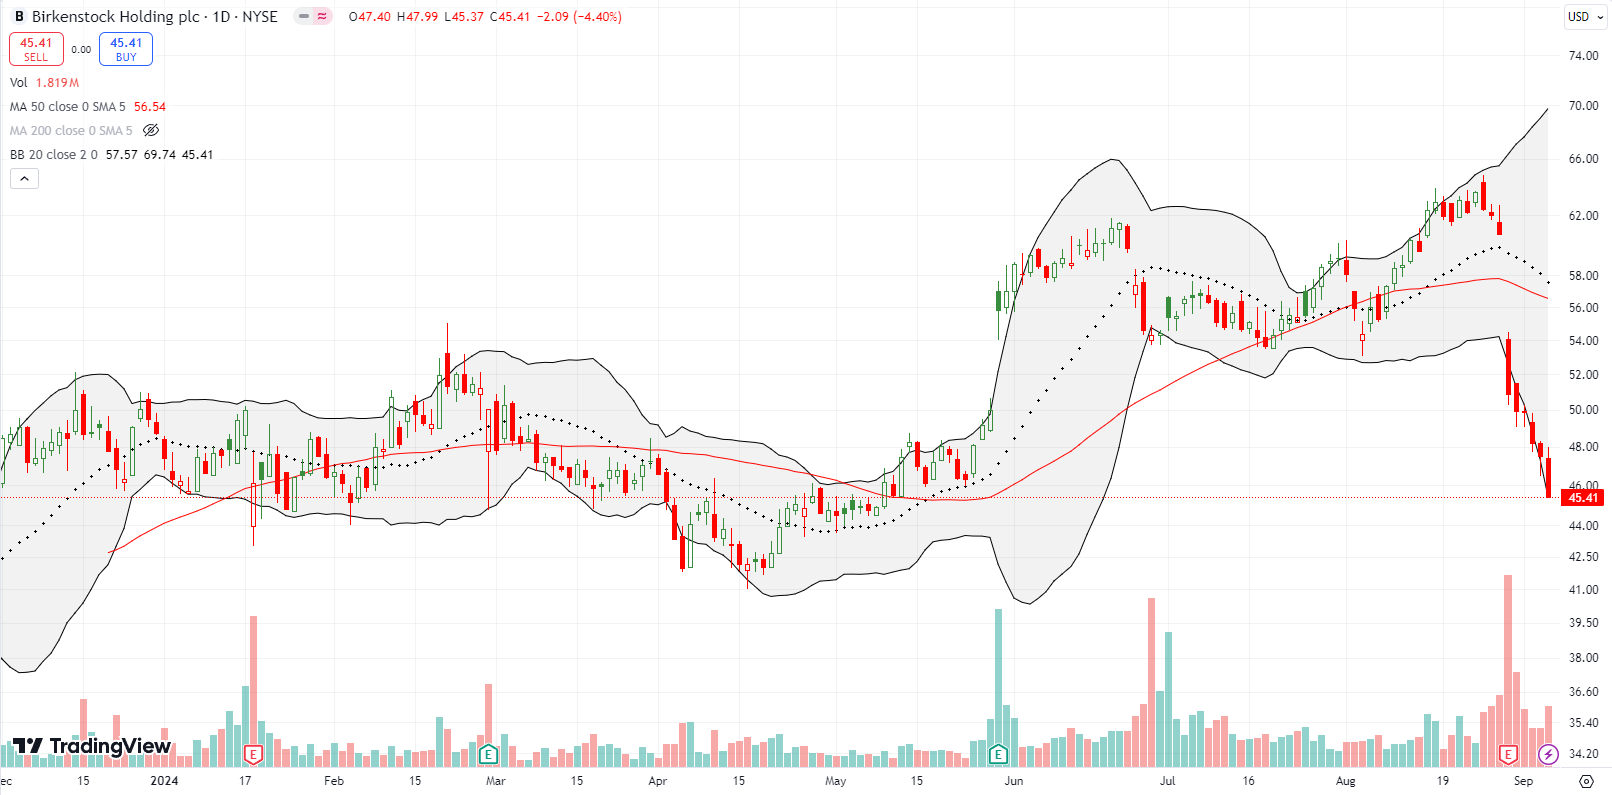
Sock and shoe company Birkenstock Holding PLC (BIRK) went into its last earnings report with a small decline from an all-time high. That decline expanded rapidly after a 16.1% post-earnings loss. BIRK has lost ground every day since then and finds itself down for the year. BIRK is still about 25% up from its post-IPO opening price.
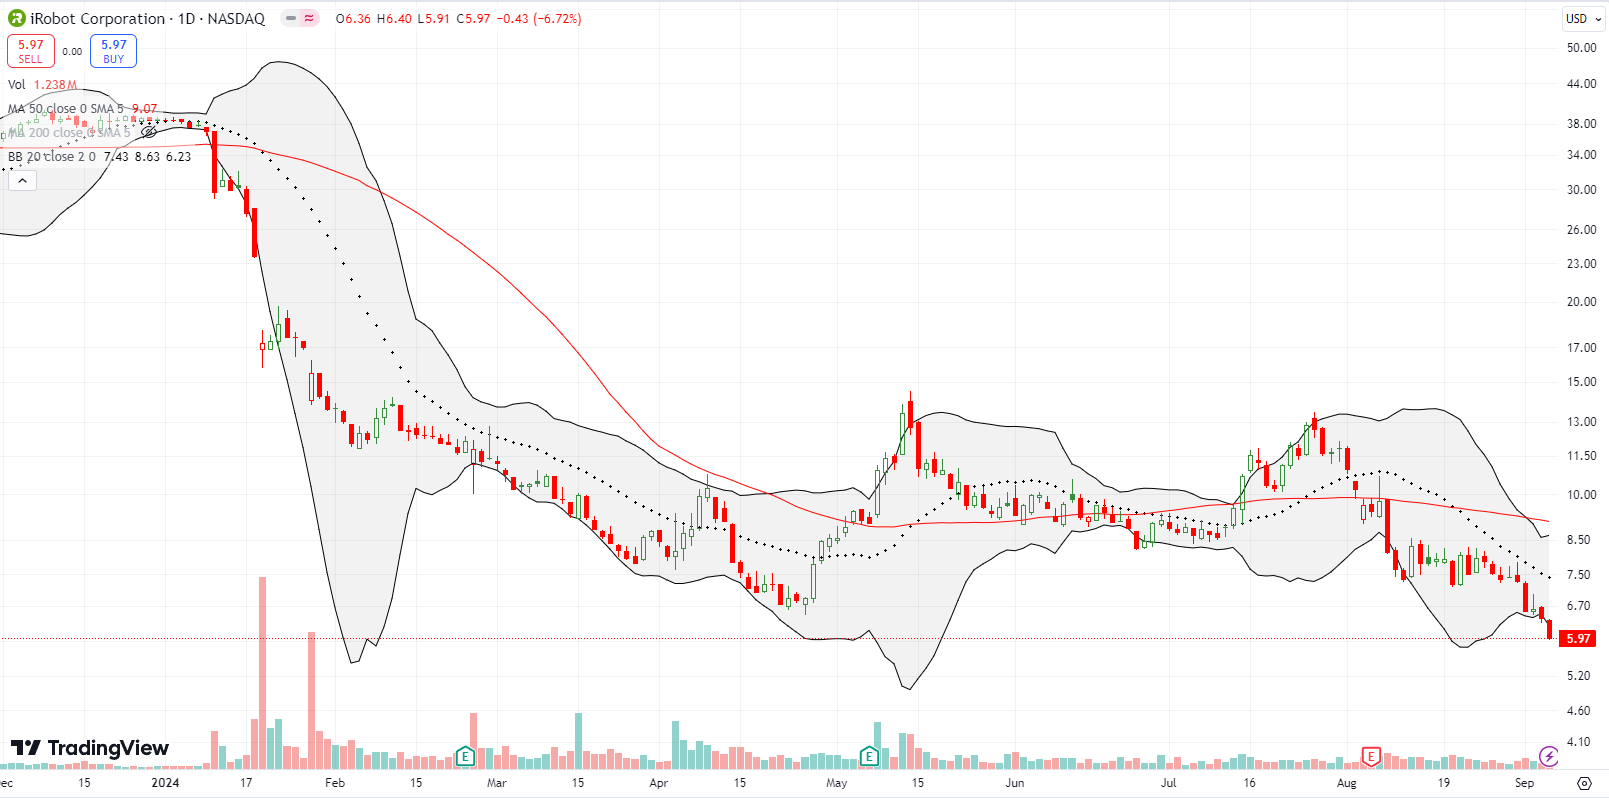
I was hopeful about a rebound for the iRobot Corporation (IRBT), but the stock disappointed. Now, the maker of the Roomba robot vacuum that Amazon.com (AMZN) left at the altar is making fresh all-time lows. I can only assume this company is imminently headed toward some kind of financial conclusion. I find it strange that AMZN was ever willing to pay so much more for IRBT than its current price. AMZN offered IRBT $61/hsare a little over 2 years ago. Regulatory pressures ultimately forced AMZN out of the deal.
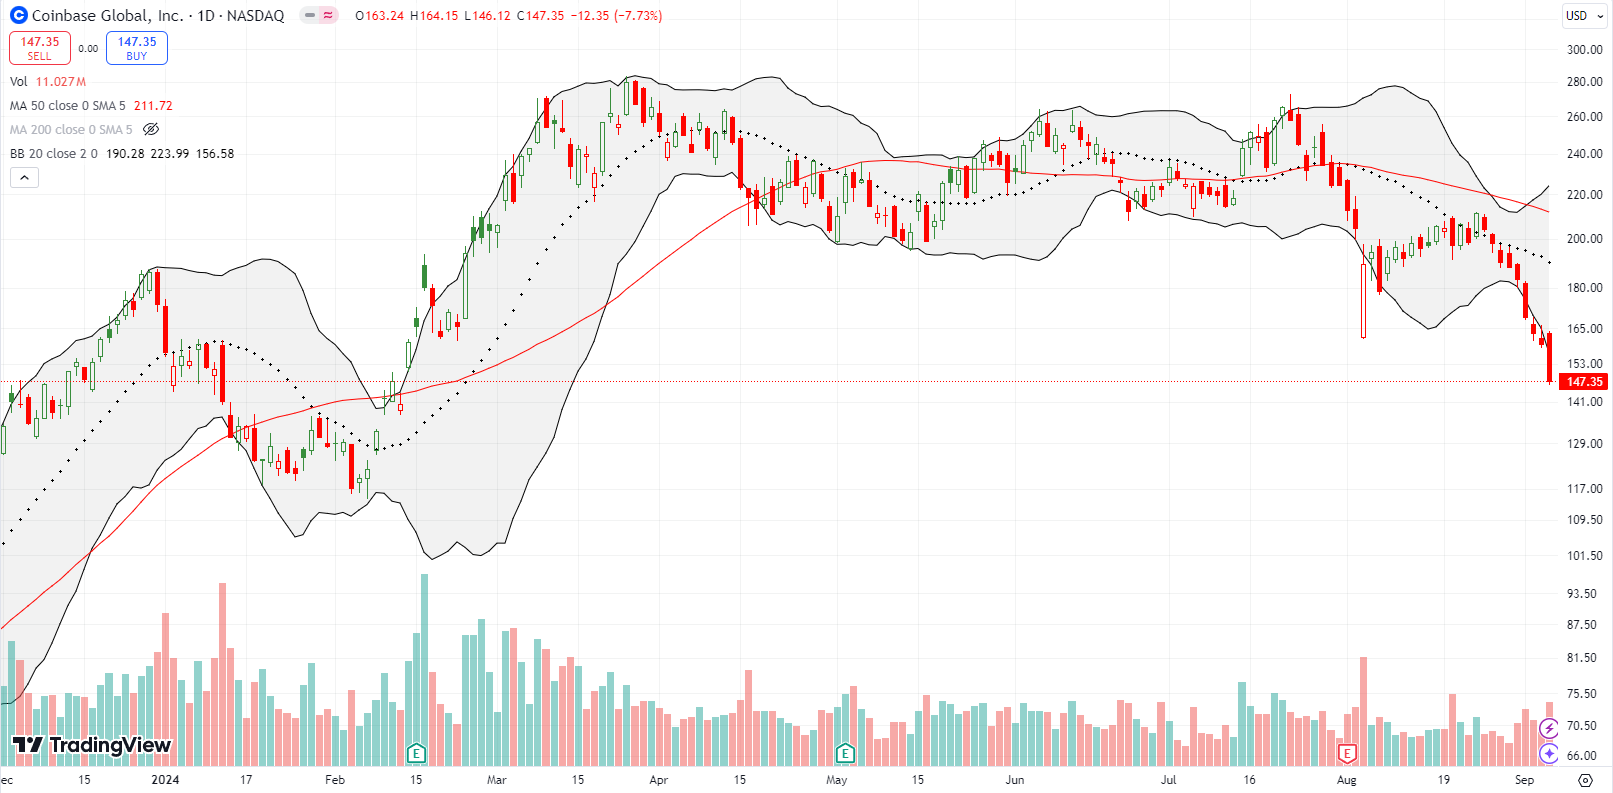
Cryptocurrency broker and platform Coinbase Global, Inc (COIN) has sold off for 2 weeks straight. I took profits on a small COIN short as it approached the August low. I got too cute and clever and quickly switched to a call spread; I have seen COIN magically and sharply rebound from earlier predicaments. Apparently not this time. Sellers have now pushed COIN to a 7-month low and a negative year-to-date performance.
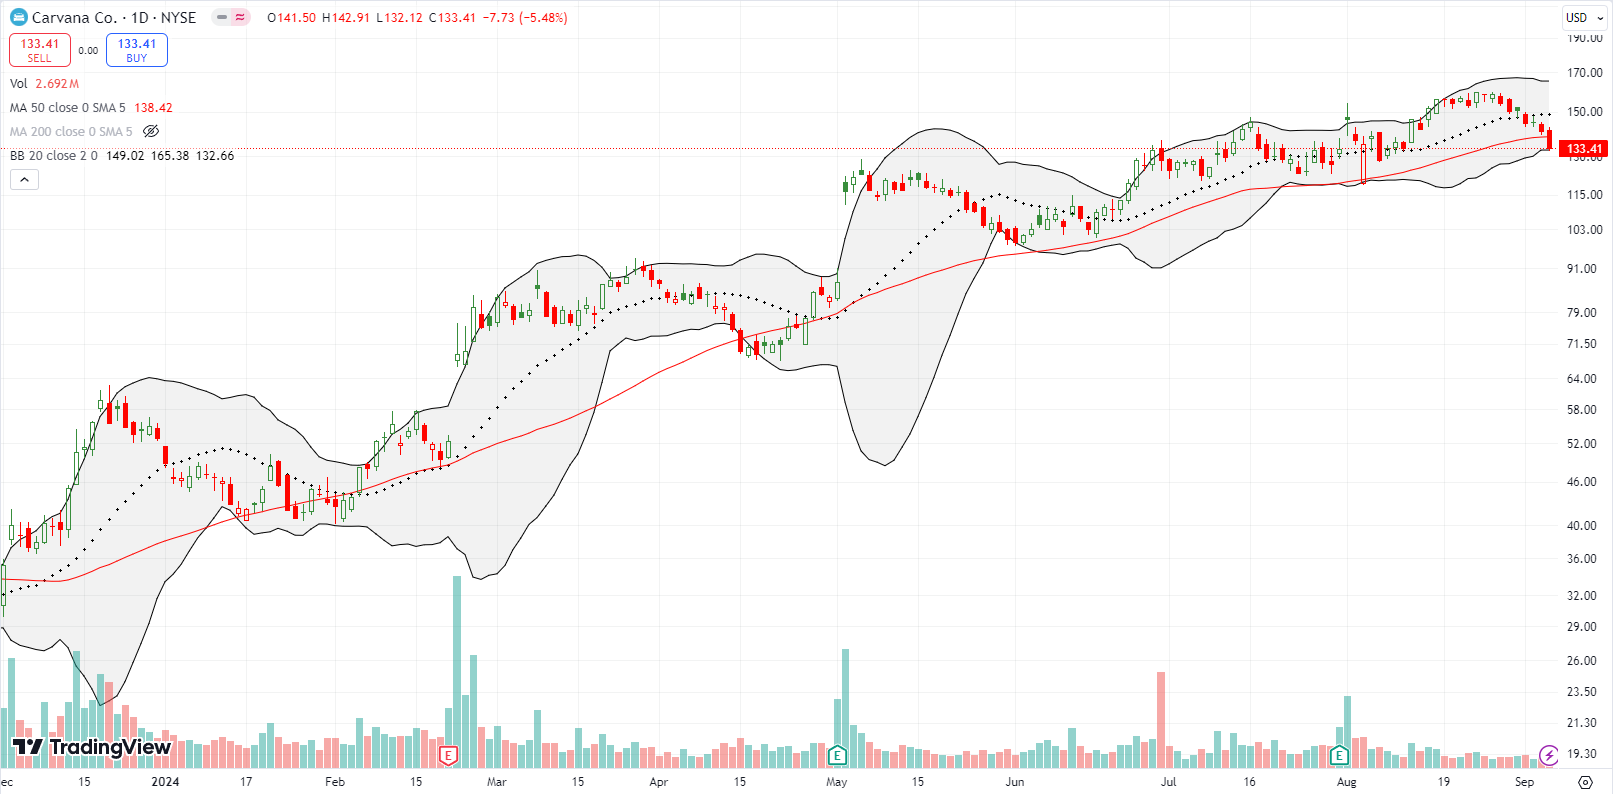
Online car retailer Carvana co. (CVNA) was in single-digit purgatory at the October, 2022 lows. The stock has defied gravity ever since. This year, CVNA has only closed below its 50DMA during three brief periods; last week was the third time. Given general market weakness, I went ahead and bought a put spread. If CVNA turns right around like it has done so many times, then a 50DMA breakout will be a freshly bullish event.
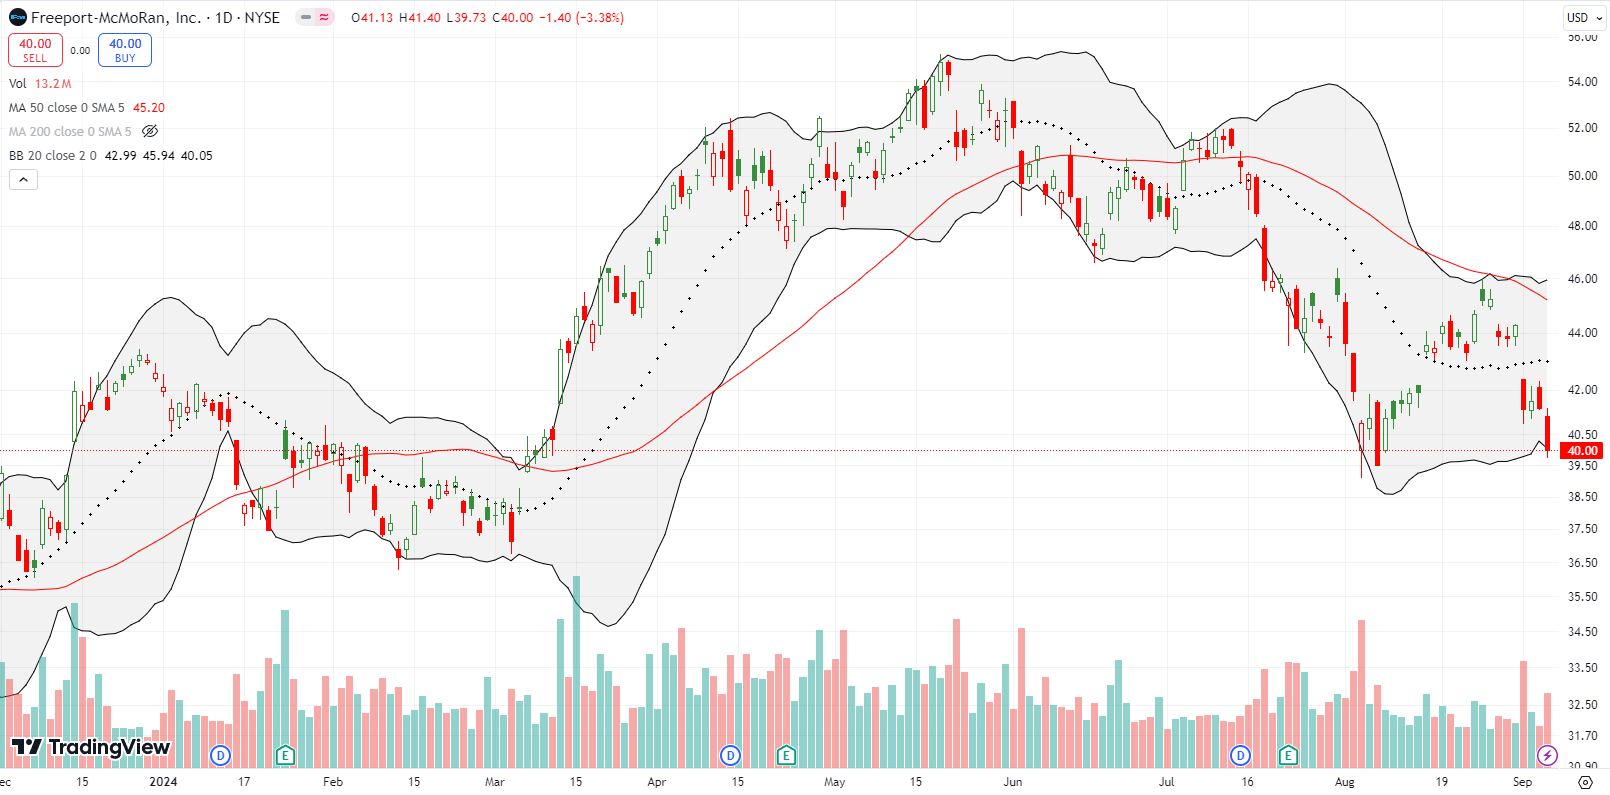
Rate cuts are coming yet commodities are not responding with the giddy anticipation as was seen in the general stock market. Copper miner and producer Freeport McMoRan, Inc (FCX) topped out in May. FCX is now down for the year after testing its August lows. At least inflation is truly looking dead…but is economic weakness coming to fill the space?
Be careful out there!
Footnotes
Subscribe for free to get email notifications of future posts!
“Above the 50” (AT50) uses the percentage of stocks trading above their respective 50-day moving averages (DMAs) to measure breadth in the stock market. Breadth defines the distribution of participation in a rally or sell-off. As a result, AT50 identifies extremes in market sentiment that are likely to reverse. Above the 50 is my alternative name for “MMFI” which is a symbol TradingView.com and other chart vendors use for this breadth indicator. Learn more about AT50 on my Market Breadth Resource Page. AT200, or MMTH, measures the percentage of stocks trading above their respective 200DMAs.
Active AT50 (MMFI) periods: Day #198 over 20%, Day #97 over 30%, Day #21 over 40% (overperiod), Day #1 under 50% (underperiod ending 15 days over 50%), Day #10 over 60%, Day #36 under 70%
Source for charts unless otherwise noted: TradingView.com
Full disclosure: long SPY put spread, long IWM shares, call spread, calls; long COIN call spread, long AKAM, long CVNA put spread, long VXX puts
FOLLOW Dr. Duru’s commentary on financial markets via StockTwits, Twitter, and even Instagram!
*Charting notes: Stock prices are not adjusted for dividends. Candlestick charts use hollow bodies: open candles indicate a close higher than the open, filled candles indicate an open higher than the close.


