Stock Market Commentary
Last month, the stock market seemed to conclude that the threat of inflation had all but disappeared. Given the resulting celebration is one of the key drivers of the current extended overbought rally, today’s report on December’s CPI (Consumer Price Index) took on some significance. So when CPI missed “expectations” on the ever so slight hot side, trigger fingers went to work selling. The resulting selling pressure briefly pushed market breadth out of overbought conditions. Buyers helped stocks narrowly avoid bearish conditions by igniting a rebound. The day ended mostly flat, exactly what I would expect for news that had little material meaning.
According to CNBC, “The consumer price index increased 0.3% in December and 3.4% from a year ago, compared with respective estimates of 0.2% and 3.2%…core CPI also rose 0.3% for the month and 3.9% from a year ago, compared with respective estimates of 0.3% and 3.8%.” Headlines blared across news sites about how inflation came in stronger or hotter than expected. Without confidence bands on these “expectations”, the numbers are just fodder for headlines and trading bots.
The Stock Market Indices
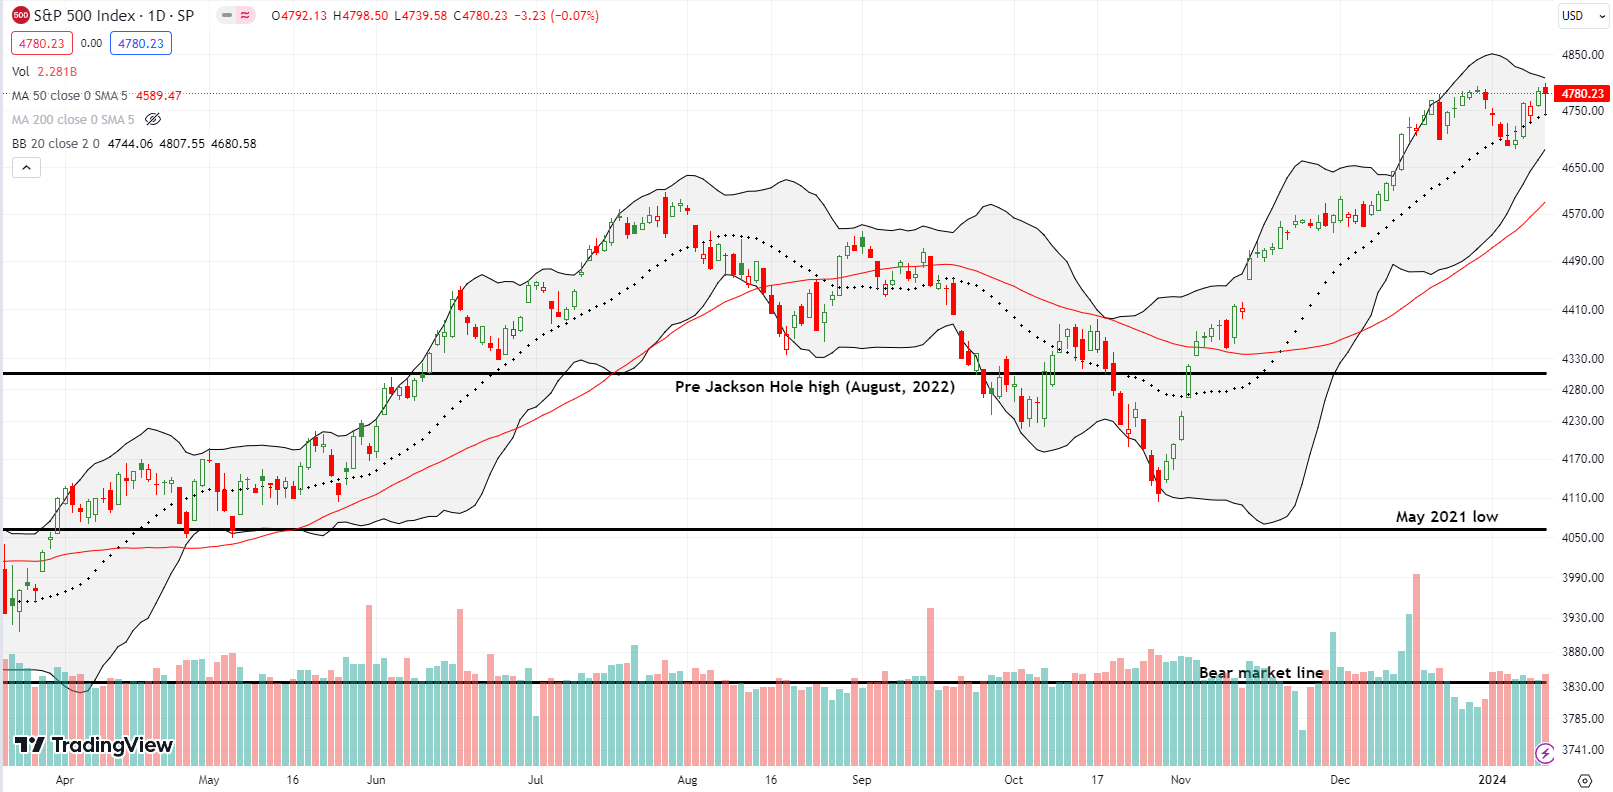
The S&P 500 (SPY) started the week below its 20-day moving average (DMA) (the dotted line) but rushed out the gate with a 1.4% gain. Thursday’s CPI report brought the index back to that uptrending support. From there, buyers promptly sent the S&P 500 right back up to challenge last year’s high. The S&P 500 is within “inches” of a fresh breakout. I am still holding my SPY calendar call spread.
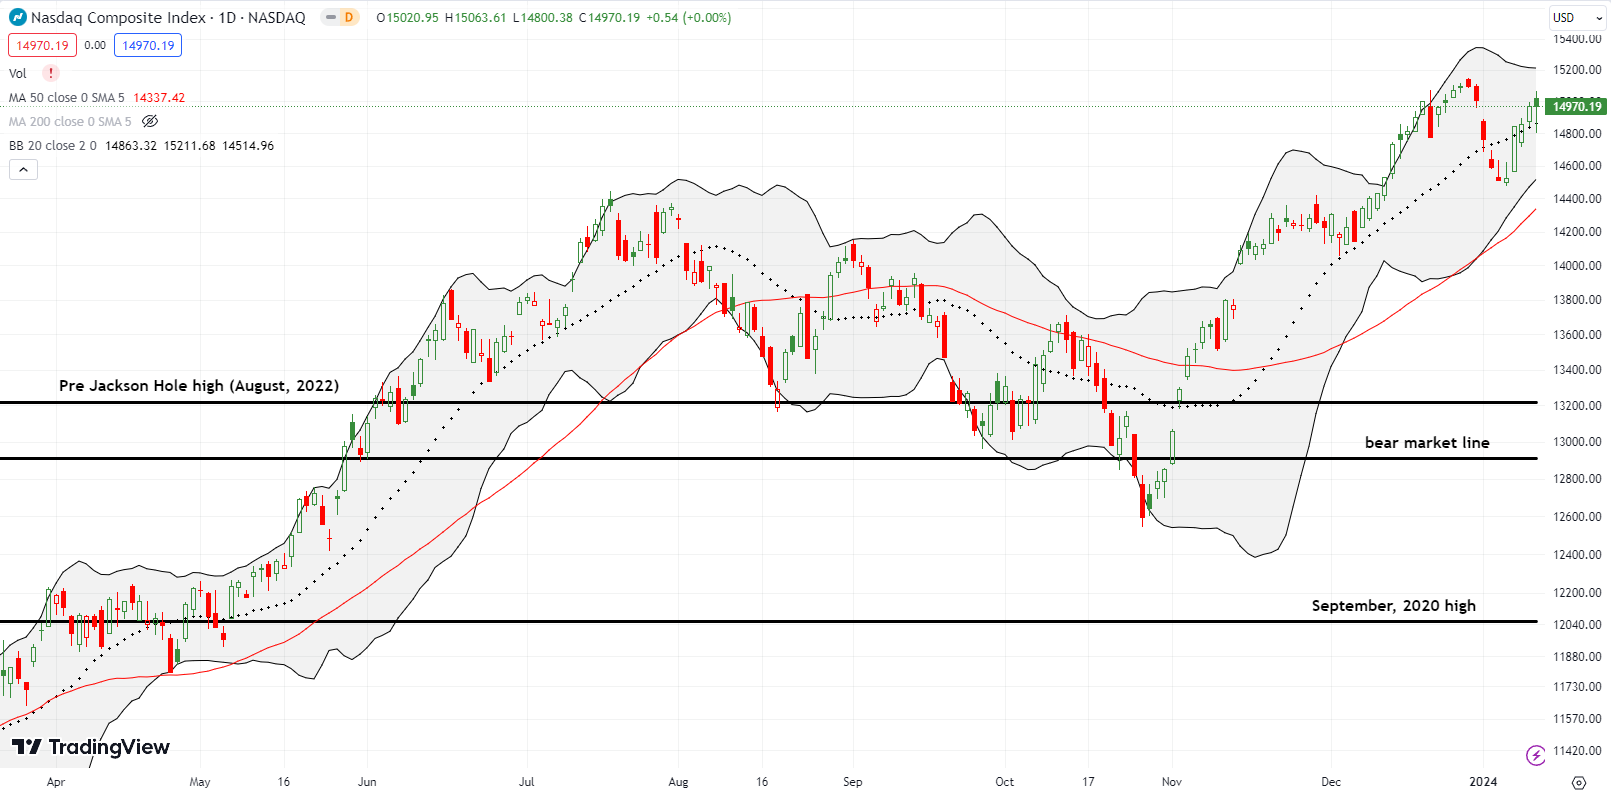
The NASDAQ (COMPQ) printed its own intraday rebound away from 20DMA support. However, it started the week in much more trouble than the S&P 500. The tech laden index was well below its 20DMA and had finished reversing its mid-December breakout. Buyers promptly took the NASDAQ higher by 2.2% on Monday and have barely looked back since.
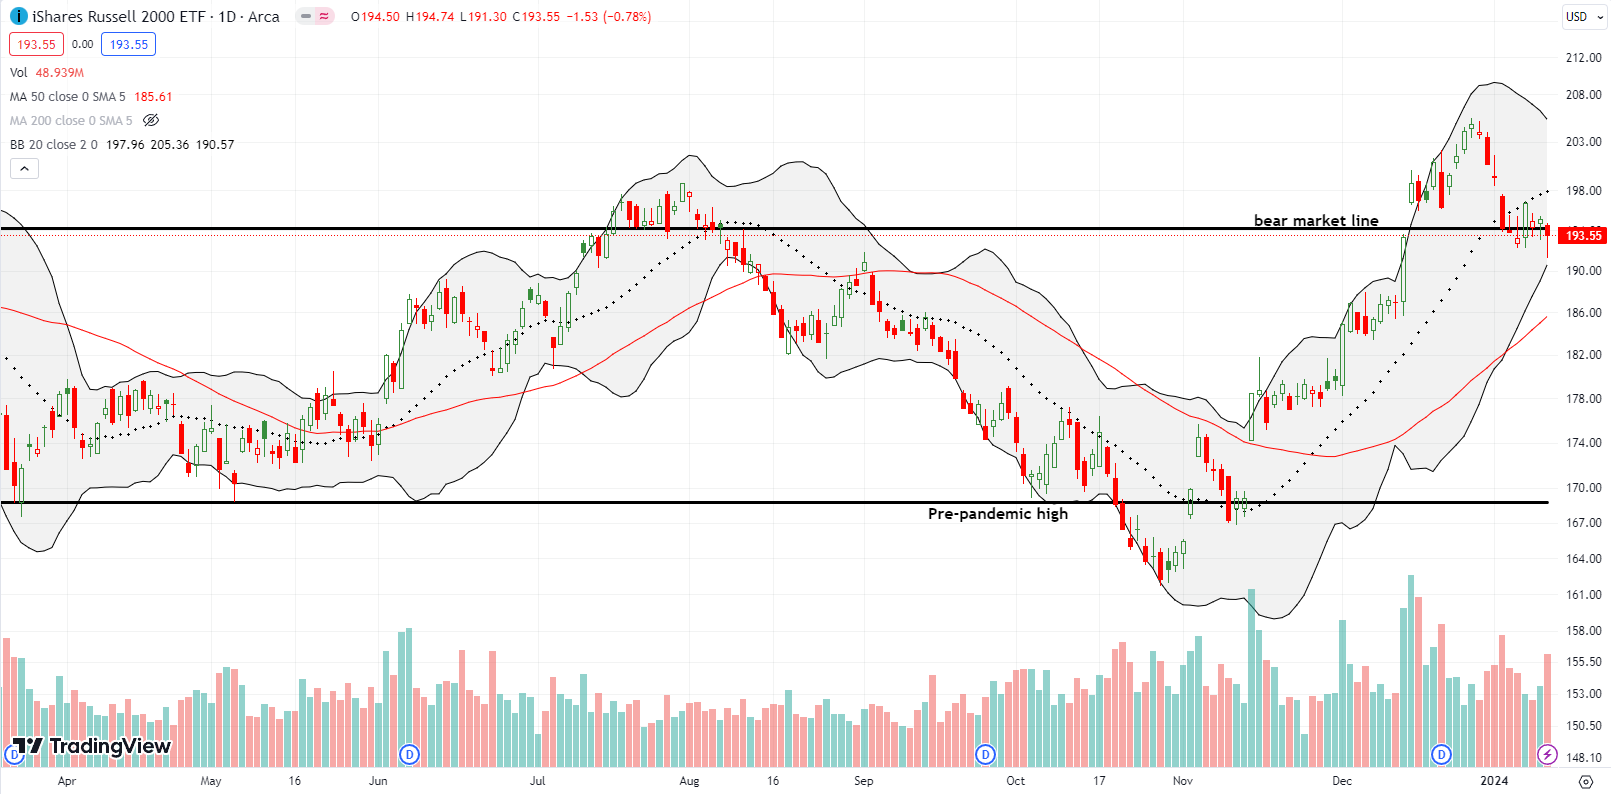
The tension continues to build on the iShares Russell 2000 ETF (IWM). The ETF of small caps just keeps pivoting around its bear market line. IWM has narrowly avoided confirming a return to bear market territory. On Thursday, buyers picked IWM up from a 1-month intraday low. Needless to say, the long side of my IWM call spread will expire worthless on Friday. Monday’s 1.8% pop left me expecting follow-through like the other major indices. Instead, 20DMA resistance held firm on IWM.
The Short-Term Trading Call After Stocks Narrowly Avoid Trouble
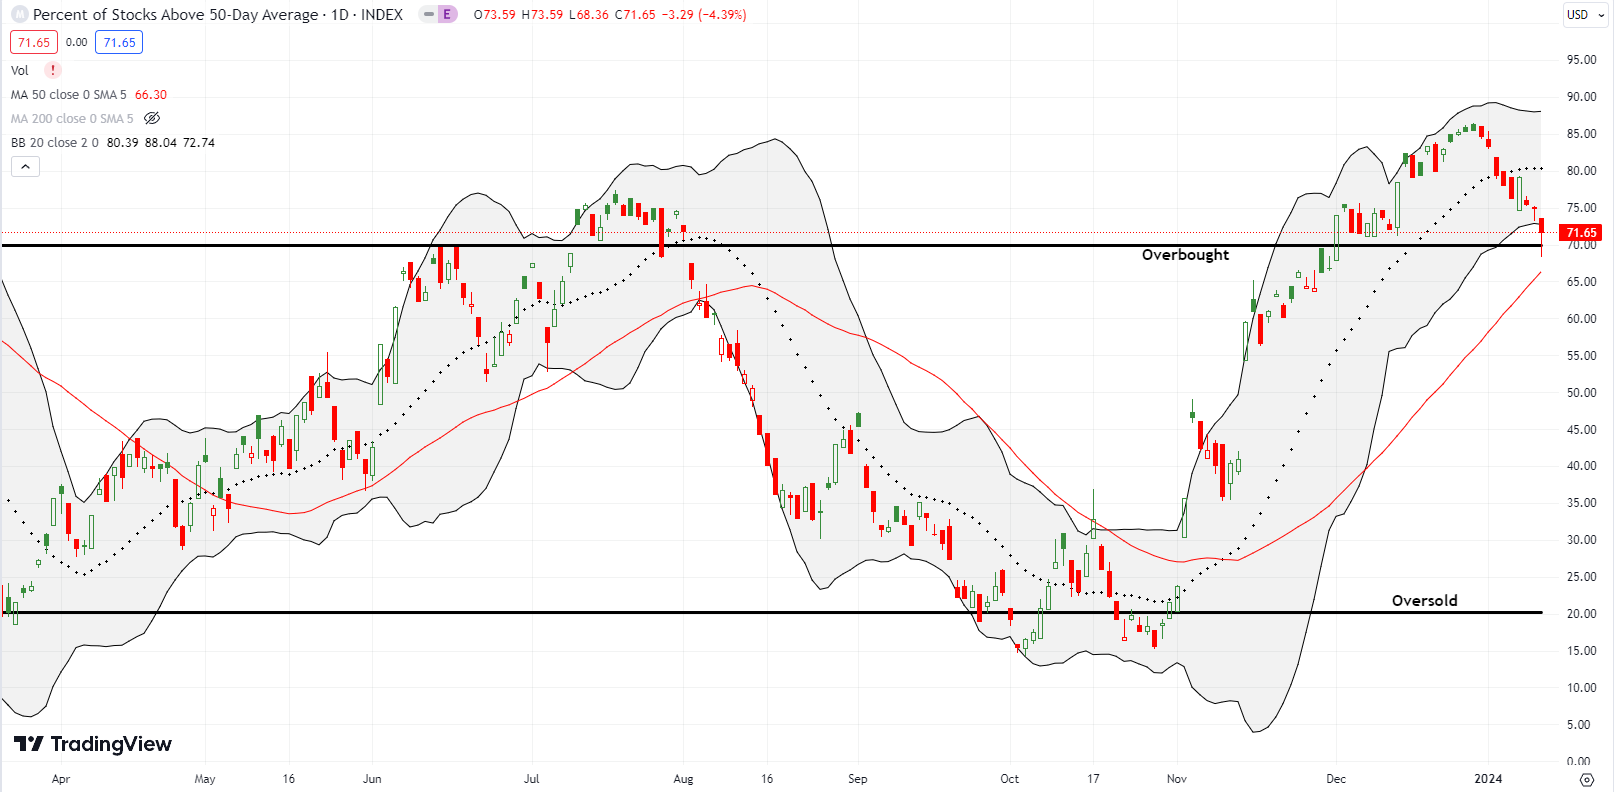
- AT50 (MMFI) = 71.7% of stocks are trading above their respective 50-day moving averages (28th overbought day)
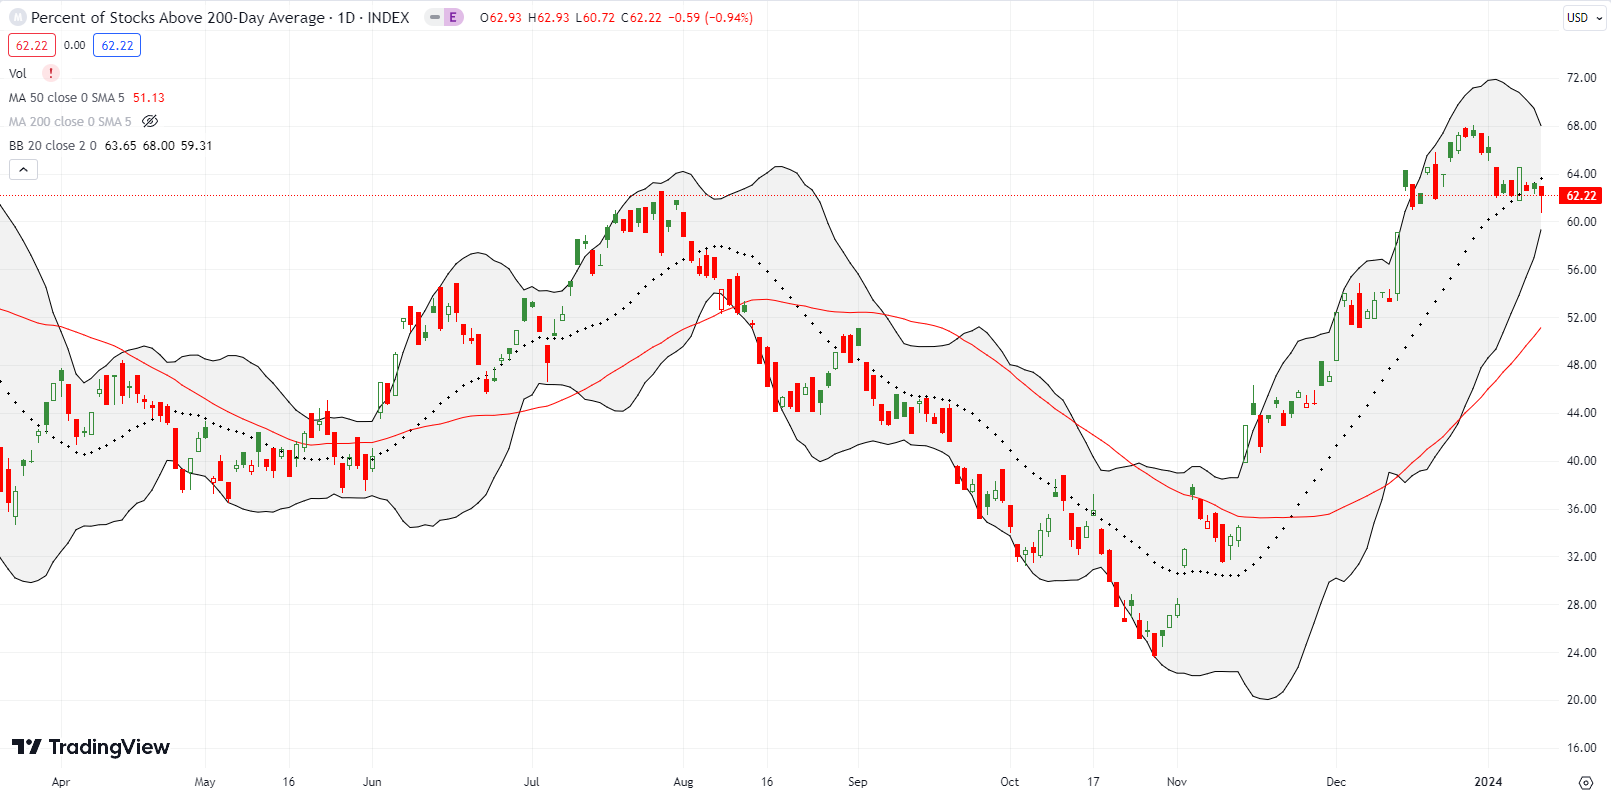
- AT200 (MMTH) = 62.2% of stocks are trading above their respective 200-day moving averages
- Short-term Trading Call: neutral
AT50 (MMFI), the percentage of stocks trading above their respective 50DMAs, closed at 71.7% after briefly breaking down below the overbought threshold of 70%. My favorite technical indicator took its cue from the initial selling of stocks in reaction to the December CPI report. Although AT50 narrowly avoided tripping my rules for flipping bearish, the current downtrend has unfolded nearly unabated for the entire (short) year. This trend ominously suggests overbought conditions will end by next week.
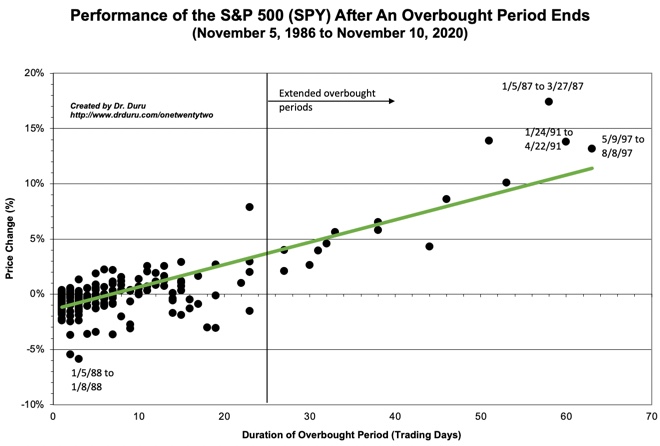
At 28 days long, this overbought period is officially in rarefied territory. Per the chart below, very few overbought periods have lasted longer. If overbought conditions ended today, the S&P 500 would have a 4.0% gain for the overbought period. This performance would be in-line with expectations (the green line in the chart below). This 4.0% cushion also nearly guarantees the S&P 500 will exit the overbought period with a gain, again, as expected per historical performance. The scenario of the S&P 500 continuing higher even as AT50 declines and drops below the 70% threshold is one of the scenarios I described in the last Market Breadth post. Accordingly, a bearish divergence is emerging, and I am hunting more and more put options.
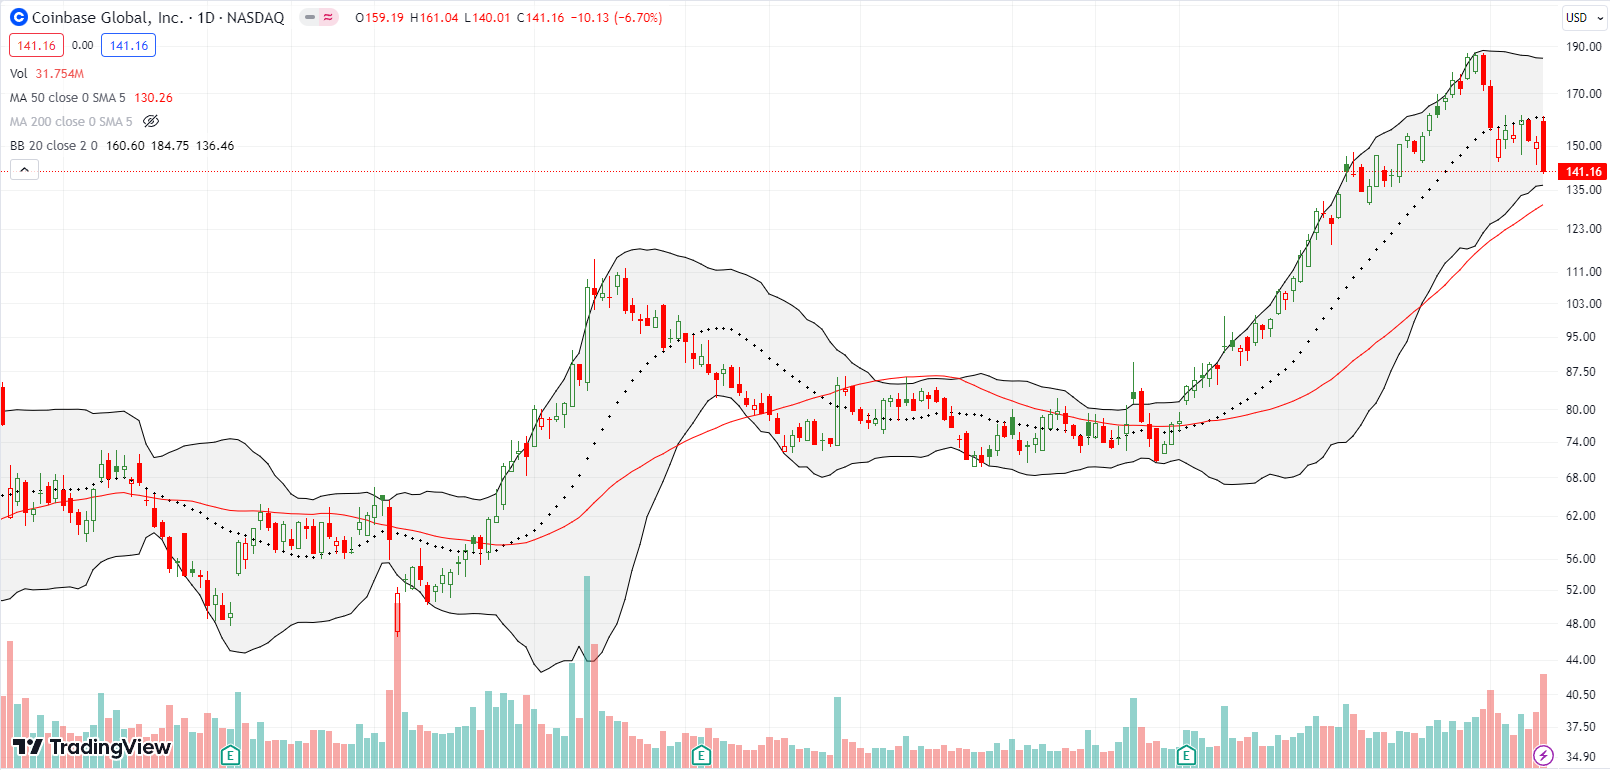
This week’s drama in cryptocurrencies captured market headlines. First, the SEC’s twitter account was compromised by an unauthorized post announcing the approval of Bitcoin (BTC/USD) ETFs. The muted response from markets was a prelude to the “sell-the-news” reaction once the SEC made an official approval announcement on Wednesday, January 10th (see “Statement on the Approval of Spot Bitcoin Exchange-Traded Products“). Bitcoin jumped on the news and then promptly faded. The following trading day, crypto-related stocks followed suit by first gapping higher and then sharply fading. Coinbase Global, Inc (COIN) gapped higher right into 20DMA resistance before ending the day with a 6.7% loss. I came into the event expecting a sell the news reaction with a put spread targeting COIN to test its 50DMA support by the end of next week.
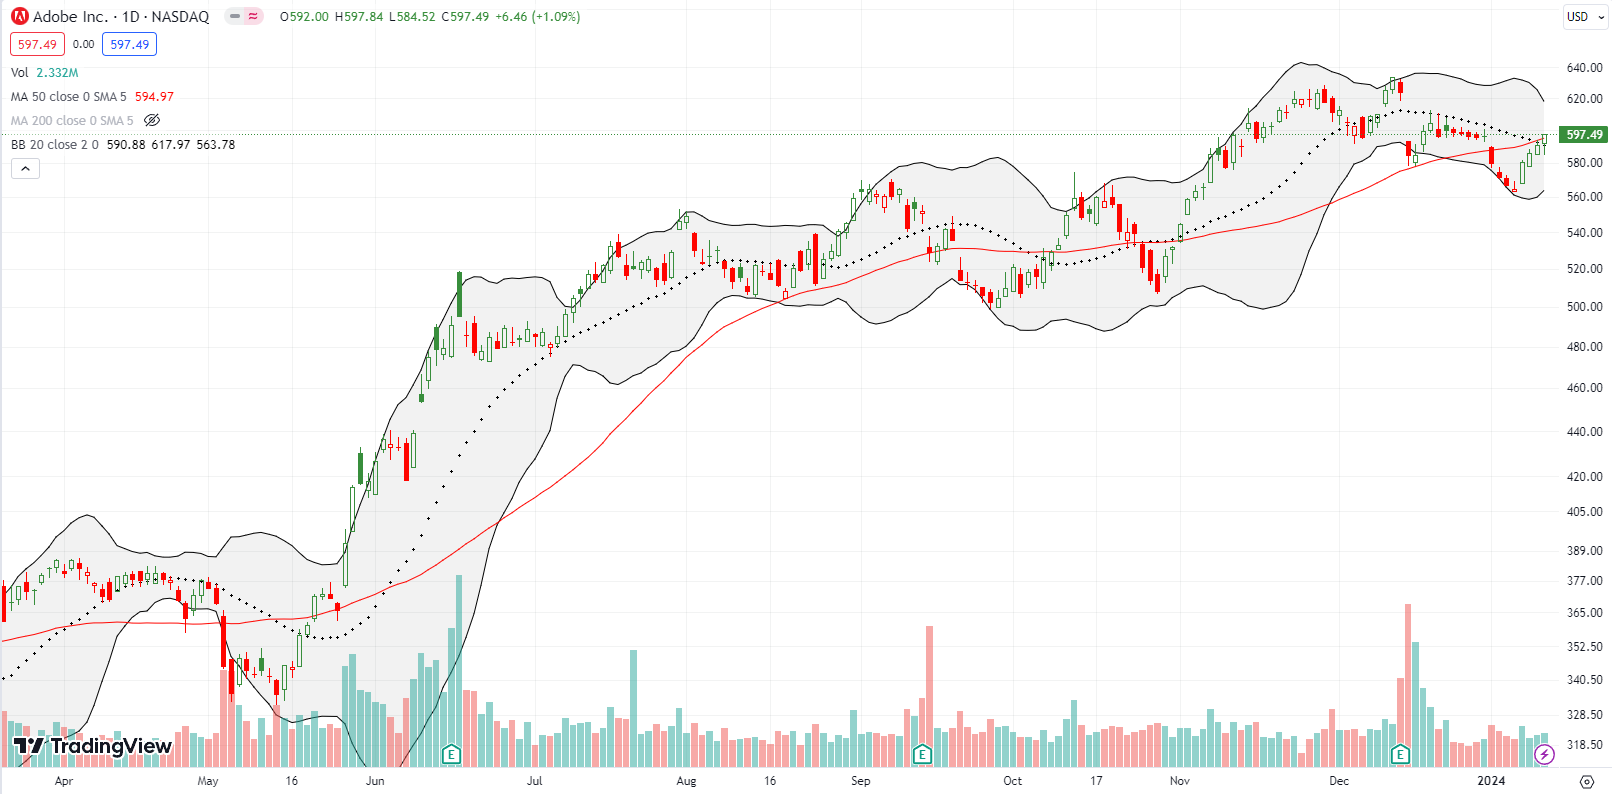
I earlier highlighted the bearish breakdown in Adobe Inc (ADBE). The stock promptly moved higher every day this week. With my put spread worthless, I jumped into a fresh one after ADBE flashed a failure at converged 20DMA and 50DMA (the red line) resistance. The stock market’s rebound helped ADBE narrowly avoid the bearish setup. ADBE reversed right through both points of resistance. I decided to just hold the spread as a necessary hedge on bullish positions given overbought conditions look in danger.
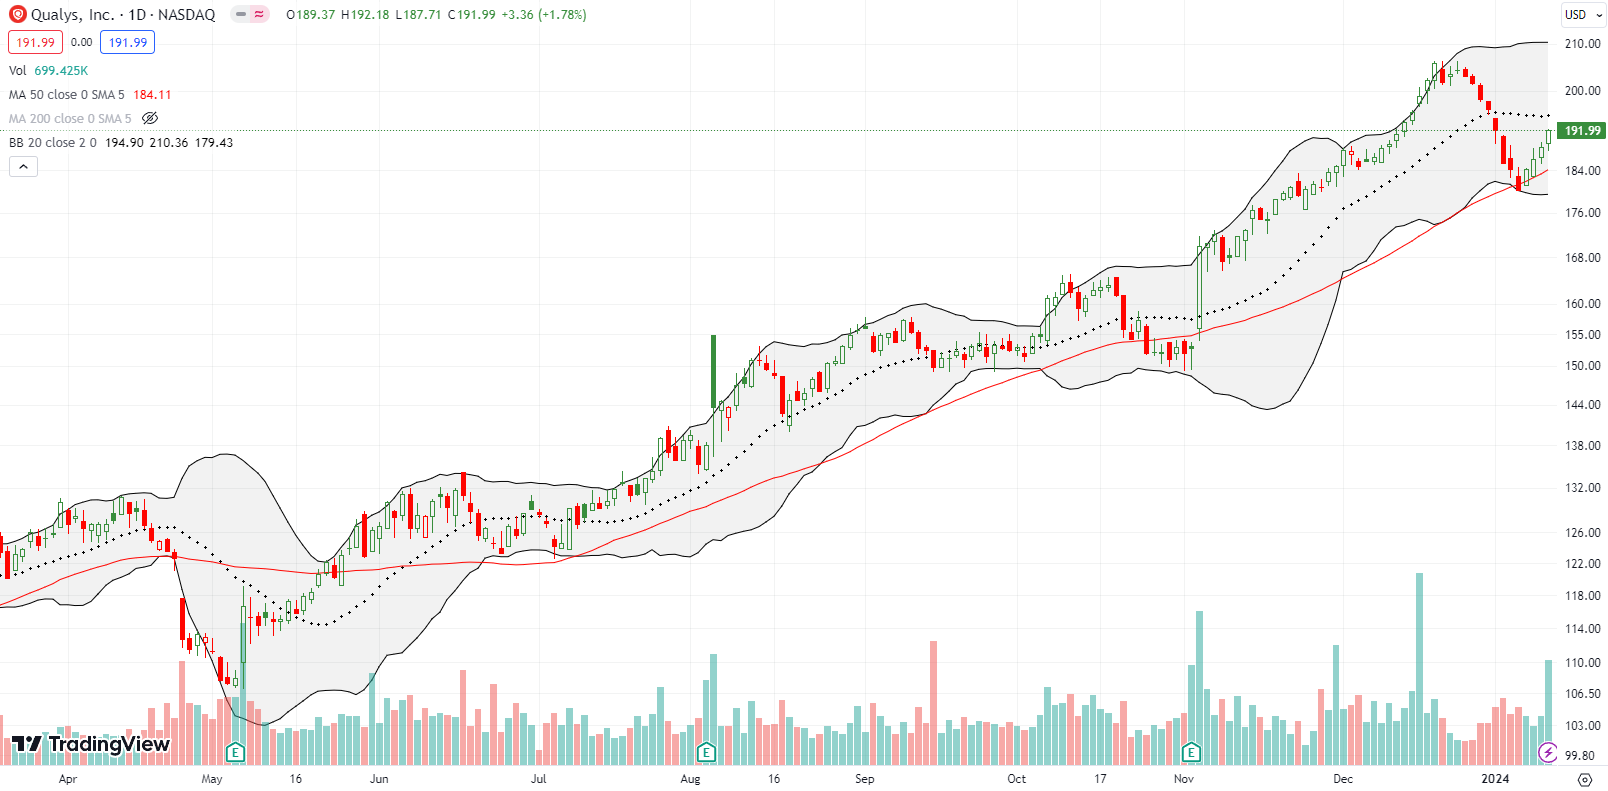
In my last Market Breadth post, I pointed out the precarious position of cybersecurity software company Qualys, Inc (QLYS) as it teetered on 50DMA support. QLYS narrowly avoided a bearish 50DMA breakdown as buyers successfully defended that support line. I decided to buy some shares, and I plan to accumulate shares for a long-term position. This decision means I will be more tolerant of the downside compared to a short-term or swing trade.
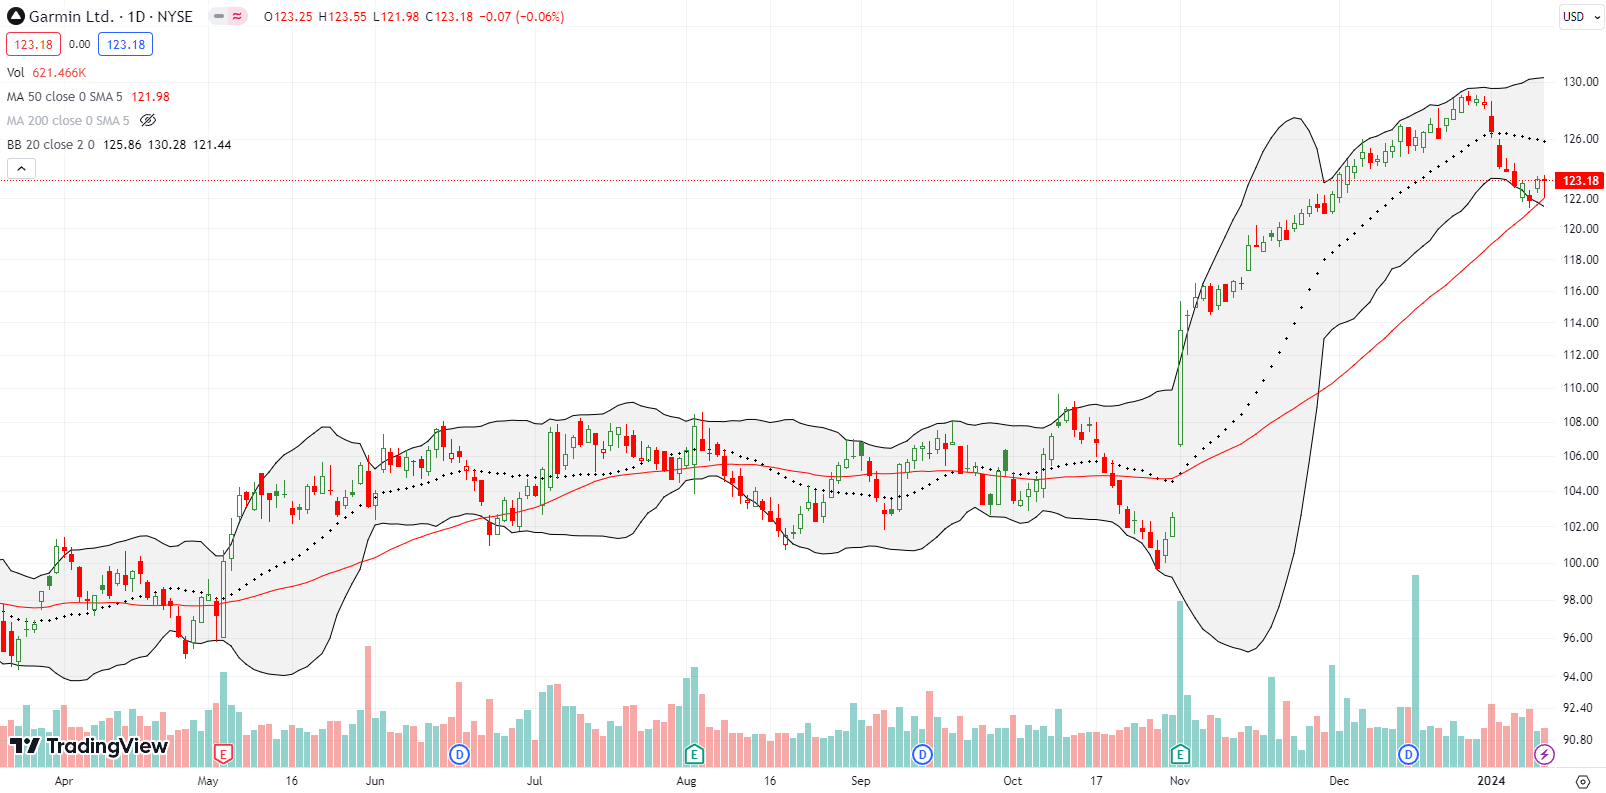
Garmin, Ltd (GRMN) narrowly avoided its own bearish 50DMA breakdown. The stock jumped away from support twice in the last three trading days. I have been watching GRMN for over two months and never felt comfortable just jumping into the middle of the steady drip higher. Buying at this point provides a (presumed) support for the technical setup.
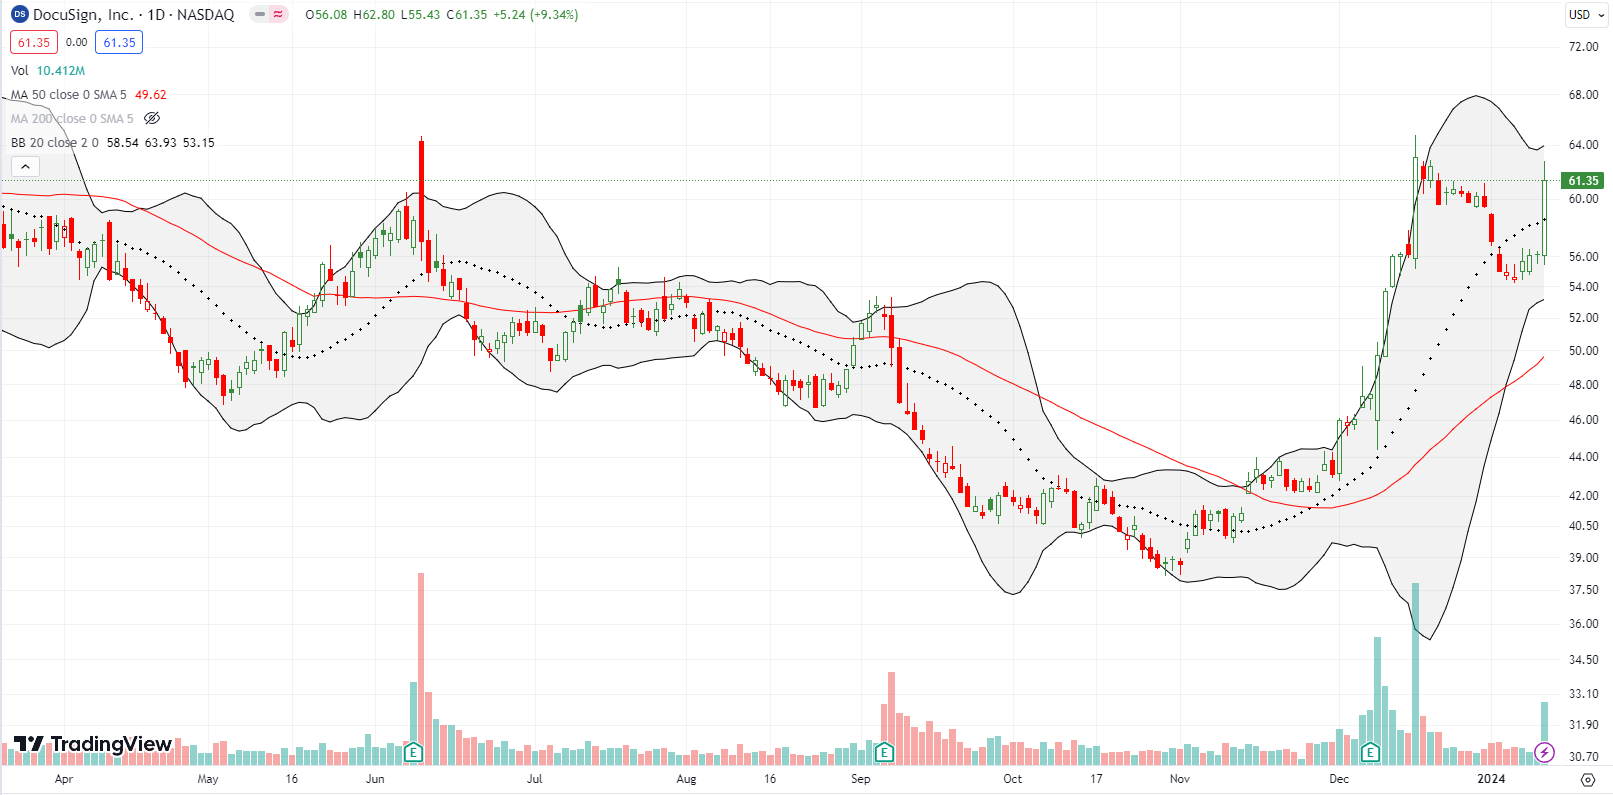
DocuSign, Inc (DOCU) seems to be the latest software company that could catch the eye of eager acquirers. DOCU jumped 9.3% on rumors the company wants to sell itself. This surge reminds meof the treacherous road ahead for bears fading beaten up tech stocks. Even the day’s gain, DOCU still only trades at a “cheap” 4.7 price/sales ratio.
Be careful out there!
Footnotes
Subscribe for free to get email notifications of future posts!
“Above the 50” (AT50) uses the percentage of stocks trading above their respective 50-day moving averages (DMAs) to measure breadth in the stock market. Breadth defines the distribution of participation in a rally or sell-off. As a result, AT50 identifies extremes in market sentiment that are likely to reverse. Above the 50 is my alternative name for “MMFI” which is a symbol TradingView.com and other chart vendors use for this breadth indicator. Learn more about AT50 on my Market Breadth Resource Page. AT200, or MMTH, measures the percentage of stocks trading above their respective 200DMAs.
Active AT50 (MMFI) periods: Day #45 over 20%, Day #43 over 30%, Day #41 over 40%, Day #40 over 50%, Day #37 over 60%, Day #28 over 70% (28th day overbought)
Source for charts unless otherwise noted: TradingView.com
Full disclosure: long COIN put spread, long QLYS, long GRMN, long SPY call spread
FOLLOW Dr. Duru’s commentary on financial markets via StockTwits, Twitter, and even Instagram!
*Charting notes: Stock prices are not adjusted for dividends. Candlestick charts use hollow bodies: open candles indicate a close higher than the open, filled candles indicate an open higher than the close.


Leading indicator CNN Fear and Greed Index flipped from Extreme Greed to Greed on January 2nd, same day as lagging indicator MACD crossunder. Flat 10-DMA crossing with rising 20-DMA. However, no Supertrend sell signal, and RSI is flat.
As of 12/13, the S&P hasn’t risen as much as it did the months beforehand, so sold some stocks that weren’t contributing to the portfolio. Yammered about the switch on the blog, but still no definitive sell signal. Keep up the posts!
The sell signal is getting close! BUT I think the overall pullback will be shallow and well-supported by the 50DMAs if it gets that far. The market is still giddily anticipating the first rate cut…which is still scheduled for March according to Fed fund futures. That will be a moment for sell the news or MAJOR disappointment.
Doc, why do you like QLYS in cybersecurity? any thoughts on NET? CRWD?
I love the technicals in QLYS. I also have a cousin who has her own IT security consultancy, and she likes QLYS.
I like NET and CRWD from what I hear on financial TV, but the technicals aren’t as good. CRWD is testing all-time highs so it needs a breakout.
I asked my cousin about CRWD and NET. CRWD is at the top of the EDR space. NET is at the top of DDOS mitigation, cloud cybersecurity networks. She is much more excited by CRWD than NET.