Stock Market Commentary:
The bulls were right at the frontier of overbought trading. The threshold defining overbought market breadth held firm and punched sentiment out of bullish territory. While this development is typically bearish, the summer of loving stocks still has uptrends supporting the potential for buying dips at moving averages. This is a time to go neutral and watch how sentiment and price dynamics unfold.
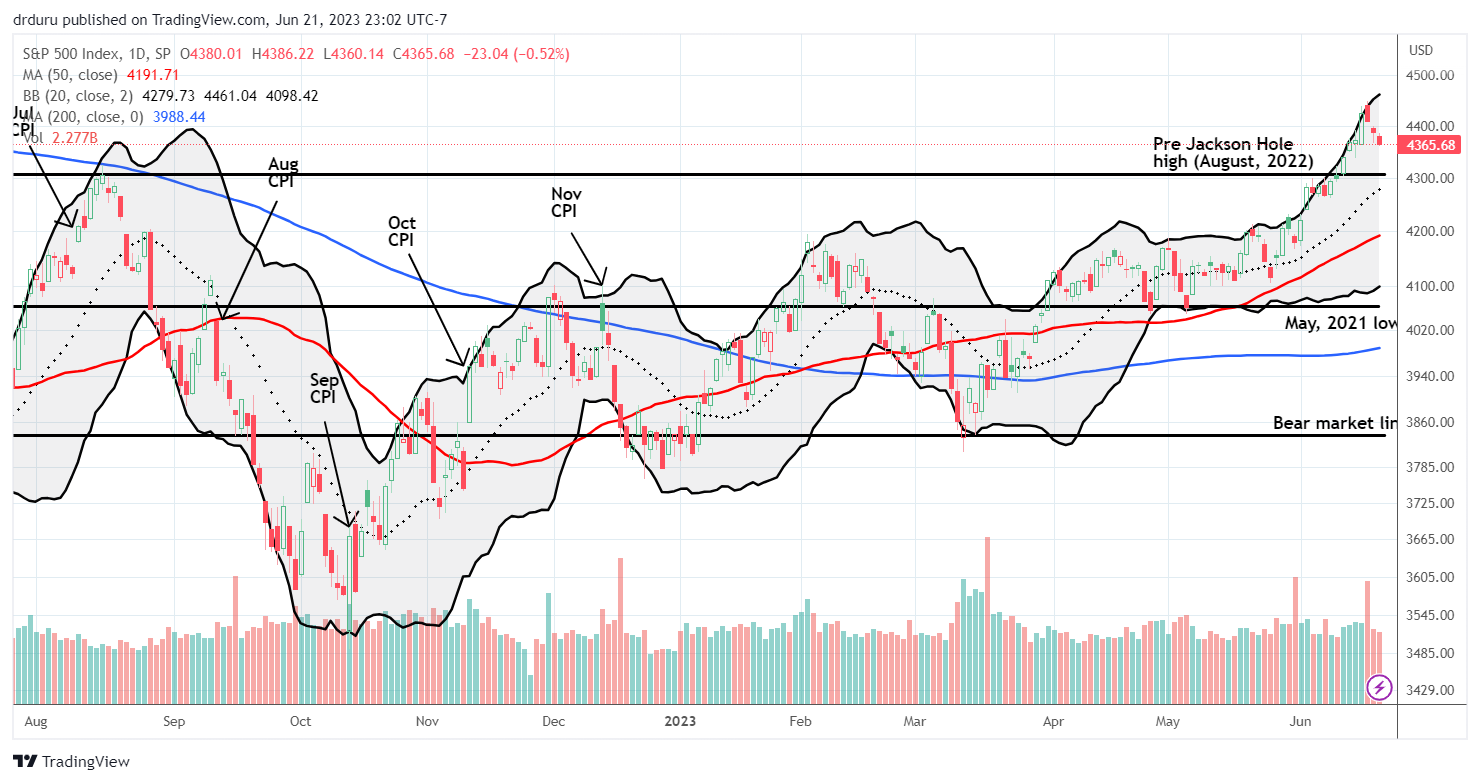
Perhaps fittingly, this third day of selling finished reversing last week’s post Fed gains just as Powell delivered testimony that reiterated everything the market should already know about the Fed’s hawkishness. Post-Fed trading is so often tricky exactly because of the number of fades that can happen. Recall that the market initially sold down on the release of the Fed’s statement on monetary policy. Buyers took over from there until Friday’s open exhausted them. The S&P 500 and the NASDAQ are clinging to the post-Fed intraday low as support.
The Stock Market Indices
The S&P 500 (SPY) looks ready for a test of converging support from its uptrending 20-day moving average (DMA) and the last high before Powell’s slam at 2022’s Jackson Hole confab for central bankers. Three straight days of selling perfectly reversed all the index’s post-Fed gains. Reversals of the initial post-Fed response are typical, but I thought buyers might power through given the size of Thursday’s gain (1.2%). Now, the summer of loving stocks has its first real test.
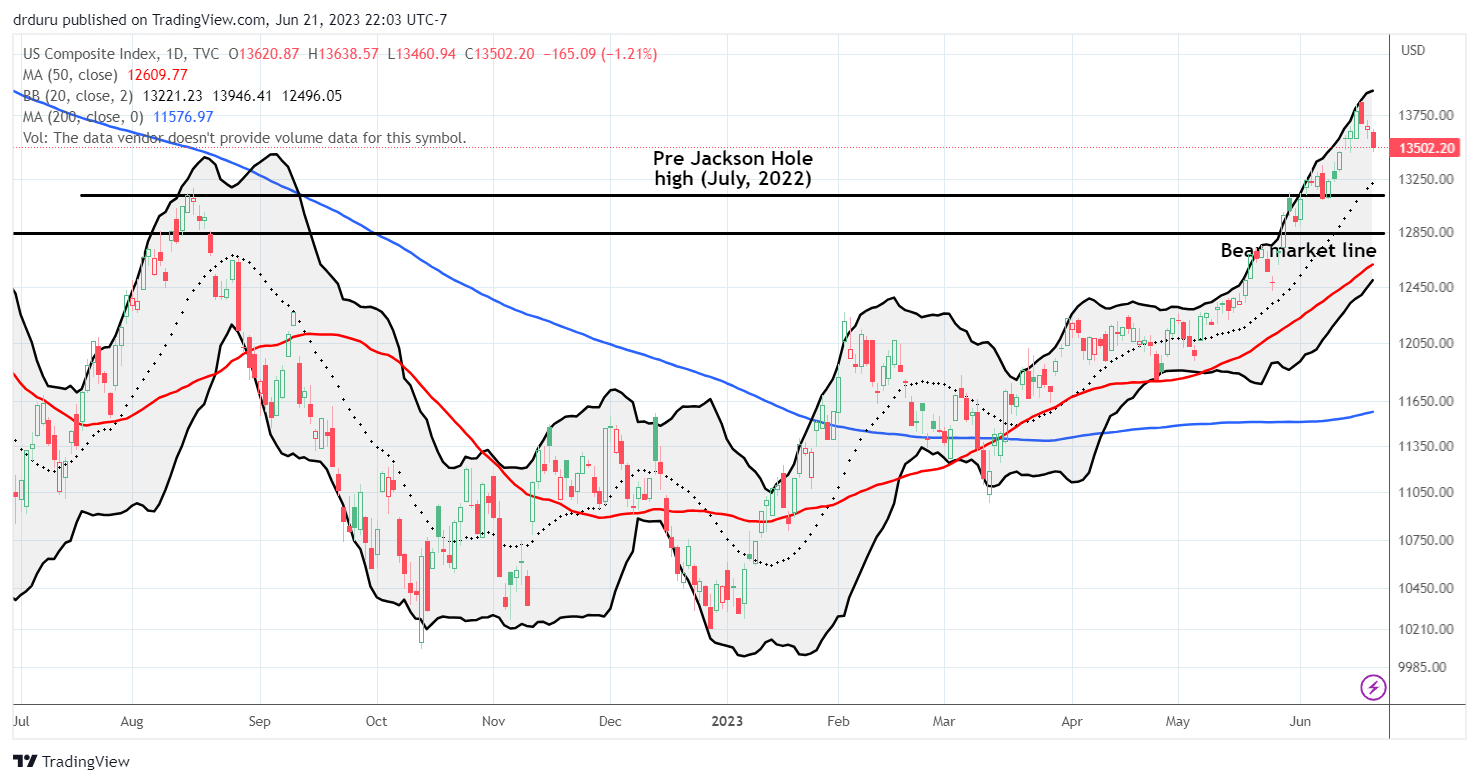
The NASDAQ (COMPQ) is now negative post-Fed. Three straight days of selling have taken the tech-laden index back to last Monday’s close. The NASDAQ looks ready to test its 20DMA support. After that, the NASDAQ has multiple layers of potential technical support with the convergence of the 50DMA (red line) and the bear market line being the most important.
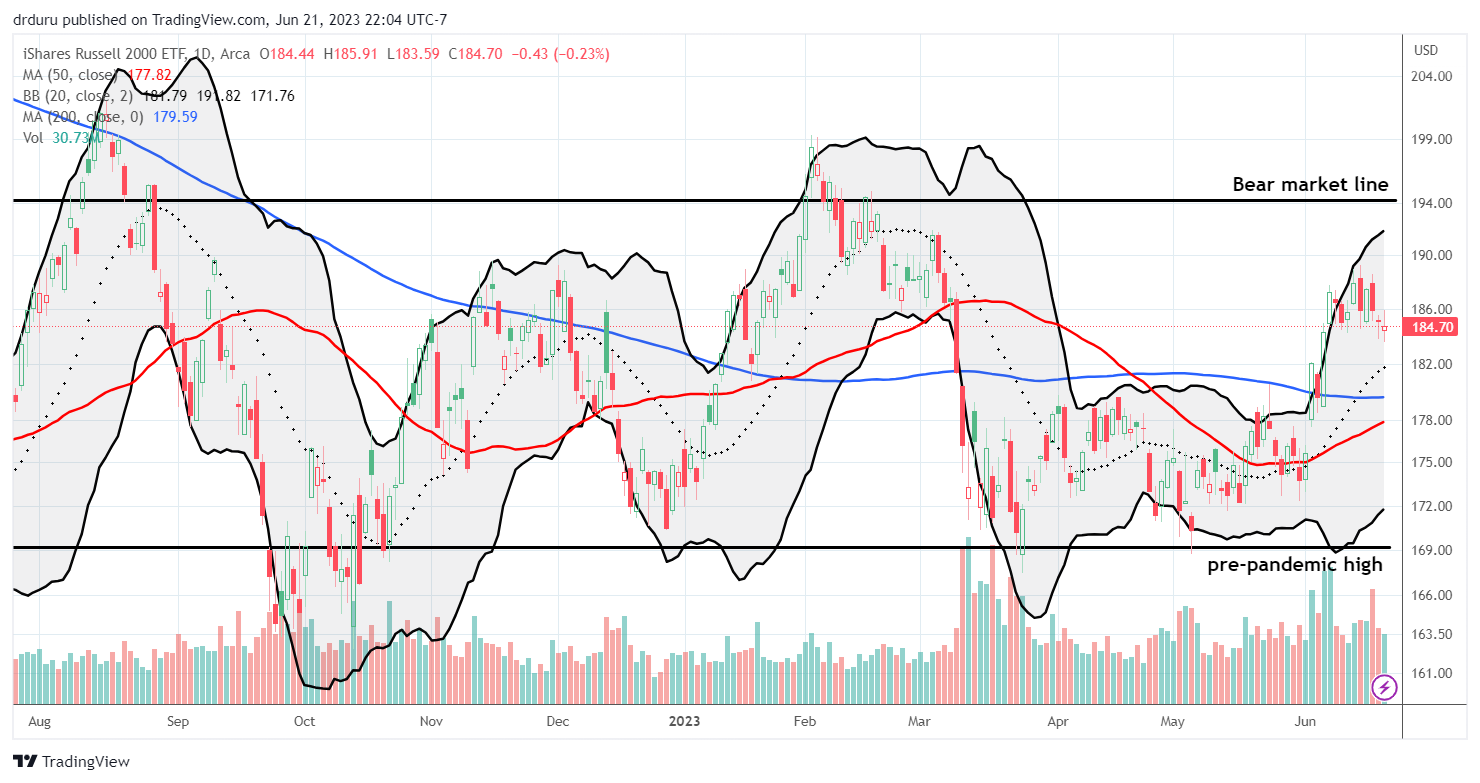
The iShares Russell 2000 ETF (IWM) looks tired. While this week’s losses are minimal they are enough to punch the ETF of small caps below the previous consolidation range. The resulting toppiness makes IWM look ready to test support at any and maybe all of its moving averages waiting below.
Stock Market Volatility
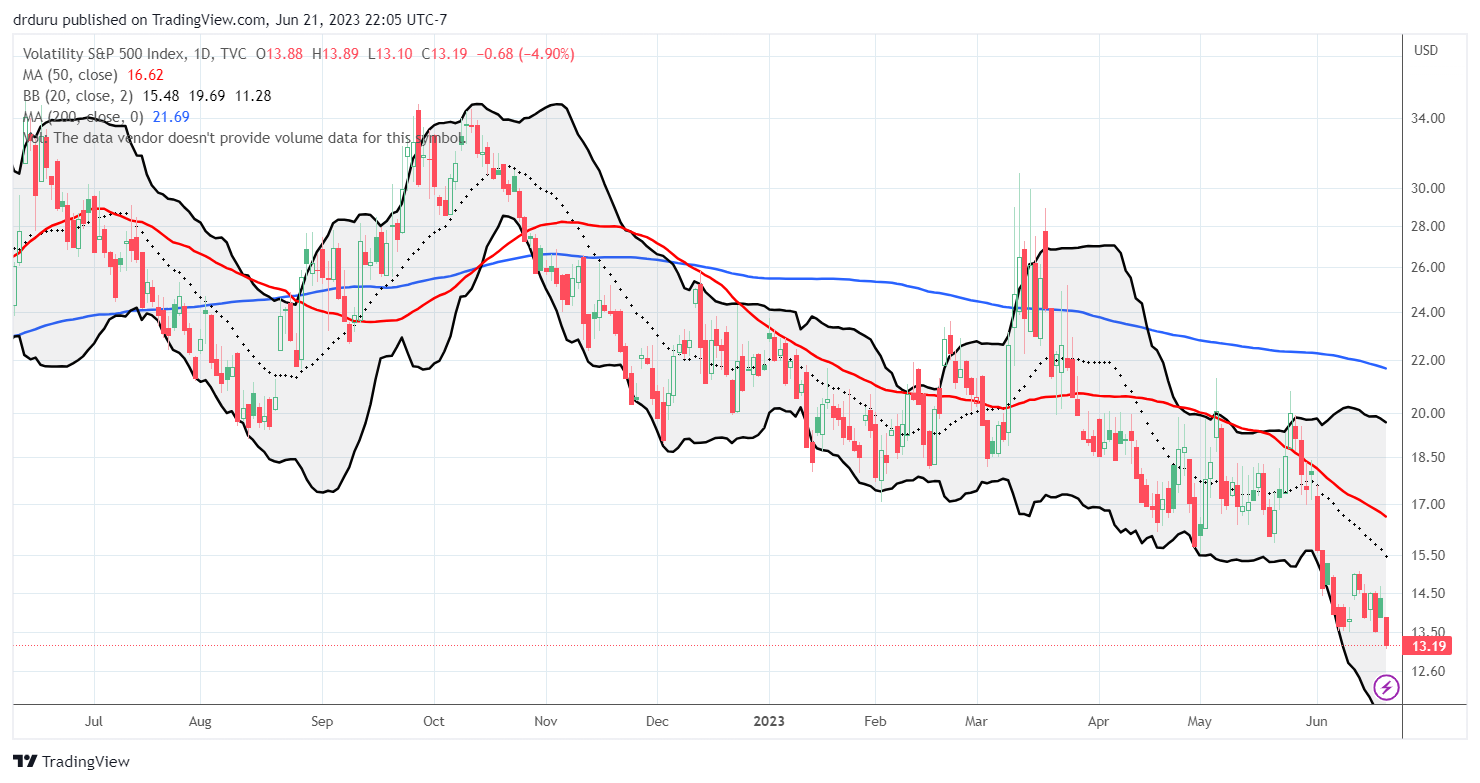
The volatility index (VIX) is just broken. While this week’s selling and failure to punch through the overbought threshold raised my alarm bells, volatility faders continued to win the day over the VIX. Today, the VIX lost 4.9% for a fresh 3+ year low. When the stock market was knocking on the overbought threshold, the lower VIX looked like support for bullishness. Now, the VIX just looks disconnected…and disinterested.
The Short-Term Trading Call In Neutral
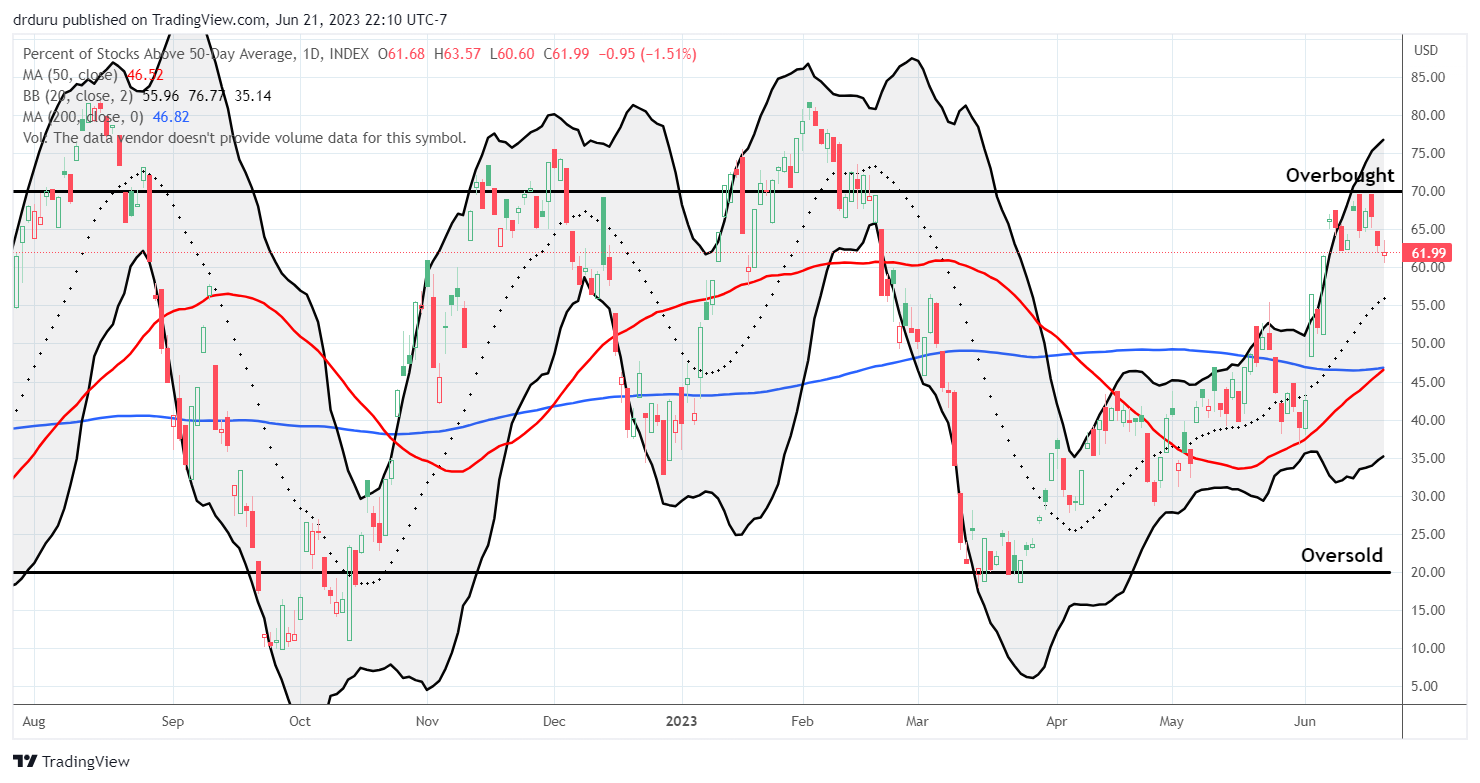
- AT50 (MMFI) = 62.0% of stocks are trading above their respective 50-day moving averages
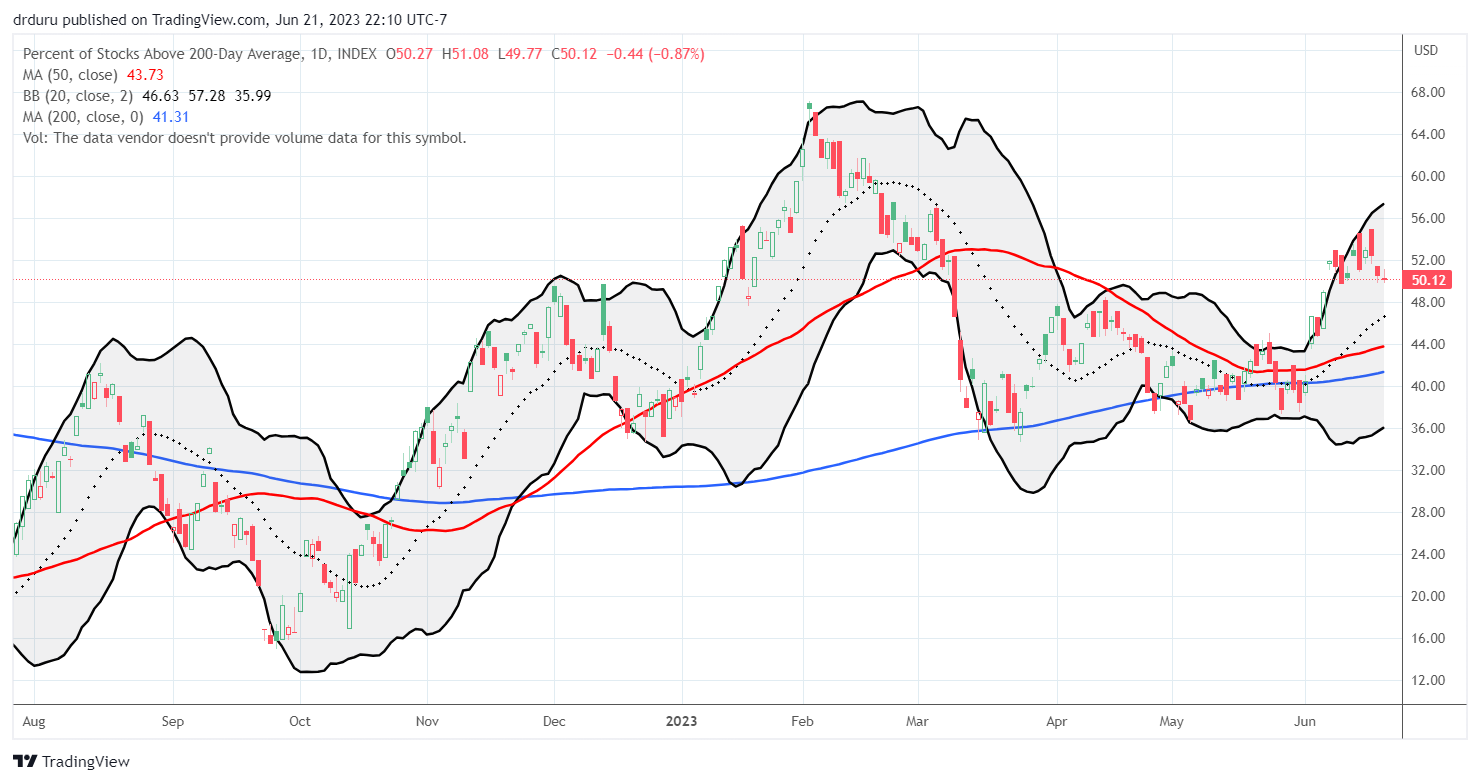
- AT200 (MMTH) = 50.1% of stocks are trading above their respective 200-day moving averages
- Short-term Trading Call: neutral
AT50 (MMFI), the percentage of stocks trading above their respective 50DMAs, gave up its attempt to break into overbought territory. Today’s close at 62.0% created a second lower close after my favorite technical indicator last failed at the overbought threshold (70%). By rule, I should swing my short-term trading call to bearish. However, the summer of loving stocks looks intact until uptrending moving averages give way as support. So as a compromise I shifted the short-term trading call into neutral. I make this change reluctantly because I will not be able to flip bullish again until the stock market next gets oversold.
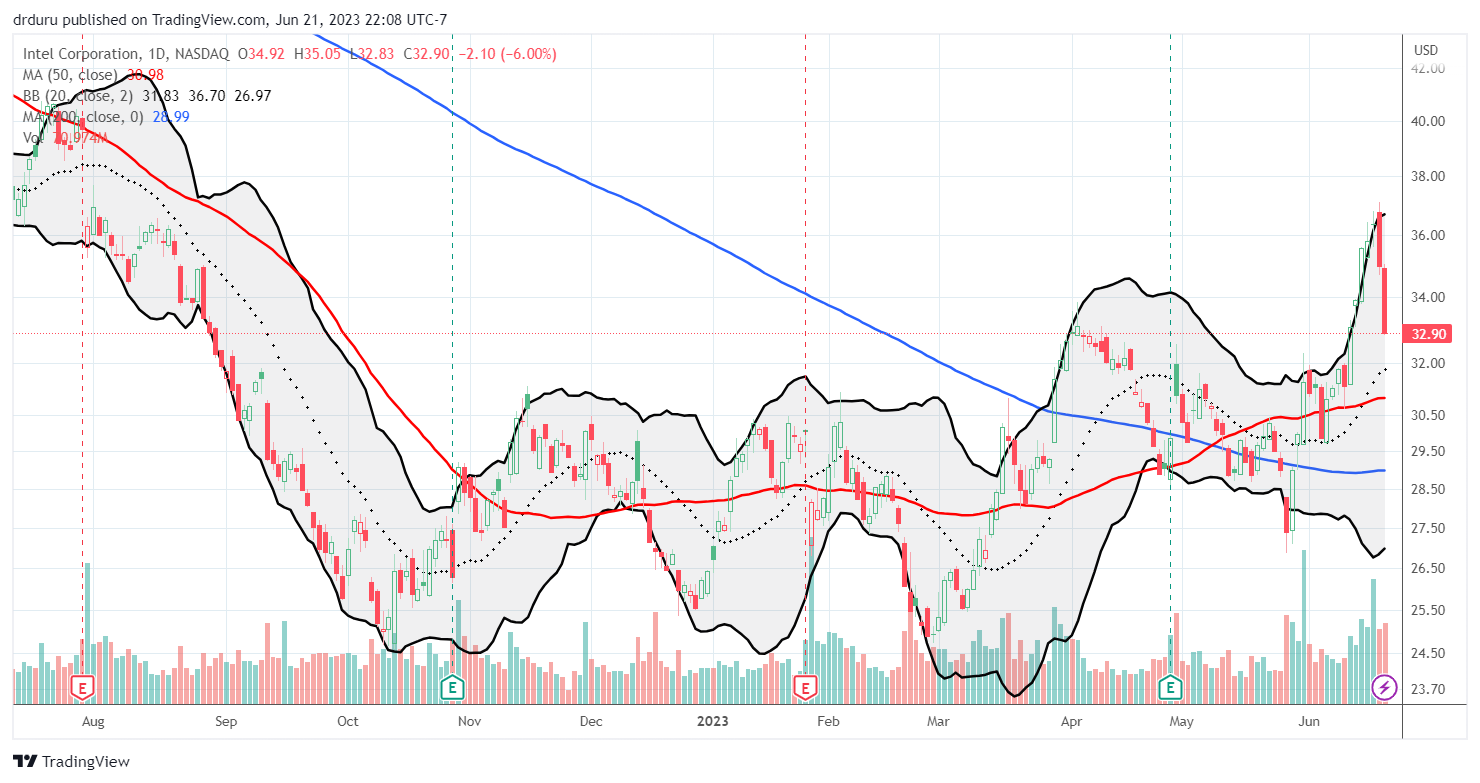
Intel Corporation (INTC) sure has had a lot of drama this year! Just when I thought the stock was regaining favor, it plunges on news that, on the surface, sounded like a good development (see “Intel Agrees to Sell Minority Stake in IMS Nanofabrication Business to Bain Capital“). Suddenly, last week’s breakout looks like a fakeout. Two days of sharp selling (-3.8% and -6.0%) took INTC below its April high and brought the breakout to a sharp and abrupt end. Tuesday’s selling was a prelude, like someone sniffed out the coming negative reaction to Intel’s announcement. Despite the carnage, I am eyeing INTC for a between earnings trade. I have given up on trading the stock several times this year only to see it surge away from me. I want to avoid a repeat.
Be careful out there!
Footnotes
Subscribe for free to get email notifications of future posts!
“Above the 50” (AT50) uses the percentage of stocks trading above their respective 50-day moving averages (DMAs) to measure breadth in the stock market. Breadth defines the distribution of participation in a rally or sell-off. As a result, AT50 identifies extremes in market sentiment that are likely to reverse. Above the 50 is my alternative name for “MMFI” which is a symbol TradingView.com and other chart vendors use for this breadth indicator. Learn more about AT50 on my Market Breadth Resource Page. AT200, or MMTH, measures the percentage of stocks trading above their respective 200DMAs.
Active AT50 (MMFI) periods: Day #57 over 20%, Day #31 over 30%, Day #28 over 40%, Day #14 over 50%, Day #11 over 60%, Day #82 under 70%
Source for charts unless otherwise noted: TradingView.com
Full disclosure: long QQQ call spread, long IWM call spread
FOLLOW Dr. Duru’s commentary on financial markets via StockTwits, Twitter, and even Instagram!
*Charting notes: Stock prices are not adjusted for dividends. Candlestick charts use hollow bodies: open candles indicate a close higher than the open, filled candles indicate an open higher than the close.


With ^VIX broken we need some other real-time indicator of US market angst. AUS/JPY has been a helpful risk-on/off indicator in the past; could it take ^VIX’s place? Probably not: in general it responds to Australian and Japanese economic issues, which too often are unrelated to broad angst in US markets. Bottom line: insufficient correlation.
Somewhere out there, a good angst indicator is lurking. Probably, it used to correlate strongly with ^VIX, and doesn’t any more. C’mon, Market Breadth fans, let’s find it!
Regarding Intel, IMO the fall was driven primarily by this:
https://seekingalpha.com/news/3981798-intel-to-restructure-manufacturing-business
Yeah. We need to crowdsource a new angst indicator! Maybe the put/call ratio? AUD/JPY also broke earlier this year thanks to the swirling signals of economics and central bank responses and inflation. I need to write an update on that. AUD/JPY has been useful in the past month or so. Maybe it will start behaving again….
The link provides a summary from Intel’s point of view which is very rosy. I am wondering why the market decided to interpret this so negatively. I am wondering whether it is a typical angst that can happen when a company’s financial model undergoes a significant change: analysts sell first and analyze later.