Stock Market Commentary:
I expressed my surprise after the stock market soared in response to Fed Chair Jerome Powell’s inflation-fighting speech. I thought Powell simply reiterated known information with more reminders of the Fed’s inflation-fighting commitment. Since then, two strong economic reports in a row have sent the stock market into rapid retreat from that post-Powell celebration. On Friday, the November job’s report once again delivered job growth, this time to the tune of 263,000 with a stubbornly unchanged 3.7% unemployment rate. The data further defied those who think the economy is already in recession when the Institute for Supply Management (ISM) reported a 30th straight month of expansion for the service economy. Business activity even hit an 11-month high. While the stock market rebounded from Friday’s disappointment, Monday’s good news sent the market into rapid retreat.
As a reminder, good economic news is bad news for the stock market as long as the Fed is in inflation-fighting mode. Wall Street wants a recession so that the Fed will stop tightening monetary policy and perhaps even start reversing rates (to the market’s delight). For now the economic data continue to elude the folks who insist that a recession started earlier this year. The constant calls for a recession will perhaps make the eventual onset of an official recession, one of the most anticipated and most welcomed economic slowdowns ever.
The Stock Market Indices
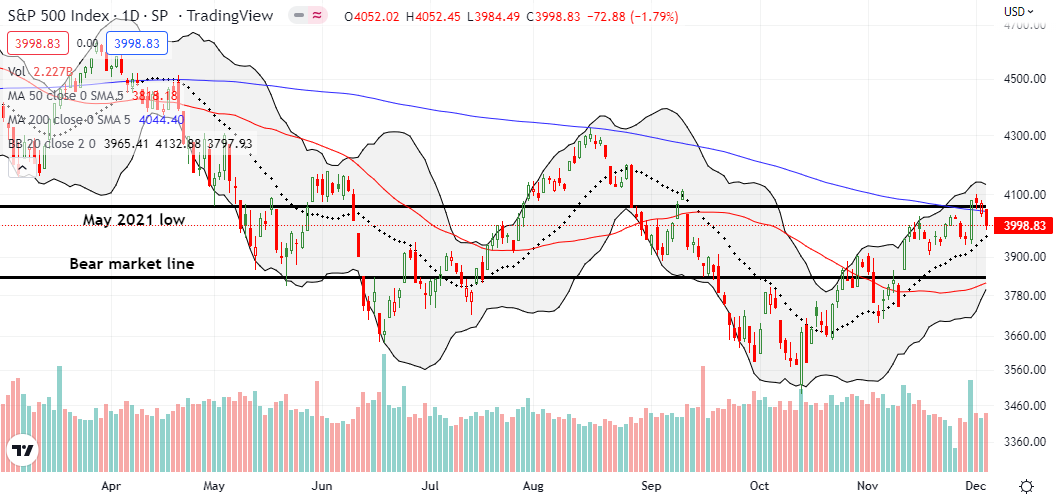
The S&P 500 (SPY) lost 1.8% and lost its bullish positioning above its 200-day moving average (DMA) (the blue line below) and the May, 2021 low. On Friday, the index made a feeble recovery from the shock and awe of yet another strong jobs report. Monday’s good news on the economy was just too much to bear. The uptrending 20DMA (the dotted line below) still offers reassurances. Otherwise, the S&P 500 will confirm its 200DMA breakdown and set up a run to test the converging support from the bear market line and the 50DMA (the red line below).
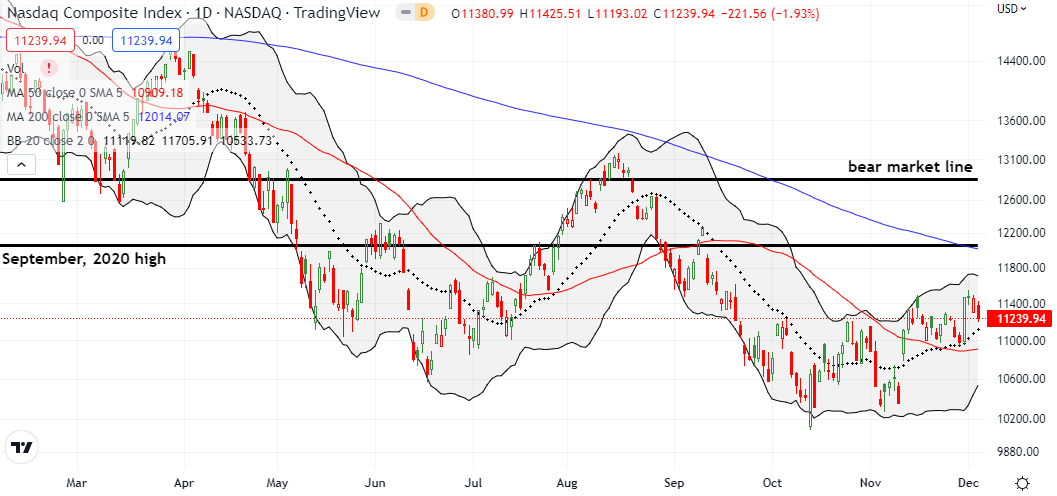
The NASDAQ (COMPQ) also still has reassurances from uptrending 20DMA support. A 1.9% loss left that key support intact. There is a short distance from there to an even more important test of 50DMA support.
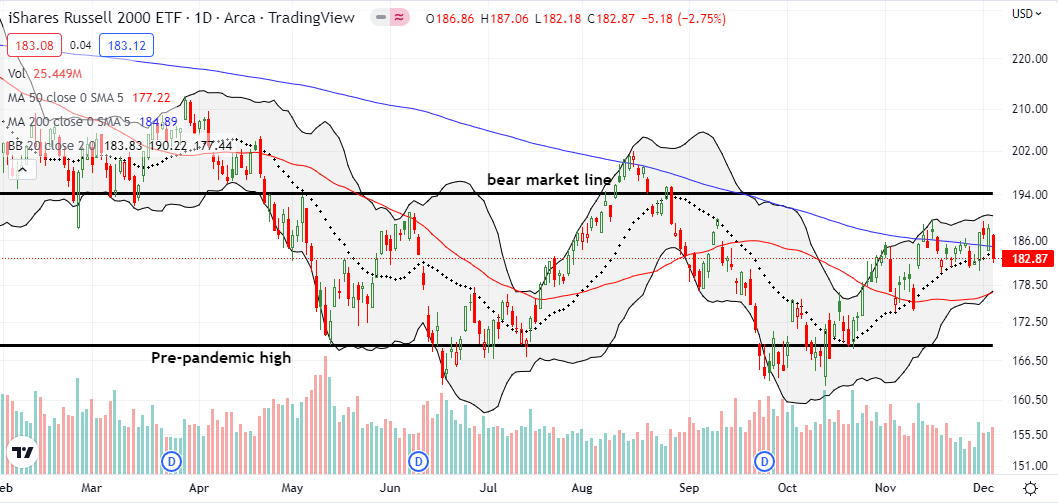
The iShares Russell 2000 ETF (IWM) had the worst day of the major indices. Not only did IWM under-perform with a 2.8% loss, but also the ETF of small caps completely reversed all its gains from the stock market’s surprisingly bullish reaction to Powell’s speech last week. Moreover, unlike the S&P 500 and the NASDAQ, IWM closed below its 20DMA support. Another close lower would confirm the breakdown and setup a test of 50DMA support.
Stock Market Volatility
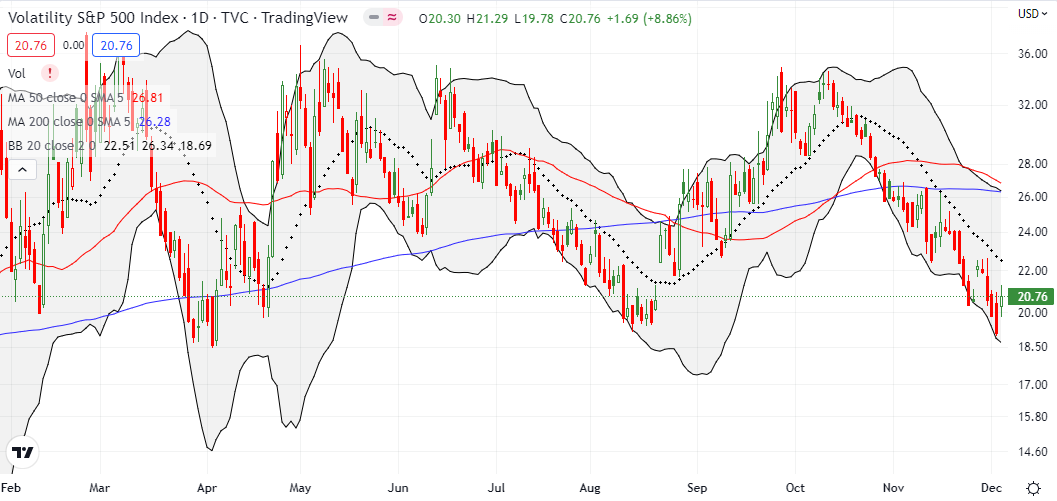
The volatility index (VIX) added to bearish developments by completely rejecting the bullish implications of Friday’s breach of the key 20 support level. The VIX gapped up from the open and even made incremental gains from there. The 8.9% pop left the overall downtrend intact, but the VIX now looks positioned to end that downtrend in due time.
The Short-Term Trading Call On A Rapid Retreat
- AT50 (MMFI) = 66.0% of stocks are trading above their respective 50-day moving averages (ends 3 overbought days)
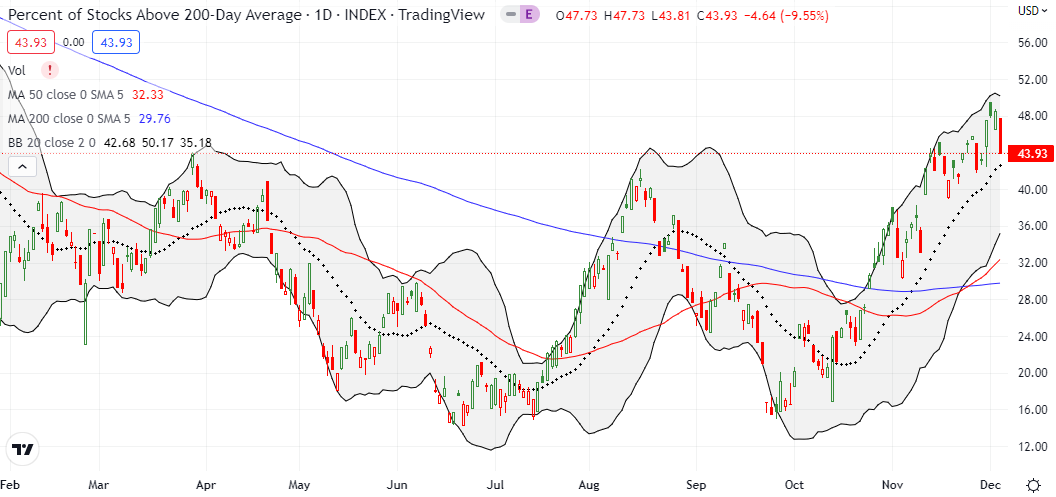
- AT200 (MMTH) = 43.9% of stocks are trading above their respective 200-day moving averages
- Short-term Trading Call: cautiously bearish
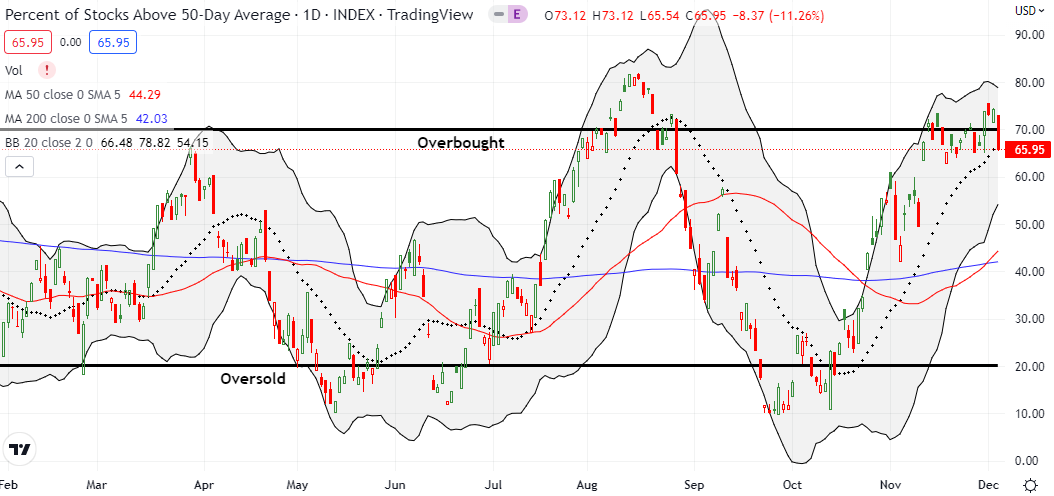
AT50 (MMFI), the percentage of stocks trading above their respective 50DMAs, dropped 8 percentage points and brought the latest overbought period to an end at 3 days. Per the AT50 trading rules, I once again downgraded the short-term trading call. I went from neutral to cautiously bearish. Given the prospects for more chop and churn to come, I have resolved to maintain this bearish stance even if the market flips right back into overbought territory. Sticking with a bias will provide better focus to short-term trades; that is, I will focus on fading rallies in anticipation of the next rapid retreat.
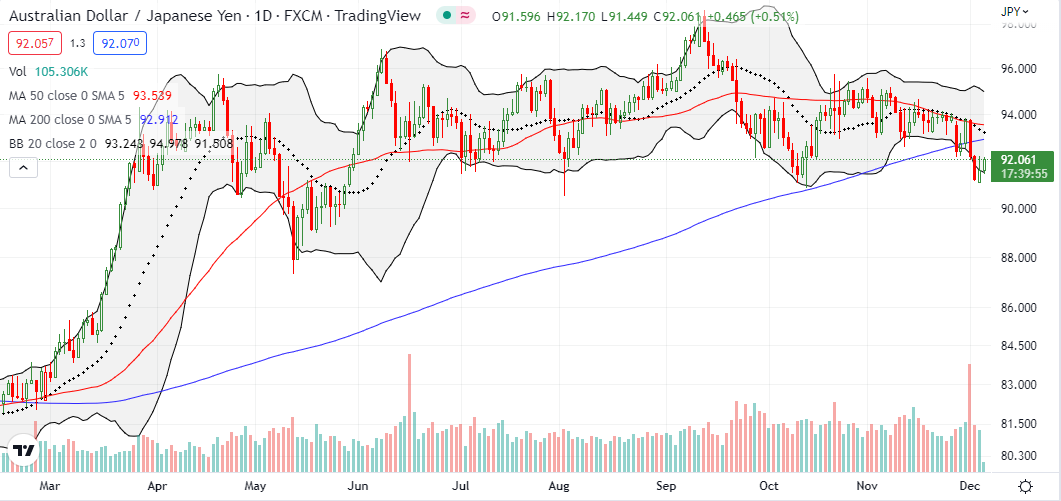
The bearish signals are accumulating despite the seasonal tailwinds for the stock market. The VIX rejected the 20 breakdown, IWM keeps testing 20DMA support, and both the S&P 500 and IWM failed to hold 200DMA breakouts. Add the Australian dollar versus the Japanese yen (AUD/JPY) to the swirl. This forex indicator of risk appetite broke down the day after the stock market celebrated Powell’s speech. The rapid retreat was an early warning signal for this freshly bearish turn in the stock market. Confirmation will come in the form of a close below the October lows.
Be careful out there!
Footnotes
“Above the 50” (AT50) uses the percentage of stocks trading above their respective 50-day moving averages (DMAs) to measure breadth in the stock market. Breadth defines the distribution of participation in a rally or sell-off. As a result, AT50 identifies extremes in market sentiment that are likely to reverse. Above the 50 is my alternative name for “MMFI” which is a symbol TradingView.com and other chart vendors use for this breadth indicator. Learn more about AT50 on my Market Breadth Resource Page. AT200, or MMTH, measures the percentage of stocks trading above their respective 200DMAs.
Active AT50 (MMFI) periods: Day #35 over 20%, Day #31 over 30%, Day #29 over 40%, Day #17 over 50%, Day #17 over 60%, Day #1 under 70% (underperiod ended 3 days overbought)
Source for charts unless otherwise noted: TradingView.com
Full disclosure: long IWM calendar call spread, short IWM put spread, long SPY calendar call spread
FOLLOW Dr. Duru’s commentary on financial markets via StockTwits, Twitter, and even Instagram!
*Charting notes: Stock prices are not adjusted for dividends. Candlestick charts use hollow bodies: open candles indicate a close higher than the open, filled candles indicate an open higher than the close.


