
Stock Market Commentary
Unlike the months long process of declining market breadth, the resolution into an oversold trading period came swift, fast, and in a hurry. I thought my wait for an oversold trading period would last more days and weeks. Instead, a further plunge in market breadth combined with other important price signals to finally push me off weeks of market neutrality and back into the bullish camp.
The Stock Market Indices
The S&P 500 (SPY) has been so strong for so long that, on a relative basis, today’s test of support at the 50-day moving average (DMA) (the red line below) looks like a marker of an oversold trading period. The index’s 1.6% loss completed a quick reversal of the June breakout to all-time highs. The S&P 500 made a rare appearance at its 50DMA and bounced right off that support. I suspect the algos and like-minded traders will try to follow through on this test of 50DMA support. This setup is the obvious trade. However, I do not think the S&P 500 offers enough upside opportunity for an oversold bounce. That honor remains with the stocks suffering the beatings for weeks and months now.
If I decide to buy into the S&P 500, I will wait for the confirmation that comes from a higher close. I like even better a close above $4300 and the intraday high or a close above the 20DMA.
The NASDAQ (COMPQX) pulled off its own perfect bounce. The tech-laden index stopped cold at its lower Bollinger Band (BB) with a 1.1% loss. I thought the resolution of declining market breadth would create a test of 50DMA support. However, that scenario belonged to a longer timeframe for the decline. I will instead count the quick drop to the lower boundary of the Bollinger Band channel as a marker of an oversold trading period.
The iShares Trust Russell 2000 Index ETF (IWM) delivered a test even more critical than the ones from the S&P 500 or the NASDAQ. IWM slid another 1.5% and closed right at the lower boundary of its 2021 trading range. Moreover, IWM stopped just short of 200DMA support. Combine these moves with a close below the lower-BB, and IWM has relatively deep marks of an oversold trading period. I am a buyer of IWM here and will add more on a true 200DMA test.
Stock Market Volatility
At its highs, the volatility index (VIX) returned to its former May heights. As such, the fear gauge resolved declining market breadth according to the script I laid out. Still, I did not take profits on my UVXY September call spread. Even more than before, I want to hold this position as a partial hedge. I am now focused on buying opportunities and like having this put spread as a remaining backstop.
The Short-Term Trading Call for An Oversold Trading Period
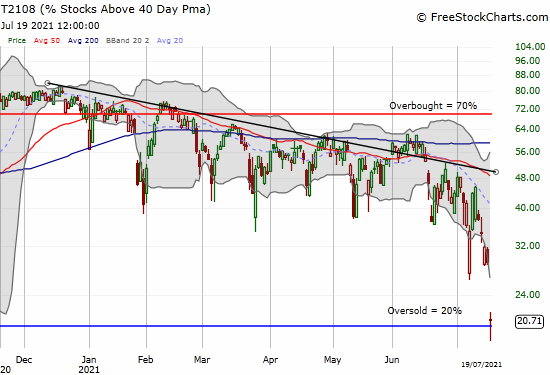
- AT40 (T2108) = 20.7% of stocks are trading above their respective 40-day moving averages (10-month low)
- AT200 (T2107) = 63.5% of stocks are trading above their respective 200-day moving averages (TradingView’s calculation) (8-month low)
- Short-term Trading Call: cautiously bullish

AT40 (T2108), the percentage of stocks trading above their respective 40DMAs, closed at 20.7%. Technically, my favorite technical indicator did not achieve the oversold trading status that comes with a close below 20%. However, AT40 fell significantly in combination with all the other important price tests and milestones from the S&P 500, the NASDAQ, IWM, and the volatility index. Moreover, AT200 (T2107), the percentage of stocks trading above their respective 200DMAs, plunged to a fresh 8-month low. AT200 has suffered a persistent downtrend since its February, 2021 high; this downtrend accelerated in July (see the chart at the end of this post).
Even with the further downside risk I described in my last Above the 40 post, I am compelled to turn on the AT40 trading rules and set aside discretion. I am calling this trading action an oversold trading period and, accordingly, flipping to a cautiously bullish short-term trading call. Unlike other oversold trading periods, I am not starting with buys on the S&P 500. Instead, I am starting where potential upside looks greatest…like the truly beaten up sector of small caps represented by IWM. My previous posts are full of candidates to buy. My upside targets for broken stocks sit at overhead resistance. Accordingly, I am trading as if an oversold trading period will return in August and/or September.
Stock Chart Reviews – Below the 50DMA
Caterpillar (CAT)
Of the put options I closed out at the open, Caterpillar (CAT) should have been among them. Instead, I now look at CAT as a potential confirmation of a short-term bottom for this oversold trading period. CAT bounced perfectly off the $200 level and closed near where it opened at 200DMA support. Given CAT is well below its lower Bollinger Band (BB), the stock is already over-stretched and due for a bounce. I am a buyer as soon as CAT trades above today’s intraday high of $203.75. I stop out below $200. CAT is a short candidate below that level outside of an oversold trading period.
Stock Chart Reviews – Above the 50DMA
Apple (AAPL)
I dutifully followed the Apple Trading Model (ATM) into a loss on Monday morning’s big gap down. I also dutifully bought fresh call options near the intraday lows. Apple (AAPL) plunged 2.7% but remains above its 20DMA. I assume AAPL has downside risk to that level in the case of an extended oversold trading period.
Upwork, Inc (UPWK)
Last week, Upwork, Inc (UPWK) dropped 17.4% out of seemingly nowhere. I am still waiting for news to explain what happened. In the meantime, I dared to buy the stock as it tested 50DMA support given I am bullish on the company. Buyers quickly stepped into the morning’s gap down. These buyers transformed what looked like a bearish confirmation of a 50DMA breakdown into a bullish engulfing pattern that typically signals a bottom. Even better, UPWK finished the day above 50DMA support. I now have a clear stop loss point below the day’s intraday low of $45.77
Be careful out there!
Footnotes
“Above the 40” (AT40) uses the percentage of stocks trading above their respective 40-day moving averages (DMAs) to measure breadth in he stock market. Breadth indicates the distribution of participation in a rally or sell-off. As a result, AT40 can identify extremes in market sentiment that are likely to reverse. Above the 40 is my alternative name for “T2108” which was created by Worden. Learn more about T2108 on my T2108 Resource Page. AT200, or T2107, measures the percentage of stocks trading above their respective 200DMAs.
Active AT40 (T2108) periods: Day #177 over 20% (overperiod), Day #2 under 30% (underperiod), Day #6 under 40%, Day #16 under 50%, Day #28 over 60%, Day #90 under 70%
{as of July 19, the line charts are not up-to-date}


Black line: AT40 (T2108) (% measured on the right)
Red line: Overbought threshold (70%); Blue line: Oversold threshold (20%). Chart always show the latest download date. Source: FreestockCharts
Source for charts unless otherwise noted: TradingView.com
Grammar checked by Grammar Coach from Thesaurus.com
Full disclosure: long UVXY call spread, long AAPL calls, long UPWRK
FOLLOW Dr. Duru’s commentary on financial markets via StockTwits, Twitter, and even Instagram!
*Charting notes: Stock prices are not adjusted for dividends. Candlestick charts use hollow bodies: open candles indicate a close higher than the open, filled candles indicate an open higher than the close.
Good informative and easy to read and understand THANKS
And thanks for reading!