
Stock Market Statistics
AT40 = 58.8% of stocks are trading above their respective 40-day moving averages (DMAs)
AT200 = 30.8% of stocks are trading above their respective 200DMAs
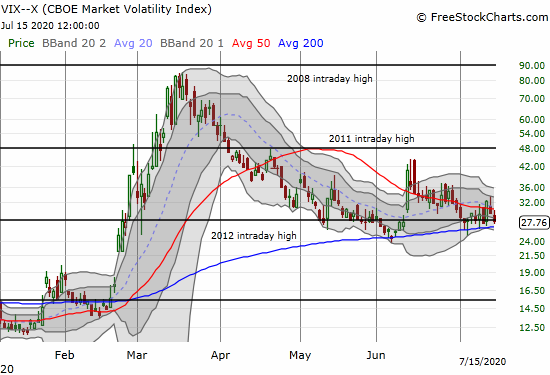
VIX = 27.8
Short-term Trading Call: neutral
Stock Market Commentary
I anticipated a shallow sell-off for a downward resolution to the bearish divergence in the stock market. However, a day and a half pullback was sharper, shallower, and shorter than I could have projected. I barely had time to review my shopping list of stocks.
AT40 (T2108), the percentage of stocks trading above their respective 40-day moving averages (DMAs), dropped as low as 32.9% on Tuesday before the stock market snapped out of its brief panic attack. The low 30s is often “close enough” to oversold in a bull market, and the market may have already drawn that line in the sand to end the bearish divergence. Even AT200 (T2107), the percentage of stocks trading above their respective 200DMAs, took on a positive tone with a small breakout to 30.8%.
The week started with a slew of bad news which headlines and conventional finance media trotted out as explanations for the selling that took the S&P 500 (SPY) down 0.9% and the NASDAQ (COMPQX) down 2.1%: U.S. sanctions against China over its new security law in Hong Kong and incursions into the South China Sea, soaring COVID-19 cases in key U.S. states, fresh news on the soaring U.S. debt, etc… pick the excuse or take all of them. A Tuesday morning gap down brought the concerns over all that negative news to a climactic end. Attention eagerly turned to more good news about a COVID-19 vaccine from Moderna (MDRN).
The Stock Market Indices
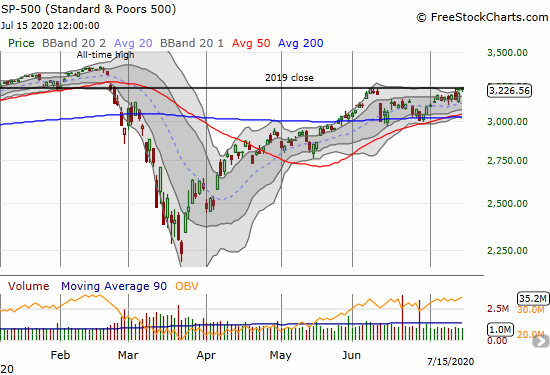
The S&P 500 (SPY) climbed over its edge and tantalizingly stopped right at its 2019 closing price. The index looks poised for a major breakout that would confirm a fresh buying cycle.
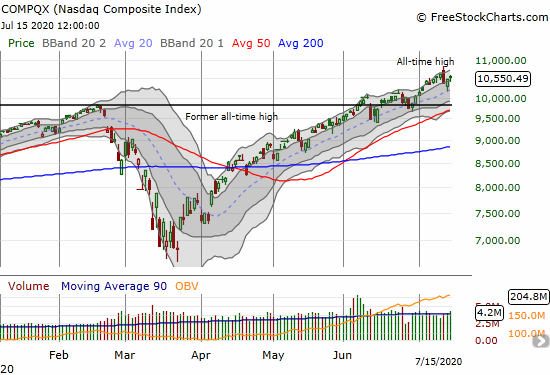
The NASDAQ (COMPQX) took on the brunt of the ire of sellers. The tech-laden index flipped from out-performer to under-performer. The bearish engulfing pattern following Friday’s all-time high seemed to signal a lasting top was unfolding. Yet, as I explained in my last Above the 40 post, I could not get bearish knowing that AT40 was approaching the oversold threshold of 20%. That caution now looks warranted with the NASDAQ bouncing perfectly off support at its 20-day moving average (DMA). The primary uptrend looks intact.
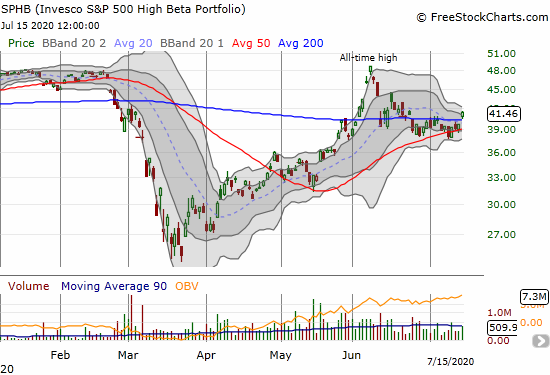
The Invesco S&P 500 High Beta Portfolio (SPHB) was the most interesting index on the day. SPHB is one of several indices suffering from the sell-off in the wake of a near parabolic run-up to June 8th highs. The extended pullback helped form the bearish divergence from the collective S&P 500 index and the NASDAQ. SPHB broke out above its 200DMA and confirmed 50DMA. As I stated in the last Above the 40 post, this index sits atop my buy list for just such an occasion. I will buy Thursday morning assuming SPHB does not gap right back down under support. My profit target is the all-time high.
Volatility
The volatility index (VIX) wilted in the face buyers rushing into the breach. The VIX is right back to recent support. I like going long volatility here as a hedge.
The Short-Term Trading Call
The short-term trading call stays neutral even though the rapid resolution of the bearish divergence has set up numerous interesting buying opportunities. The buying window could be short with AT40 likely to challenge overbought levels in a hurry if the market picks up momentum. The NASDAQ also needs to print a new all-time high to invalidate its bearish engulfing topping pattern. The S&P 500 has clearance to get back to its all-time high but will need the “re-opening” trades to continue regaining favor.
Stock Chart Reviews – Below the 50DMA
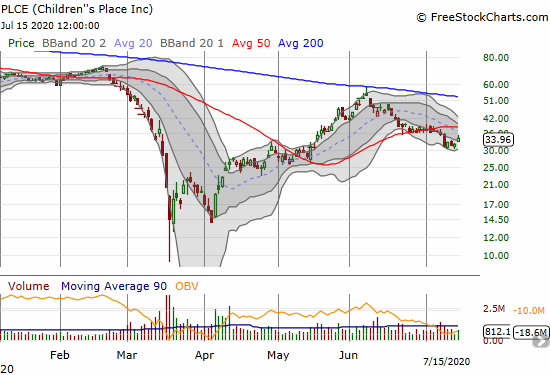
Children’s Place (PLCE)
Children’s Place (PLCE) benefited from the rebound and rotation into reopening plays. Yet, the stock has a lot of work ahead to overcome an on-going downtrend from the June 8th high which stopped cold at downtrending 200DMA resistance. PLCE is also in bearish territory thanks to a 50DMA breakdown.
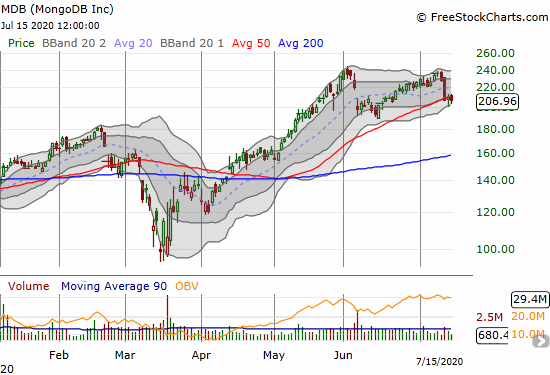
MongoDB (MDB)
MongoDB (MDB) was among many hot momentum tech stocks that became “sources of cash” on Monday. MDB plunged 9.2% and may have printed a double top. Technically the 50DMA breakdown confirmed the double-top, but two days in a row MDB bounced sharply off its intraday lows. This price action suggests eager buyers are still circling.
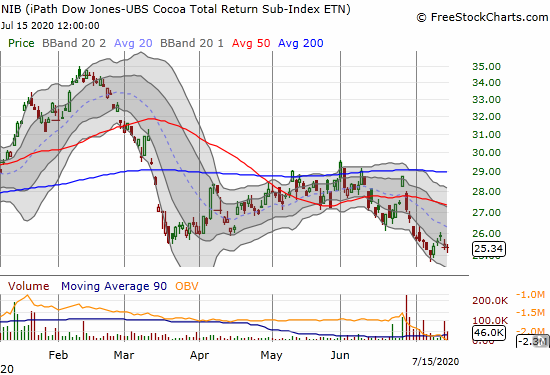
iPath Dow Jones UBS Cocoa Total Return Sub Index ETN (NIB)
The iPath Dow Jones UBS Cocoa Total Return Sub Index ETN (NIB) is back to March lows. I have been tracking news over the last two weeks or more and have yet to see anything that helps me explain the weakness. Still, per my on-going permabull strategy in NIB, I am accumulating stock in this weakness. I hope to feature a piece on NIB soon.
Stock Chart Reviews – Above the 50DMA
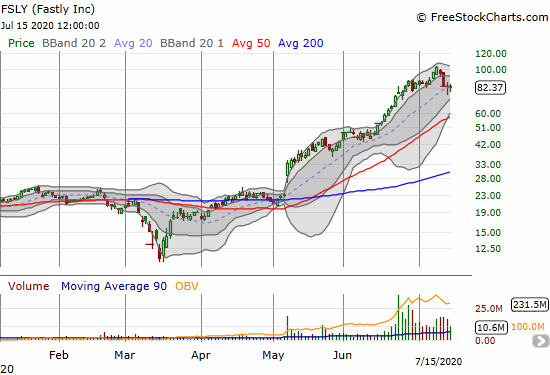
Fastly (FSLY)
Fastly (FSLY) increased in value over 4x since reporting earnings in May. The stock surged through $100 last Thursday only to gap down the next day with a 7.6% loss. Monday’s sell-off took FSLY down another 12.3%. The stock is now trying to hold onto 20DMA support. This stock is only for the trader with a high risk tolerance. A buy here has a stop below the intraday low of $73.87.
Camping World Holdings (CWH)
In late May, I made a case for shorting puts in Camping World Holdings (CWH). I added a comment to that post to flag another surge in put volume that looked just as bullish as the first surge that caught my interest. With CWH cleanly breaking out, I have more risk than reward in continuing to hold my short put position. I will take profits this week.

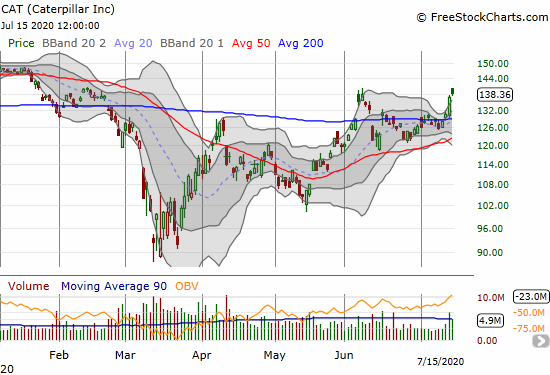
Caterpillar (CAT)
Caterpillar (CAT) is back in bullish breakout territory. Since I use CAT put options as a hedge against bullishness, I am not buying this breakout. Again, I see little point in buying puts in CAT while it looks so strong.
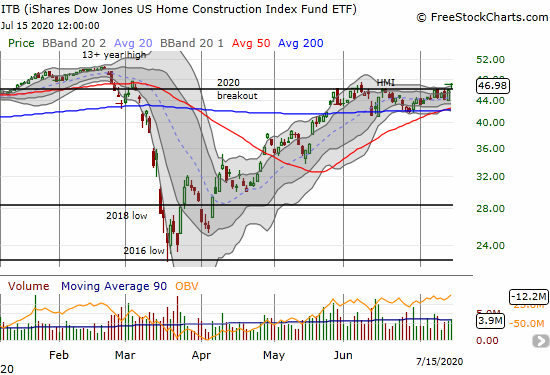
iShares U.S. Home Construction ETF (ITB)
The iShares U.S. Home Construction ETF (ITB) is slowly grinding its way into an important breakout. ITB finally closed above its 2020 breakout point. Its next target is the 13+ year high it set ahead of the Spring home selling season. Needless to say, I am going to continue sitting on my ITB shares and other housing plays as things slowly unfold.
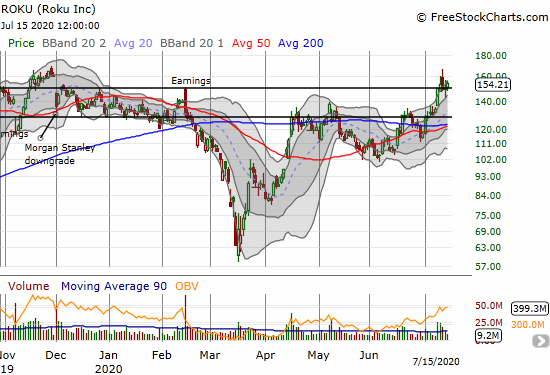
Roku (ROKU)
Traders and investors may finally be making up their collective minds on Roku (ROKU). The stock continued to surprise me by maintaining momentum after returning to its extended trading range. While sellers faded the stock after it filled the November, 2019 gap down, ROKU looks like a buy with a stop below the recent intraday low of $142.15.
Stock Chart Spotlight – Bullish Breakout
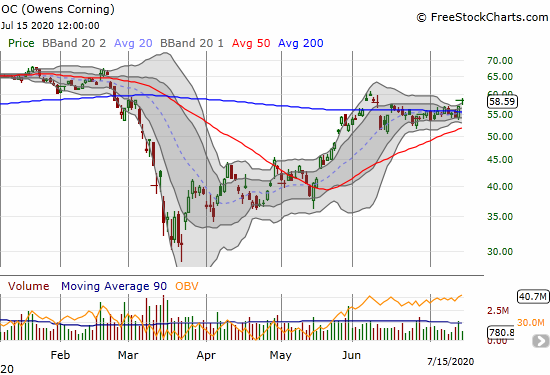
Owens Corning (OC)
Materials company Owens Corning (OC) is an important housing play. After a month long consolidation period, OC confirmed a 200DMA breakout with a 2.8% gain. I am buying the stock here with a likely stop below the uptrending 50DMA.
— – —
FOLLOW Dr. Duru’s commentary on financial markets via email, StockTwits, Twitter, and even Instagram!
“Above the 40” uses the percentage of stocks trading above their respective 40-day moving averages (DMAs) to assess the technical health of the stock market and to identify extremes in market sentiment that are likely to reverse. Abbreviated as AT40, Above the 40 is an alternative label for “T2108” which was created by Worden. Learn more about T2108 on my T2108 Resource Page. AT200, or T2107, measures the percentage of stocks trading above their respective 200DMAs.
Active AT40 (T2108) periods: Day #65 over 20%, Day #59 over 30%, Day #4 over 40%, Day #1 over 50% (overperiod ending 6 days under 50%), Day #15 under 60%, Day #18 under 70%
Daily AT40 (T2108)
")
Black line: AT40 (T2108) (% measured on the right)
Red line: Overbought threshold (70%); Blue line: Oversold threshold (20%)
Weekly AT40 (T2108)

*All charts created using FreeStockCharts unless otherwise stated
The T2108 charts above are my LATEST updates independent of the date of this given AT40 post. For my latest AT40 post click here.
Be careful out there!
Full disclosure: long ITB shares and short calls, short CWH puts, long PLCE call
*Charting notes: FreeStockCharts stock prices are not adjusted for dividends. TradingView.com charts for currencies use Tokyo time as the start of the forex trading day. FreeStockCharts currency charts are based on Eastern U.S. time to define the trading day.
Note there was also good vaccine news coming out of Oxford that I believe helped the mood in the market: https://www.bloomberg.com/news/features/2020-07-15/oxford-s-covid-19-vaccine-is-the-coronavirus-front-runner
Cambridge’s efforts look like they will beat everyone.