
AT40 = 19.7% of stocks are trading above their respective 40-day moving averages (DMAs) (oversold day #1)
AT200 = 9.2% of stocks are trading above their respective 200DMAs
VIX = 41.2
Short-term Trading Call: cautiously bullish
Stock Market Commentary
It lasted just a day. The market’s historic oversold period lasted 31 days and ended with a flurry. This week started with a quick return to oversold that was marked by a curious divergence from tech stocks.
Oversold (Again!)

I call the stock market oversold when AT40 (T2108), the percentage of stocks trading above their 40DMAs, closes below 20%. An oversold period in a bear market is a different animal than an oversold period in a bull market. In a bear market, selling pressure can continue putting the stock market back into oversold conditions. This pressure in turn can confirm overhead resistance levels, break support levels, and, worst of all, violate major bottoms. The stock market is nowhere near a retest of its major March bottom, but a quick return to oversold weakens the bullish case.
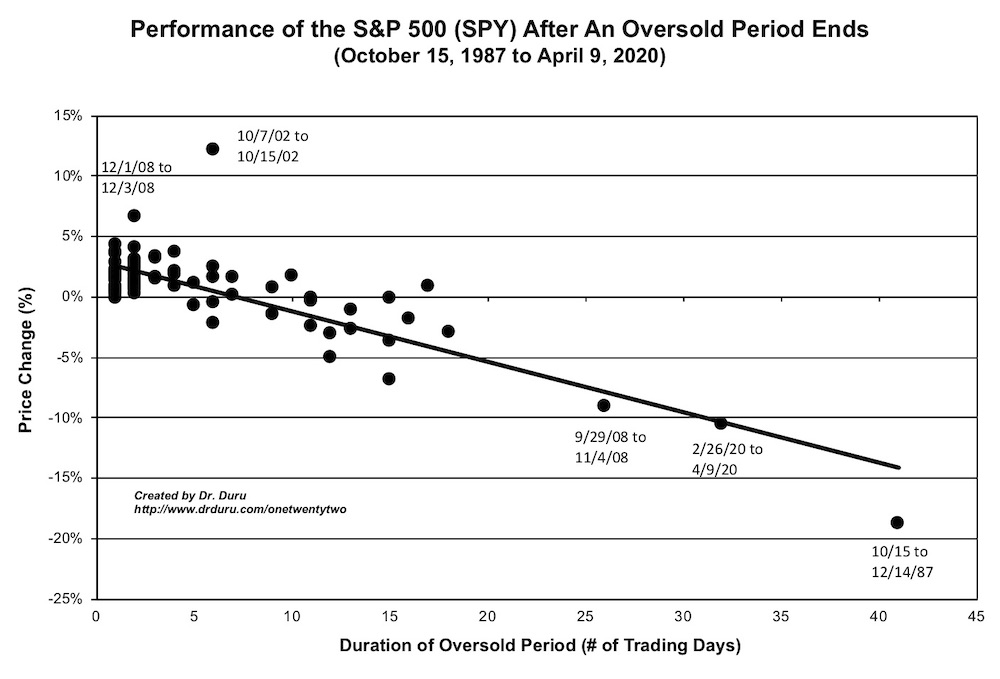
The chart below shows that the majority of oversold periods end in 1 or 2 days (see the concentration of data points). If this latest oversold period ends in 1 or 2 days, I will stay encouraged. If the oversold period drags on longer than, I will assume the odds are increasingly higher for a retest of the March lows.
The Stock Market Indices
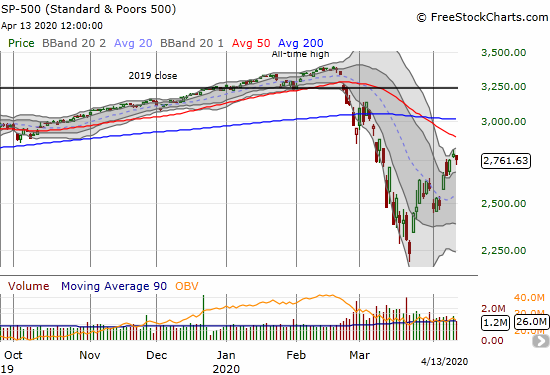
The S&P 500 (SPY) lost 1.0% after rebounding from an intraday low. Friday’s gains were immediately reversed, and the market’s buying power was questioned. From a bird’s eye view, the damage looks minimal. The index remains comfortably within an uptrending Bollinger Band (BB) channel.
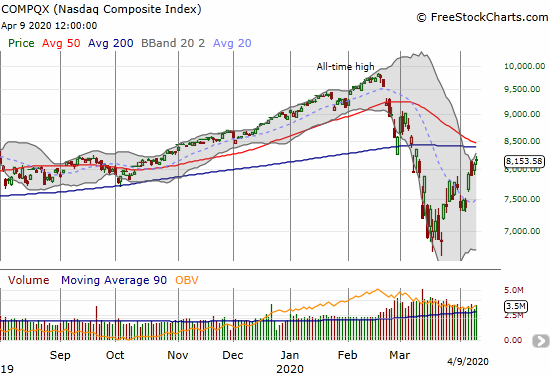
The NASDAQ (COMPQX) went from last week’s under-performance to a very surprising out-performance. In this version of playing catch-up, the tech-laden index managed to gain 0.5%. Like the S&P 500, it had to rebound from intraday lows. The fateful march toward major overhead resistance continues.
Volatility
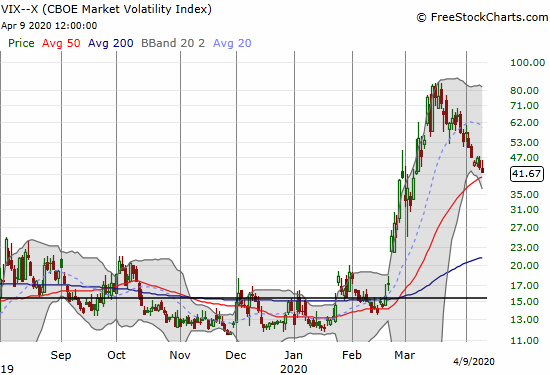
The volatility index (VIX) marginally closed lower as it continues a reluctant, slow dribble to its 50DMA support.
The Short-Term Trading Call
When oversold periods begin, by rule I start buying. This oversold period is very different given the historic oversold period that preceded it. I am staying cautiously bullish, but I am in no rush to add to positions. I did buy call options on United Airlines (UAL) per my commentary in “Culture of Collapse: Air Travel’s Disappearance In One Chart.” UAL fell 8.2% back to its 20DMA and gave me an entry point. Perhaps my interest in buying will increase on a test of now uptrending 20DMA support on the major indices. In the meantime, I expect a lot of churn in the market as earnings season pushes and pulls on investor and trader emotions. Overhead resistance will watch from above full of bemusement…
Stock Chart Reviews – Below the 50DMA
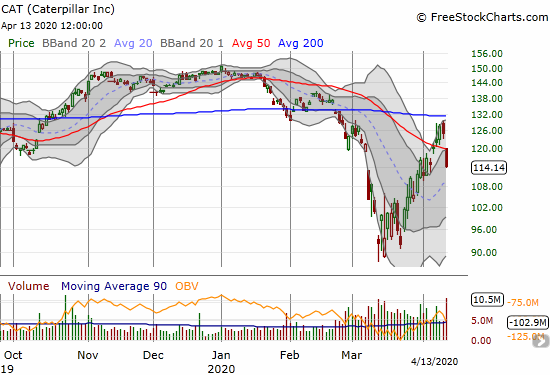
Caterpillar (CAT)
Caterpillar (CAT) quickly transformed from amazing anti-gravity to another casualty of technical resistance. I mentioned in my last post how CAT got “close enough” to 200DMA resistance to motivate me to buy a fresh bacsktop of put options. An analyst downgraded CAT to start the week and sent the stock sharply down. I took profits on both of my put options even as CAT looks like it has topped out with the fresh 50DMA breakdown.
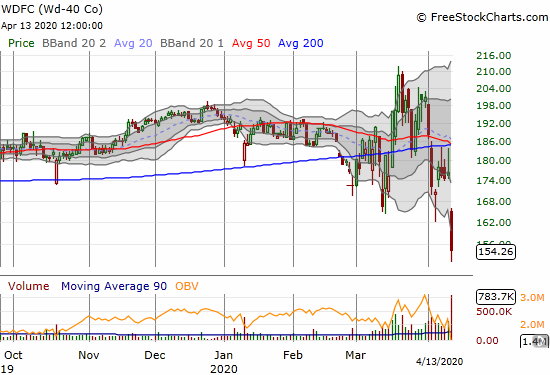
WD-40 (WDFC)
WD-40 (WDFC) is the kind of stock that will get hurt by poor earnings results because it was doing relatively well going into earnings. Despite persistent churning below its 200DMA, WDFC went into earnings trading at just the 9-month low levels first visited last month. WDFC lost 12.1% post-earnings, and the selling was nearly relentless from a gap down to an 18-month low.
Stock Chart Reviews – Above the 50DMA
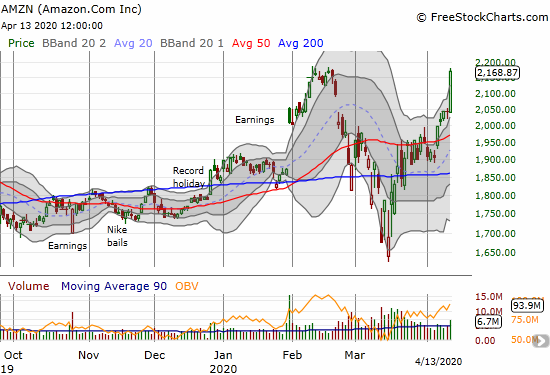
Amazon.com (AMZN)
In my lsat post, I said Amazon.com (AMZN) could see its all-time high “over the horizon.” Just like that, AMZN soared right over the horizon! The company has made a lot of headlines with all its hiring, and its central roll in the supply chains keeping people supplied as they shelter in place during the coronavirus pandemic.
— – —
FOLLOW Dr. Duru’s commentary on financial markets via email, StockTwits, Twitter, and even Instagram!
“Above the 40” uses the percentage of stocks trading above their respective 40-day moving averages (DMAs) to assess the technical health of the stock market and to identify extremes in market sentiment that are likely to reverse. Abbreviated as AT40, Above the 40 is an alternative label for “T2108” which was created by Worden. Learn more about T2108 on my T2108 Resource Page. AT200, or T2107, measures the percentage of stocks trading above their respective 200DMAs.
Active AT40 (T2108) periods: Day #1 over 20% (ending 31 days oversold, under 20%), Day #33 under 30%, Day #44 under 40%, Day #35 under 50%, Day #54 under 60%, Day #58 under 70%
Daily AT40 (T2108)
")
Black line: AT40 (T2108) (% measured on the right)
Red line: Overbought threshold (70%); Blue line: Oversold threshold (20%)
Weekly AT40 (T2108)

*All charts created using FreeStockCharts unless otherwise stated
The T2108 charts above are my LATEST updates independent of the date of this given AT40 post. For my latest AT40 post click here.
Be careful out there!
Full disclosure: long SSO shares, short UVXY shares, long UVXY call spread
*Charting notes: FreeStockCharts stock prices are not adjusted for dividends. TradingView.com charts for currencies use Tokyo time as the start of the forex trading day. FreeStockCharts currency charts are based on Eastern U.S. time to define the trading day.