
AT40 = 21.5% of stocks are trading above their respective 40-day moving averages (DMAs) (2nd day outside oversold conditions)
AT200 = 10.1% of stocks are trading above their respective 200DMAs
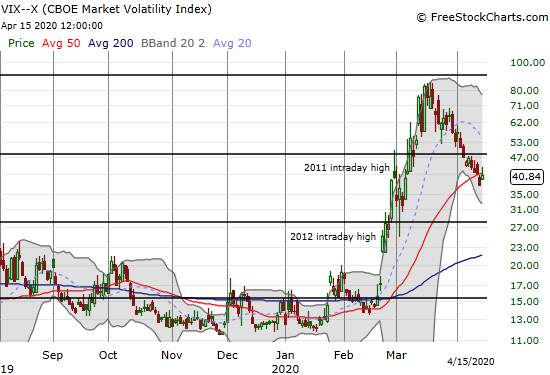
VIX = 40.8
Short-term Trading Call: cautiously bullish
Stock Market Commentary
“Swift and sweeping fiscal and monetary policy responses from U.S. officials will ultimately support stock prices from here, blunting some of the damage as the coronavirus pandemic and social distancing measures ravage the economy and grind business activity to a temporary halt, analysts at Goldman Sachs (GS), Morgan Stanley (MS), BlackRock (BLK), and JPMorgan (JPM) said in new notes Monday.
In other words, the bottom may already have been put in for stocks.”
Yahoo Finance, April 13, 2020
If there was any question about the bullish implications of the end of oversold conditions, these 4 analysts tried to push those doubts aside. They essentially declared a bottom in the stock market and buyers responded first in big cap tech on Monday and then broadly across the stock market on Tuesday.
Monday’s big day for tech did not help the broader market as it fell back into oversold conditions. Tuesday was a broad based rebound, but the divergence between tech and the rest of the market widened. The S&P 500 (SPY) tried to play catch-up with a 3.1% gain, but the NASDAQ (COMPQX) out-performed yet again with a 4.0% leap. Today, the divergence widened further.
The Stock Market Indices
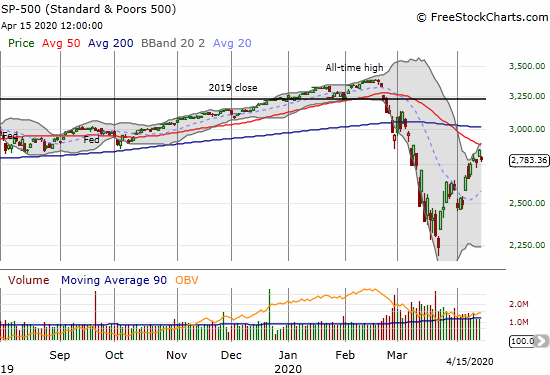
The S&P 500 (SPY) lost 2.2% and fell short of challenging overhead resistance from its 50-day moving average (DMA). The index also reversed all of its gains from the previous day.
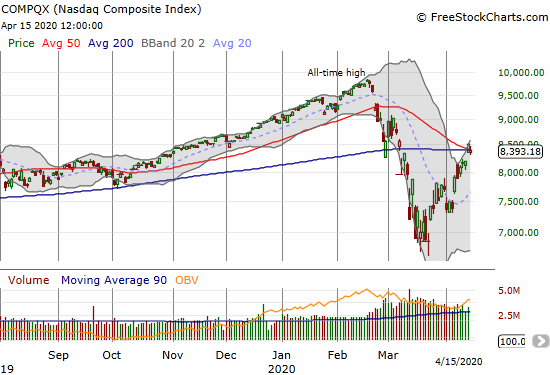
Tech put an exclamation point on the rebound out of the 1-day oversold period. Not only did the index gain 4.0% but also the tech-laden index sliced right through overhead resistance from its converged 50 and 200DMAs. Today, the NASDAQ (COMPQX) fell 1.4% but managed to hold onto its 50 and 200DMAs as support. Combined with the S&P 500’s struggle to challenge overhead resistance, this pivot for the NASDAQ presents the most critically important juncture for the stock market since the 20DMA breakouts.
iShares Russell 2000 Index Fund ETF (IWM)
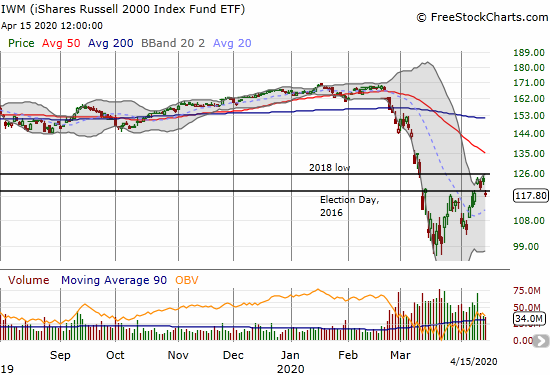
The iShares Russell 2000 Index Fund ETF (IWM) lost 4.1% in a major setback. The IWM is back to being a serious laggard in the stock market. It even closed below the Election Day, 2016 level which continues to serve as an important pivot point and resistance level.
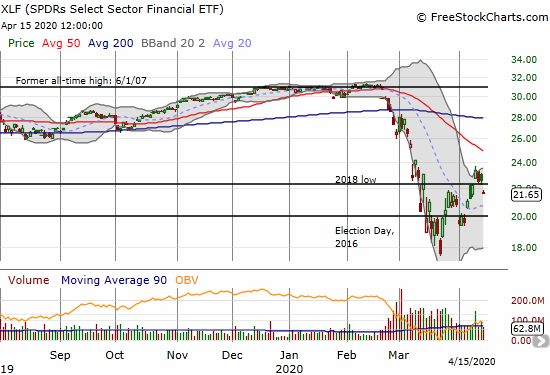
The SPDRS Select Sector Financial ETF (XLF) lagged in parallel with IWM. XLF lost 4.3% and fell below its critical pivot point from the 2018 low. Combined with IWM, XLF is providing an important counter-point to the relative optimism in the NASDAQ and the S&P 500. These indices are major contributors to the tenuousness of the market’s exit from oversold conditions.
Volatility
The volatility index (VIX) has trended down persistently since its highs of March. Even today’s 8.2% gain failed to break that downtrend. The jump was even the largest one-day move since the surge to the March high. These levels are still “elevated” (above 20), so the market in general remains subject to periodic large swings up or down.
The Short-Term Trading Call
When oversold periods begin, by rule I start buying. As I mentioned in the last Above the 40 post, I could not execute as normal. Monday’s drop into oversold territory followed an historic oversold period where I already accumulated positions and bought and sold positions at high risk. The experience naturally makes me wary of the sustainability of the 20% “over-period” for AT40 (T2108), the percentage of stocks trading above their respective 40DMAs.
On Tuesday, AT40 hurdled above the 20% threshold to close at 28.2%. The day was like a more traditional rebound from an oversold condition; the majority of oversold periods last just one or two days. Still, I could not interpret that move as a bullish confirmation of the end of oversold trading conditions for the same reason I did not aggressively buy Monday’s return to oversold. In other words, I think the stock market is in a bit of bear/bull limbo. I will definitely buy into a larger dip (especially back to 20DMA support levels), but in the meantime, I am watching for a 50DMA breakout from the S&P 500 as the next phase of bullishness for the market.
So many market watchers stare at the Investors Intelligence scores that its usefulness seems muted. The above tweet that juxtaposes the Investor Intelligence bullish percentage with the S&P 500 tells me that, at best, in recent times this score is just coincident with market moves. However, this latest cycle shows a telling plunge in bullishness just ahead of the ultimate top in the S&P 500. The last week of buying pressure seems to have cheered spirits enough to push bullishness higher. If previous market peaks are any indication, there is no need to worry about investors getting overly bullish until their share reaches 50-55%…and even at that point there is no telling how long the market can keep rallying from there.
Stock Chart Reviews – Below the 50DMA
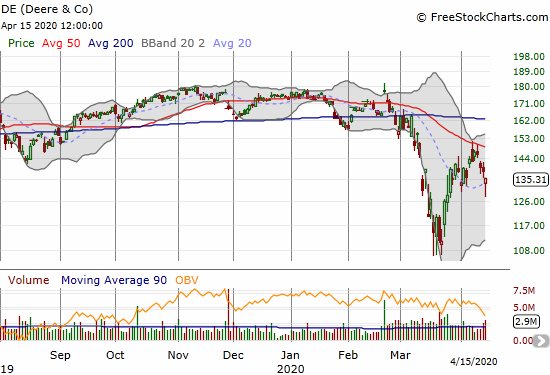
Deere & Co (DE)
Deere & Co (DE) is one of many industrial and manufacturing stocks that are betraying the market’s overall bullishness. DE failed twice at 50DMA resistance last week. The stock fell about 10% from there in just three days of trading. Today’s rebound from lows may signal a hold on now uptrending 20DMA support. I am a buyer for a rebound to 50DMA resistance if DE trades higher than today’s close.
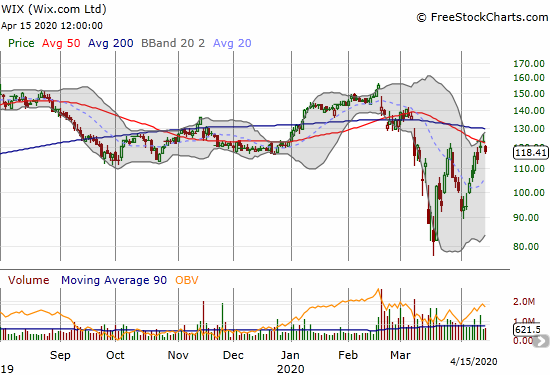
Wix.com (WIX)
Web services company Wix.com (WIX) broke out above its 50DMA yesterday but faded sharply from its highs. Today’s gap down and 4.0% loss looks like a failure under 200DMA resistance and could mark a short-term topping pattern. I already took profits on my position. I will buy back in on a 20DMA test.
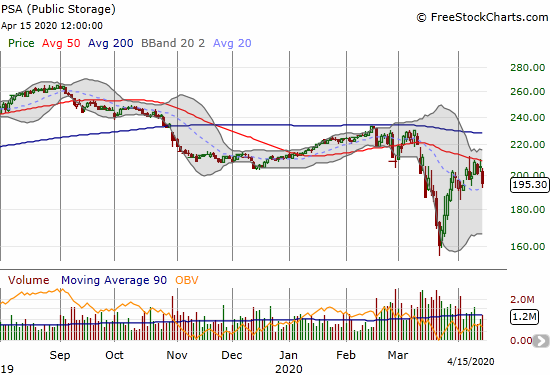
Public Storage (PSA)
Public Storage (PSA) put up a fight at 50DMA resistance since the first test a week ago. Today’s 4.7% loss may signal the failure of that fight. The next challenge is to hold 20DMA support.
Stock Chart Reviews – Above the 50DMA
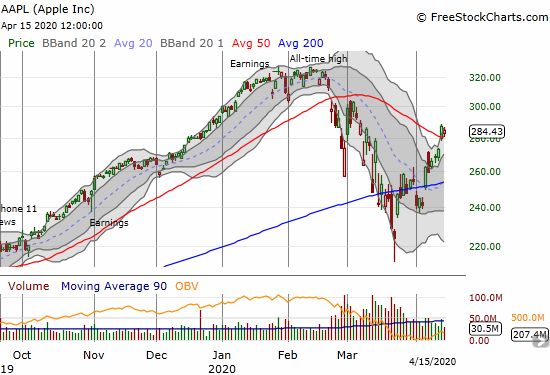
Apple (AAPL)
One of the most impressive moments of this week was the 50DMA breakout for Apple (AAPL) on a 5.1% gap up. The move caught me sitting in a calendar call spread that was much too conservative for this kind of move; I will leave a lot of profit on the table. While the stock failed to confirm is 50DMA breakout, AAPL remains in a bullish position. AAPL is doing its part to put a bullish spin on the end of oversold trading conditions.
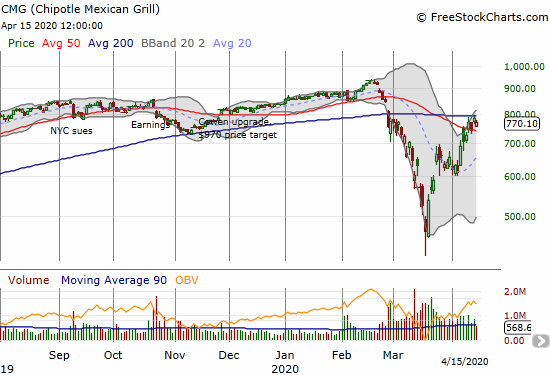
Chipotle Mexican Grill (CMG)
The rebound in Chipotle Mexican Grill (CMG) took me by surprise, and I never tried to buy in. In fact, I instead used it as a backstop with a put spread after it snaked along its 20DMA to $600. CMG is now bouncing between its 200 and 50DMAs, a 100% no-man’s land. The next move outside of this band should be significant enough to follow.
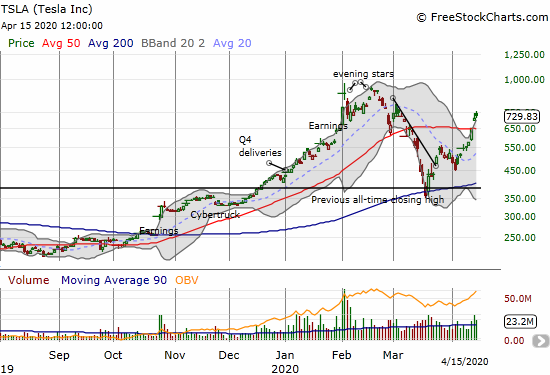
Tesla (TSLA)
The rush back into Tesla (TSLA) is truly astounding. The buying pressure is a direct flashback to the nice run-up that led to the double-top in February. While I have been bullish, I was not THIS bullish. I have flipped two sets of call positions in this time, both well ahead of even more significant profit opportunities. Moreover, I put on a small short position after I thought my first call position was going to go up in flames. I am now back to a strategy I followed before with aggressive call buying against a (much smaller) short position as a backstop.
Analysts have been particularly chatty about TSLA since last week. The latest bullish ramp came from Goldman Sachs with a buy rating and an $864 price target on a reinitiation. Goldman even stretched out for a 20-25% CAGR (compound average growth rate) over the next 5 years. Big bullish calls from Goldman seem to mark temporary ends to strong rallies, and I expect the same here. I am looking to get more aggressive after that counter-Goldman action dissipates.
I wish I had been in on this insightful crew ahead of time! Teslafaninsight thinks another short squeeze is underway in parallel with big insitutions positioning ahead of TSLA earnings on April 29th.
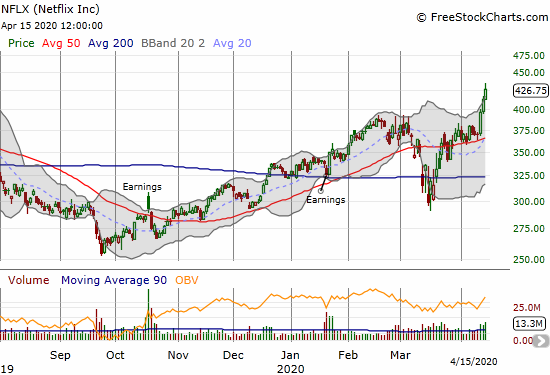
Netflix (NFLX)
At least I took profits on my short! Netflix (NFLX) is once again a star with new all-time highs. This kind of price action makes me stand down from my plans to reshort the stock ahead of earnings. I am very content to wait to see what happens after that!
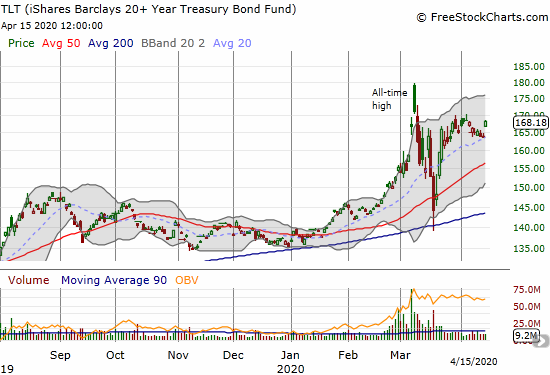
iShares Barclays 20+ Year Treasury Bond (TLT)
The iShares Barclays 20+ Year Treasury Bond (TLT) rallied in response to today’s batch of poor economic data. I am buying back in with TLT (June or August) calls the minute it trades higher than today’s close.
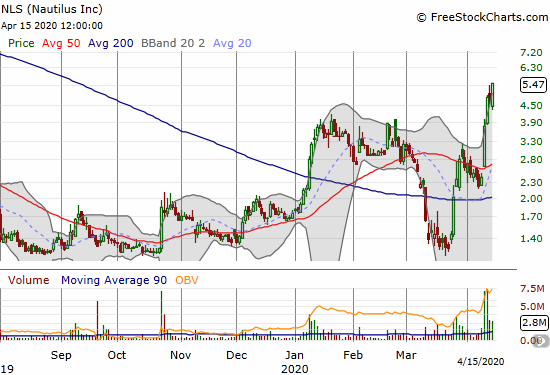
Nautilus (NLS)
Exercise equipment maker Nautilus (NLS) looks like it is in the middle of a serious comeback. NLS scored a 56.7% post-earnings surge last week. I did not even think to buy it. The stock is already up another 45.5% from there! I am keeping NLS on the radar in case a buyable pullback materializes.
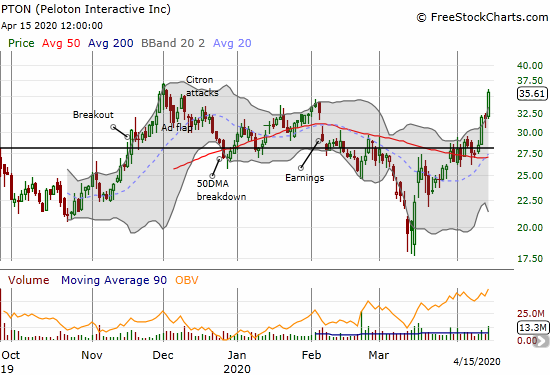
Peloton Interactive (PTON)
Peloton Interactive (PTON) benefited from the post-earnings vibes from Nautilus. The stock gained 3.5% in minor sympathy. The big follow-through came the next day with a 12.4% breakout. The jump caught me napping, and I failed to jump back into the stock. Today’s fresh 11.7% surge puts PTON at its second highest close ever. The stock is now out of my reach as this is not the kind of high-risk play to chase. Like NLS, I will keep an eye out for a buyable dip.
— – —
FOLLOW Dr. Duru’s commentary on financial markets via email, StockTwits, Twitter, and even Instagram!
“Above the 40” uses the percentage of stocks trading above their respective 40-day moving averages (DMAs) to assess the technical health of the stock market and to identify extremes in market sentiment that are likely to reverse. Abbreviated as AT40, Above the 40 is an alternative label for “T2108” which was created by Worden. Learn more about T2108 on my T2108 Resource Page. AT200, or T2107, measures the percentage of stocks trading above their respective 200DMAs.
Active AT40 (T2108) periods: Day #2 over 20% (overperiod), Day #35 under 30%, Day #46 under 40%, Day #37 under 50%, Day #56 under 60%, Day #60 under 70%
Daily AT40 (T2108)
")
Black line: AT40 (T2108) (% measured on the right)
Red line: Overbought threshold (70%); Blue line: Oversold threshold (20%)
Weekly AT40 (T2108)

*All charts created using FreeStockCharts unless otherwise stated
The T2108 charts above are my LATEST updates independent of the date of this given AT40 post. For my latest AT40 post click here.
Be careful out there!
Full disclosure: long SSO shares, long UVXY call spread, long CMG put spread, long AAPL calendar call spread, short TSLA shares and long call spread, long IWM calendar call spread
*Charting notes: FreeStockCharts stock prices are not adjusted for dividends. TradingView.com charts for currencies use Tokyo time as the start of the forex trading day. FreeStockCharts currency charts are based on Eastern U.S. time to define the trading day.