
Housing Market Intro/Summary
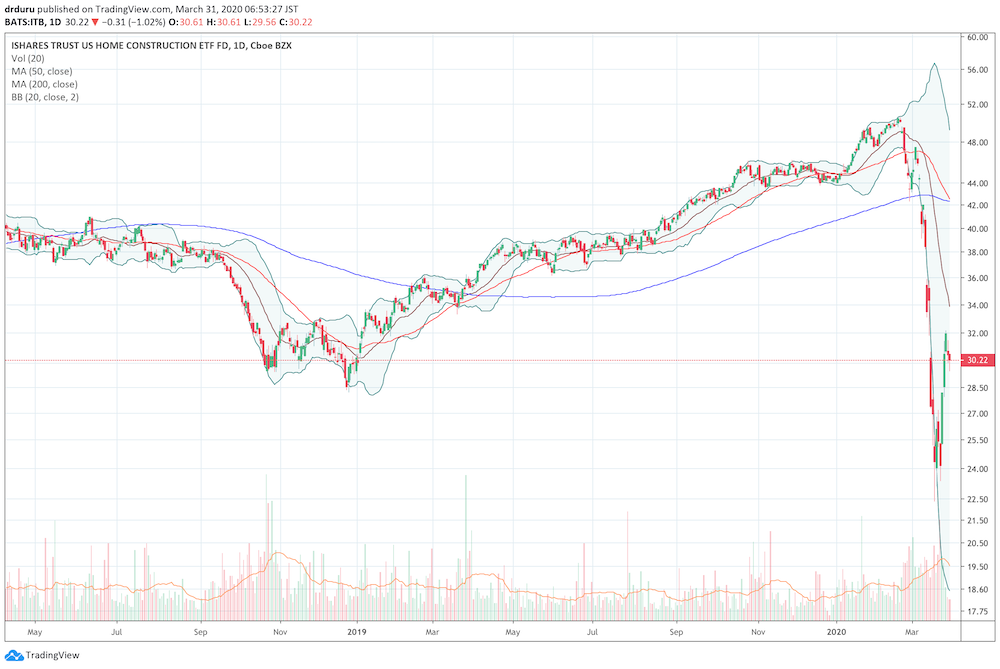
The housing market has become a lot more dynamic than usual, so over the past few months I have written more pieces beyond the monthly housing market review. The current economic crisis coming from the coronavirus pandemic has increased my frequency of coverage. The most telling moments came when I wrote to cover the absolute collapse in housing-related stocks, home builders in particular. I did not come close to anticipating the current calamity when I wrote in my last Housing Market Review about how “virus panic” had trampled over the animal spirits in the housing market.
The swift, sharp, and steep declines prompted me to put my seasonal trading strategy on the shelf and instead start focusing on builder survivability. Just like the financial crisis of 2008-2009, I am confident in a few years today’s prices will look like historic bargains. The problem will be having the patience to invest through the recovery period. At the time of writing, many of these stocks have finally stabilized. However, if the coming weeks and months tell increasing stories of paralyzed and frozen markets, there will be at least one more leg down in the stock market for a lot of home builders. They simply do not have a lot of options in a downturn beyond rushing to sell existing inventory to raise cash and suspending land investments. The builders who rushed to load up on spec inventory for this Spring selling season could become the most troubled.
Ironically, the housing data from February was very strong across the board with just a few small exceptions. The momentum building into a stellar Spring selling season is quite evident in the numbers (as well as the earnings reports I have referenced in other posts). The data below tell a story of what could have been the best market yet since the financial crisis. Now, the housing market may have to hit the reset button.
New Residential Construction (Single-Family Housing Starts) – February, 2020
February delivered very strong housing starts numbers for single-family housing.
February starts increased 6.7% above January’s 1,005,000 to 1,072,000 starts, a new 13-year high. On a year-over-year basis, single-family housing starts soared 23.3%. This strength surprised me as I expected only one or two more double-digits annual gains given the tough comparables coming ahead. Of course now I am expecting starts to plunge for several months as economic activity comes to a halt in many housing markets.
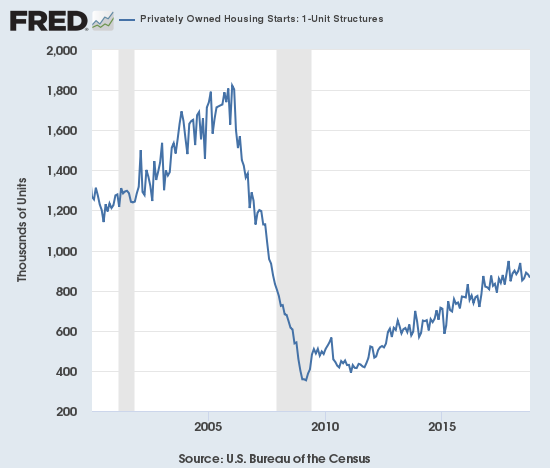
Source: US. Bureau of the Census, Privately Owned Housing Starts: 1-Unit Structures [HOUST1F], retrieved from FRED, Federal Reserve Bank of St. Louis, March 29, 2020.
For Feburary, the regional changes were strong across the board with the West leading the way once again. The Northeast, Midwest, South, and West each changed +16.1%, +27.4%, +18.9%, and +33.9% respectively. The furious construction activity in the South picked back up after a bit of a rest in January.
Existing Home Sales – February, 2020
The latest report from the National Association of Realtors (NAR) cautioned that the numbers from February do not reflect the impact from the coronavirus crisis. This reminder was particularly necessary because the report was exceptionally strong.
The seasonally adjusted annualized sales in February of 5.77M were up 6.5% month-over-month from the slightly downward revised 5.42M in sales for January. Year-over-year sales increased 7.2%. Total sales reached a 13-year high.

(As of the March, 2018 data, the NAR further reduced historical data to just 13 months. For historical data from 1999 to 2014, click here. For historical data from 2014 to 2018, click here) Source for chart: National Association of Realtors, Existing Home Sales© [EXHOSLUSM495S], retrieved from FRED, Federal Reserve Bank of St. Louis, March 29, 2020.

Sales soared despite a sharp year-over-year decline in inventory. Inventory levels from January increased while days of sales remained steady. Absolute inventory levels of 1.47M homes increased 5.0% from January, but inventory was still down 9.8% from a year ago (compare to January’s 10.7% and December’s 8.5% year-over-year declines, unrevised). “Unsold inventory sits at a 3.1-month supply at the current sales pace, equal to the supply recorded in January and down from the 3.6-month figure recorded in February 2019.” The on-going year-over-year decline in inventory is now at nine straight months. At least supply seemed to meet demand month-over-month.
The median price of an existing home hit $270,100, another large year-over-year increase of 8.0% and the 96th straight month of a year-over-year gain. However, prices peaked at $285,400 in June, 2019. Once again the prospect draws near for ending this stubborn streak. The coming housing downturn is almost sure to break the back of this streak….except of course through much of the previous recovery sellers seemed to prefer holding over discounting.
In December, the share of first-time buyers dropped to 31% from November’s 32%. In January the share bumped back up to 32% and stayed there for February. I remain surprised at the lack of gain in share by first-time buyers given the big pivot home builders made to this segment of the market. The average share for first-time homebuyers for 2016 was 35%. The NAR’s 2017 Profile of Home Buyers and Sellers reported an average of 34% for 2017, 33% for 2018, and 33% for 2019. Once the housing downturn gets underway, I expect the share of first-time buyers to plunge alongside sales.
Investors purchased 17% of homes in February, January and December, up from last year’s January and February of 16%.
In December and January all regions achieved strong year-over-year gains with the easy comparables. The regional changes for February were led by the West: Northeast +2.9%, Midwest +4.0%, South +8.2%, West +11.5%.
Like September through January, all regions experienced notable and robust price jumps in February. Here are the regional year-over-year changes in median home prices, amazingly similar as well as strong: Northeast +8.2%, Midwest +7.9%, South +8.2%, West +8.1%.
Single-family home sales increased 7.3% from January and increased on a yearly basis by 7.3%. The median price of $272,400 was up a healthy 8.1% year-over-year and up from January’s $268,600.
California Existing Home Sales – February, 2020
The housing market in California will be one of the most questionable in future reports as the state was the first to go into shelter-in-place with the San Francisco Bay Area leading the way. While residential construction can continue in some areas, buyers cannot go physical shopping and sellers have pulled listings off the market. From the California Association of Realtors (C.A.R.):
“As the coronavirus pandemic worsens, the housing market is expected to decline precipitously in the coming months, particularly in counties and cities with a “shelter in place” mandate, where open houses and home showings cannot be held…Additionally, sales in escrow may be delayed by the closure or limited availability of all the essential services related to a home sale, such as financing, title, escrow, recording or by buyers who may have backed out of a purchase due to coronavirus concerns.”
The C.A.R. also conducted a three-day “flash poll” of its member agents that showed 54% of these realtors had buyers drop from the process given coronavirus concerns and 45% had sellers back out for the same reason.
The market for existing homes in California was strong in February. C.A.R. reported existing sales of 421,670 homes, up 6.6% from January’s 395,700 . Year-over-year sales are now up 8 straight months.
February’s median price of $579,770 was up 0.8% from December’s $575,160 and up 8.5% year-over-year. Recall that according to the C.A.R. the December “year-over-year price increase was the largest since May 2014 and the first double-digit price increase in more than five-and-a-half years.” February delivered the fifth straight month with a year-over-year price increase above 6%. All regions in California experienced year-over-year price gains.
The inventory situation in California continued to worsen. In September, the number of active listings dropped 11.8% year-over-year, the largest such drop since December, 2017. October’s 18.0% decline year-over-year was the largest since May 2013. November’s decline of 22.5%, December’s drop of 25.9% (revised), and January’s drop of 26.9% were the largest percentage drops since April, 2013. February’s listing were down more than 25% (CAR did not provide a specific number).
The unsold inventory index hit 2.5 months of sales in December. The index rebounded a bit to 3.4 months of sales in January but was still down year-over-year from 4.6 months. February edged up again to 3.6 but is down significantly year-over-year from 4.6.
New Residential Sales (Single-Family) – February, 2020
February’s estimated sales of new single-family homes of 765,000 was down 4.4% from January’s significantly revised upward sales of 800,000. Sales were up 14.3% year-over-year. New home sales were just off their 13-year high but of course likely peaked here for now.
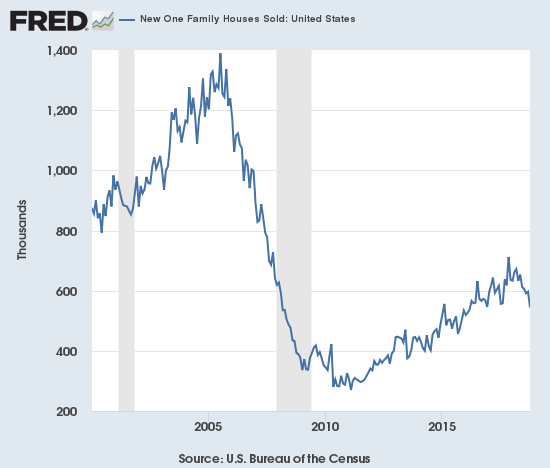
Source: US. Bureau of the Census, New One Family Houses Sold: United States [HSN1F], retrieved from FRED, Federal Reserve Bank of St. Louis, March 29, 2020.
Since hitting a peak in November and December, 2017, the median price of a new single-family home trended slightly downward to stalled out largely thanks to a surge in entry-level and lower-priced new homes. I earlier concluded “…just as with existing home sales, new home sales may no longer benefit from such a shift.” January’s surge in median price was significantly adjusted downard but a surge in February took the median price to a new-all time high of $345,900. This was a 6.3% jump from February and 7.8% year-over-year gain. More affordable and entry-level homes cannot be driving such a market.
October’s slight shift toward more expensive homes accelerated in November, but the shift was mixed in December and now January (revised). In February, the mid tier of $200,000 to $299,999 hollowed out.
The inventory of new homes remains below the ideal 6.0 months of sales. February’s inventory fell slightly from January’s 5.1 to 5.0.
On a regional basis the South recovered a bit from January’s plunge, but the West suffered a large, and surprising, setback that will make new sales particularly vulnerable in the coming slowdown. February sales in the Northeast soared 47.1% (a second 45%+ month!), the Midwest increased 15.6%, the South gained 6.3%, and the West pulled back a notable -17.2%.
Home Builder Confidence: The Housing Market Index – March, 2020
I ended up calling a top in the Housing Market Index (HMI) when in the last Housing Market Review I claimed “it’s starting to look like builder confidence has finally peaked for a while.” Of course at the time a top just made sense given HMI was at/around all-time highs, and I could not imagine confidence getting any higher. As it turned out, if not for the pandemic, the strong momentum going into the Spring may have actually sent confidence higher still. Instead, confidence will undoubtedly plunge in the next report. The consumer sentiment index plunged to a 4-year low as a leading indicator of where builder confidence will go.
The virus-related decline in HMI started with the March reading as the HMI fell 2 points to 72. Half of the builder responses came after March 4th after which it became increasingly clear the U.S. would be impacted by the pandemic. Sales expectations for the next 6 months showed the most evidence of the trouble to come by dropping 4 points even as the prospective buyer traffic fell just a point. The National Association of Home Builders (NAHB) chose to emphasize that “builder confidence remains strong” even as it acknowledged the impact of the stock market collapse and economic hits from the coronavirus would be reflected in April’s HMI report.
Moreover, builders are increasingly reporting supply disruptions in China which are impacting their work. These disruptions will likely raise the price of homes even as home demand declines in the coming months.
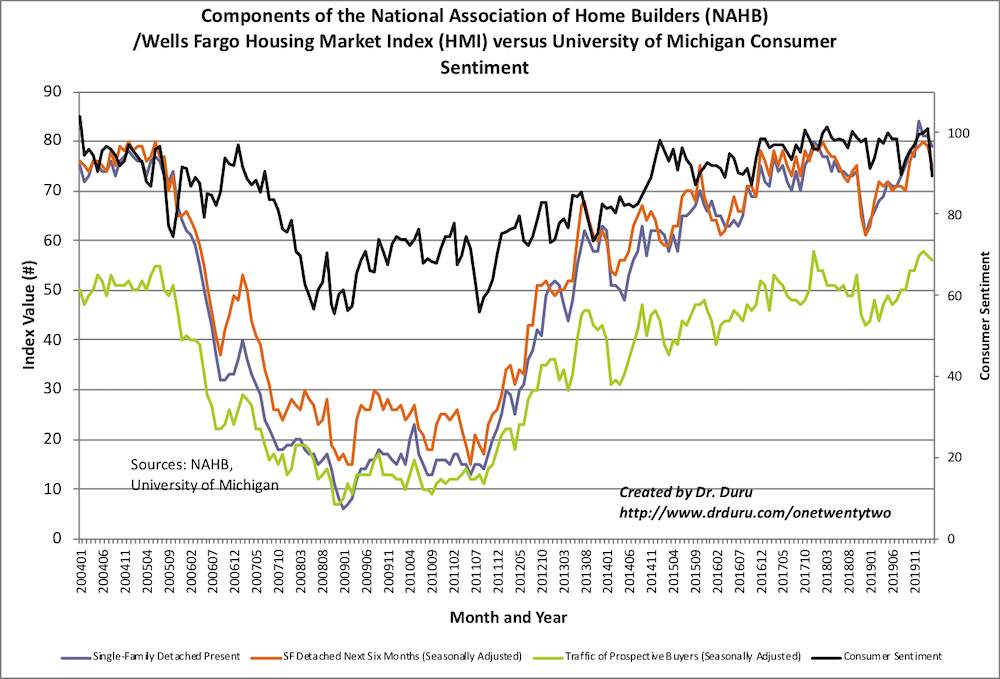
Source: NAHB
On a regional basis, the Midwest was the only region which increased in sentiment. The Midwest declined for the two months prior. The West continued its decline from 86 to 82 and now 79. The Northeast declined from 66 to 64, off its highest level since 2005. The South dropped from 79 to 76, off its highest level since at least 2005. It was fun while it lasted…
Parting thoughts
The costly consequences of housing regulations
This week’s EconTalk podcast featured an excellent interview with Jenny Schuetz of the Brookings Institution titled “Jenny Schuetz on Land Regulation and the Housing Market.” Professor Russ Roberts of George Mason University tackled this often contentious subject with a free market lens. The discussion was a stark reminder of how well-intended protectionism, conflicting political and economic interests, and discrimination have created toxic cocktails of regulation restricting access to better and more affordable housing. It is a “must listen” for anyone who wants a deeper understanding of the dynamics of the housing market and development that are often hidden from view. The podcast covers “zoning, boarding houses, real estate development, and the housing market.”
Be careful out there!
Full disclosure: long ITB call spread and calls