
AT40 = 70.3% of stocks are trading above their respective 40-day moving averages (DMAs) (Day #1 overbought)
AT200 = 59.8% of stocks are trading above their respective 200DMAs (13-month high)
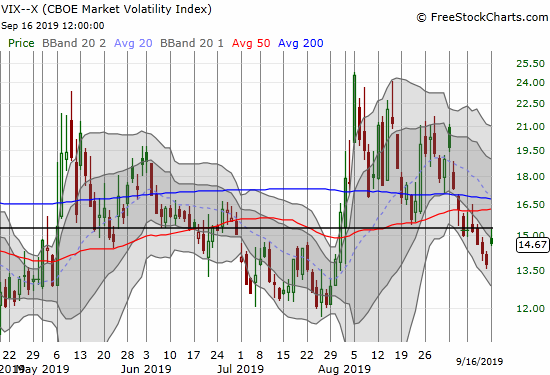
VIX = 14.7
Short-term Trading Call: neutral
Stock Market Commentary
Oil Soars
When I wrote my last Above the 40 post, I knew about the drone strike on Saudi oil facilities. However, I failed to comprehend the full weight of what happened until I casually checked on oil prices later that evening. The currency markets had been relatively tame, so I assumed little of significance had happened. Moreover, early reports quoted the Saudis as claiming they would shut down production for 48 hours simply as a temporary “precaution.” Yet, oil prices were up over 10%!
By the close of U.S. trading on Monday, the United States Oil Fund (USO) gained 12.2% but closed well off its highest point of a 15.0% gain.
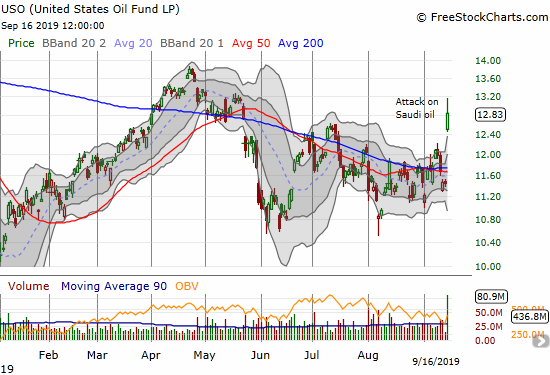
I am not quite sure what to make of the market’s response. In a previous era, I think oil prices would have surged a LOT more. So one side of me thinks oil has a lot higher to go as risks increase of a major escalation of war. Another side of me thinks the market’s reluctance to send oil even higher suggests this whole episode will be over relatively quickly. I want to participate in an extreme move that could either get completely reversed or get even more extreme, so I decided to go the hedged route by buying December call options and October put options on USO.
A Nudge Into Overbought Conditions
Trading in the stock market definitely did not unfold as I would have expected.
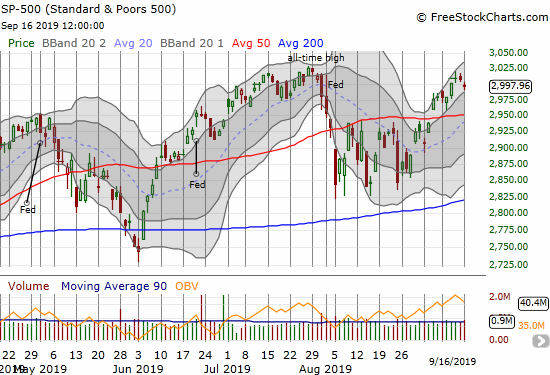
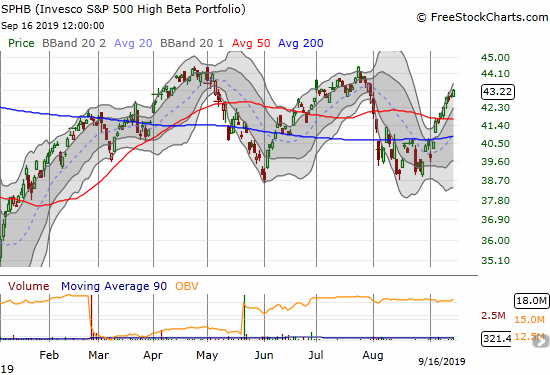
The GAINS in the stock market were enough to nudge the market into overbought territory. AT40 (T2108), the percentage of stocks trading above their respective 40-day moving averages (DMAs), managed to eke out a close above the 70% overbought threshold. It was a surprising bullish divergence featuring an S&P 500 (SPY) losing fractionally and the Invesco S&P 500 High Beta Portfolio (SPHB) gaining almost 1%.
What Worry?
The volatility index (VIX) barely responded to the troubles in the oil fields. At first I thought I would regret not rolling into a fresh tranche of call options on VIXY on Friday. Needless to say, I jumped right into those call options on a day that VIXY only gained 1.6%. The grudging response of volatility said volumes about the lack of concern in financial markets about the devastation in Saudi Arabia and the potential for a rapidly escalating conflict in the Persian Gulf region.
Rotate Back to Momentum….Of Course!
Momentum stocks were the most fascinating part of the trading day. These stocks closed out the previous week with various displays of weakness. On this day, they caught major bids. Perhaps buyers locked themselves into buying programs over the weekend. It was as if rising oil and gas prices will somehow help expensive, high-flying software stocks. In reality, the pop was likely just the result of a trigger finger rotation of money out of oil-sensitive stocks into stocks deemed immune from oil troubles. For example, the SPDR S&P Retail ETF lost 1.2% on the day.
While the gain in SPHB is exactly the move I claimed could push the stock market into overbought status, I am not confident THIS kind of rotation in an overt display of complacency in the face of clear and present danger is sustainable. I will now be even more eager to go short the market if AT40 falls from overbought conditions and drops below 65% or so. The Federal Reserve meeting on Wednesday now looms even larger as a pivot point for selling the news…
Stock Chart Reviews – Bearish
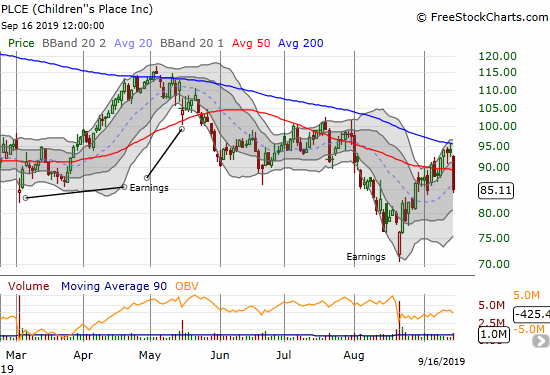
Children’s Place (PLCE)
Children’s Place (PLCE) makes sense as a victim of money rotation. PLCE delivered a poor earnings report last month. “Bargain-shopping” buyers took the stock nearly straight up after that initial post-earnings loss to near 3 1/2 year lows (I wish I had enough residual PLCE bullishness to join that run-up!). PLCE lost 9.1% on the day in one fell swoop and returned to bearish territory with a 50DMA breakdown that included a rejection from 200DMA resistance.
Stock Chart Reviews – Bullish
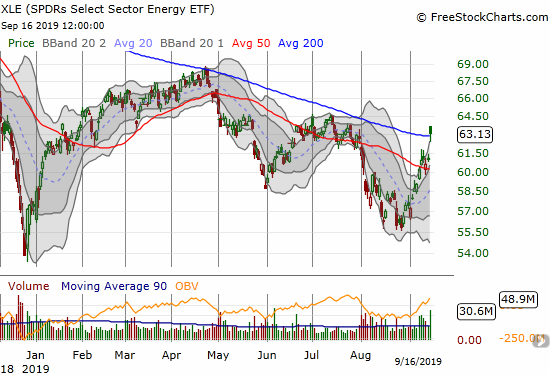
SPDRS Select Energy ETF (XLE)
The SPDRS Select Energy ETF (XLE) closed above downtrending 200DMA resistance for the first time in 11 months. XLE confirmed this resistance in April and came close several times in July. XLE could easily fall right back under its 200DMA, but I would stay bullish until/unless it closed below its 50DMA.
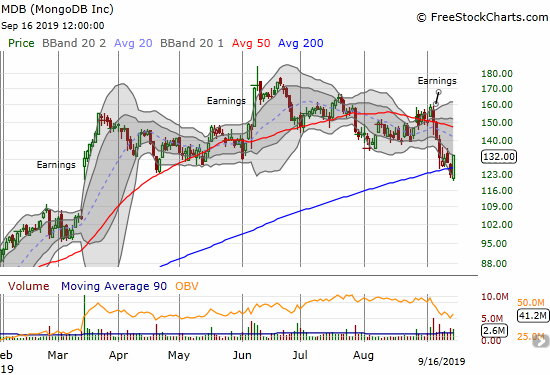
MongoDB (MDB)
MongoDB is one of many examples of high-flying software (in this case cloud/database) stocks catching major bids in the face of the oil troubles. MDB gained 7.1% for a 200DMA breakout. I tend to buy into such quick recoveries from 200DMA breakdowns, but I already had a hedged position in MDB long shares and a put. I might add shares if the stock confirms the fresh buying interest with another positive close.
— – —
FOLLOW Dr. Duru’s commentary on financial markets via email, StockTwits, Twitter, and even Instagram!
“Above the 40” uses the percentage of stocks trading above their respective 40-day moving averages (DMAs) to assess the technical health of the stock market and to identify extremes in market sentiment that are likely to reverse. Abbreviated as AT40, Above the 40 is an alternative label for “T2108” which was created by Worden. Learn more about T2108 on my T2108 Resource Page. AT200, or T2107, measures the percentage of stocks trading above their respective 200DMAs.
Active AT40 (T2108) periods: Day #171 over 20%, Day #10 over 30%, Day #22 over 40%, Day #6 over 50%, Day #5 over 60%, Day #1 over 70% (Day #1 overbought, ending 127 days under 70%)
Daily AT40 (T2108)
")
Black line: AT40 (T2108) (% measured on the right)
Red line: Overbought threshold (70%); Blue line: Oversold threshold (20%)
Weekly AT40 (T2108)

*All charts created using FreeStockCharts unless otherwise stated
The T2108 charts above are my LATEST updates independent of the date of this given AT40 post. For my latest AT40 post click here.
Be careful out there!
Full disclosure: long VIXY calls, long MDB shares and long put option, long USO calls and puts
*Charting notes: FreeStockCharts stock prices are not adjusted for dividends. TradingView.com charts for currencies use Tokyo time as the start of the forex trading day. FreeStockCharts currency charts are based on Eastern U.S. time to define the trading day.