
AT40 = 42.2% of stocks are trading above their respective 40-day moving averages (DMAs)
AT200 = 46.0% of stocks are trading above their respective 200DMAs
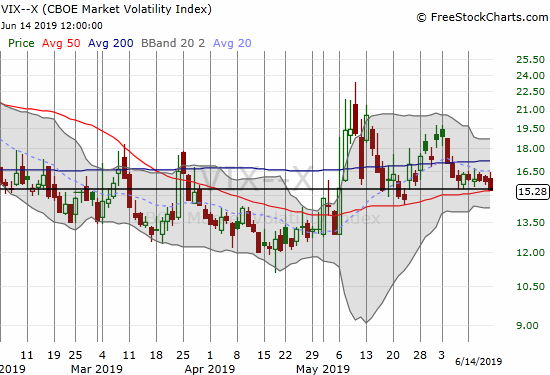
VIX = 15.3
Short-term Trading Call: neutral
Stock Market Commentary
After two bearish fades to start the week, the stock market dribbled along. Now the market waits for word on news bad enough to motivate the Federal Reserve to promise rate cuts. This eager anticipation is the main narrative propping up the stock market.
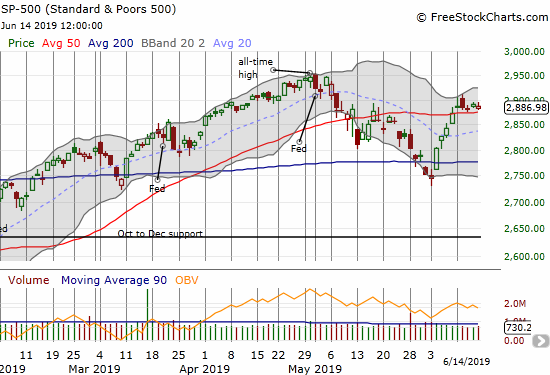
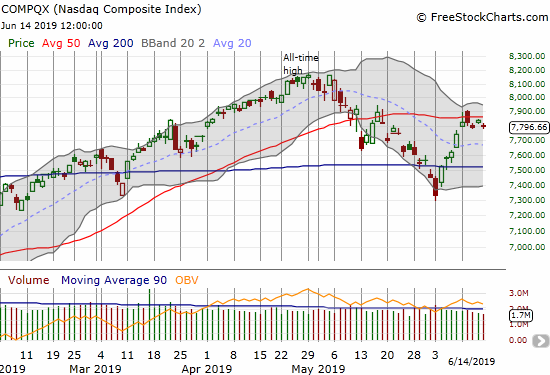
The S&P 500 (SPY) and the NADSAQ (COMPQX) followed similar paths for the week. The former loitered along the top side of its 50DMA, the latter loitered along the underbelly of its 50DMA.
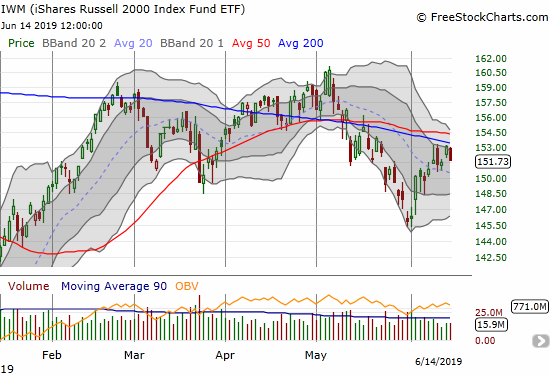
The iShares Russell 2000 ETF (IWM) continued to lead the bearish case by ending the week with a 0.9% loss and another failure under 200DMA resistance.
AT40 (T2108), the percentage of stocks trading above their respective 40DMAs, held a slight upward bias for the week moving from 38.9% at the end of the prior week to 42.2%. My favorite technical indicator sits right in the middle of its equivalent of no-man’s land.
The volatility index (VIX) finally fell into its 15.35 pivot. The VIX underlined the market’s overall slow motion behavior. I used Friday to double down on my call options in Ultra VIX Short-Term Futures ETF (UVXY). The market is setting itself up for potential disappointment with the Fed meeting given its lofty expectations for almost three rate cuts this year, so I want to have UVXY call options in place. Moreover, the market has had a bias toward negative reactions to Fed meetings since 2018.
Stock Chart Reviews – Bearish
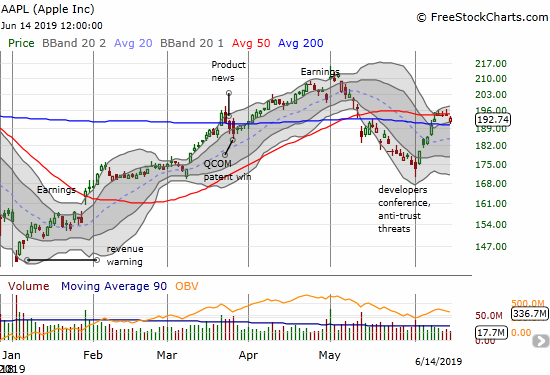
Apple (AAPL)
The posture in Apple (AAPL) flipped again; the stock fell from 50DMA resistance on Friday. My calendar call spread still closed out at my profit target and reminded me of the power and versatility of this options setup. I did not refresh my weekly call positioning (leaving me with my put spread backstop), but I will look to do so on Monday. If AAPL pulls back on Monday I will buy $192.50 or $195 weekly call options. If the stock rallies, I will go for another weekly calendar call spread, probably with a $197.50 strike.
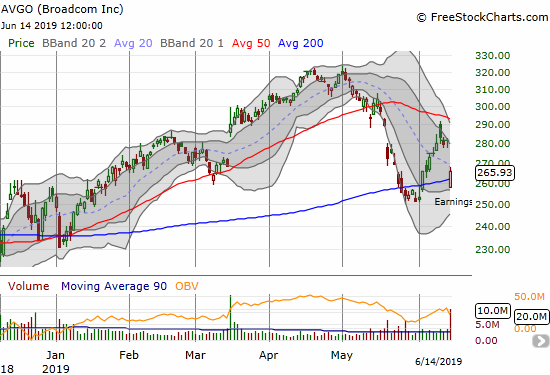
Broadcom (AVGO)
“… in the second half, we had expected a recovery. However, while enterprise and mainframe software demand remained stable, particularly in North America and Europe, with respect to semiconductors, it is clear that the U.S./China trade conflict, including the Huawei export ban, is creating economic and political uncertainty and reducing visibility for our global OEM customers.
Broadcom Inc. (AVGO) CEO Hock Tan on Q2 2019 Results – Earnings Call Transcript from Seeking Alpha
As a result, demand volatility has increased and our customers are actively reducing inventory levels to manage risks. This leads us to believe the second half of 2019 will be more in line with the first half as opposed to the previously expected recovery…
This quote summarizes the importance of the disappointing earnings report from Broadcom (AVGO). I am surprised the stock bounced back from its 200DMA breakdown. I do not expect a relief rally strong enough to fill the post-earnings gap down. I will fade such a move. A close below the May low around $250 would confirm the bearish breakdown.
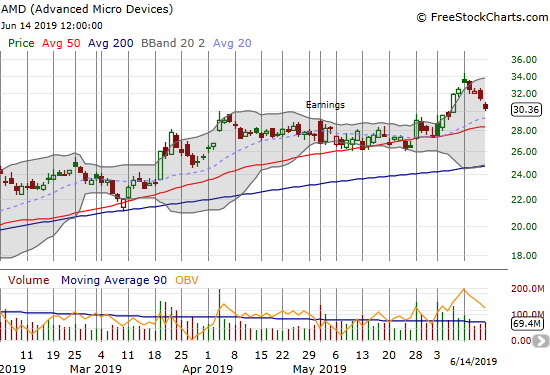
Advanced Micro Devices (AMD)
I am going out on a limb to call Advanced Micro Devices (AMD) (short-term) bearish. The stock caught my attention again with a gap up to a new all-time high that was immediately followed by 4 straight days of selling. The stock looks like it experienced a blow-off top. With Broadcom (AVGO) flagging warnings for the semiconductor industry, I felt more convinced in the risk/reward of trying puts again. I am keeping the short-term target modest at a test of rising 50DMA support, but I think AMD is due for a 200DMA retest.
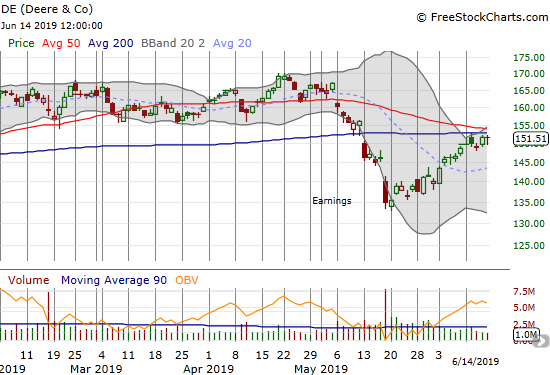
Deere & Company (DE)
I am still waiting for a good entry for buying put options on Deere & Company (DE). With the stock struggling with converged resistance from its 50 and 200DMAs, the stock sits at a critical juncture. I am staying patient with a bearish entry target below last week’s low. Note that a close above converged resistance would be very bullish for DE.
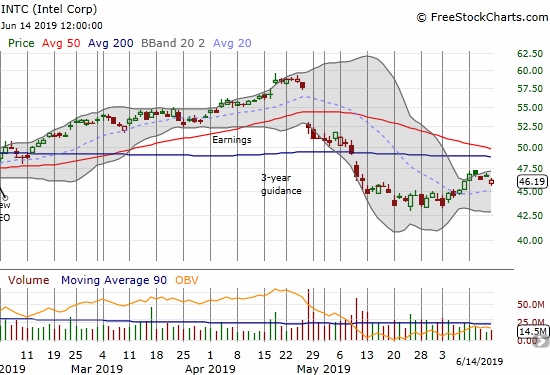
Intel (INTC)
I sold my last tranche of Intel (INTC) between-earnings call options once the stock traded above its upper Bollinger Band (BB). It was a timely sale as the stock pulled back from the over-stretched conditions. INTC also sold off a bit in sympathy with AVGO. I am still sitting on my earlier tranches of call options. INTC stays in a bearish posture as long as it trades below its converging 50 and 200DMAs. I will only buy more call options when sufficient upside potential exists between the price at that time and this resistance level.
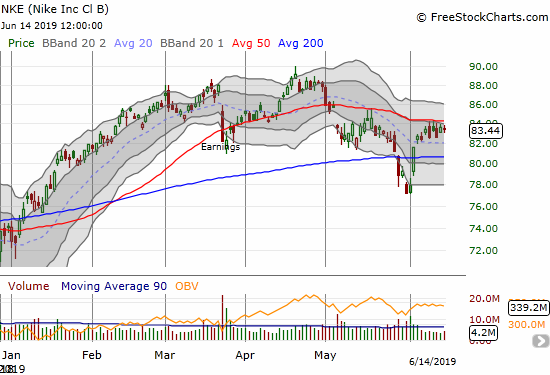
Nike (NKE)
Earnings are coming up for Nike (NKE) on June 27th. After a strong bounce off the May low that saved the stock from a 200DMA breakdown, buyers quickly lost interest. All week, NKE tried and failed to break through overhead 50DMA resistance. The technicals look bearish enough for a return to 200DMA support. CNBC’s Options Action gave a convincing extended bear case based on valuation and post-earnings reactions over the last 8 quarters. The Jul/Sep $77 calendar put spread looks like a cheap way to play the likely downside scenarios.
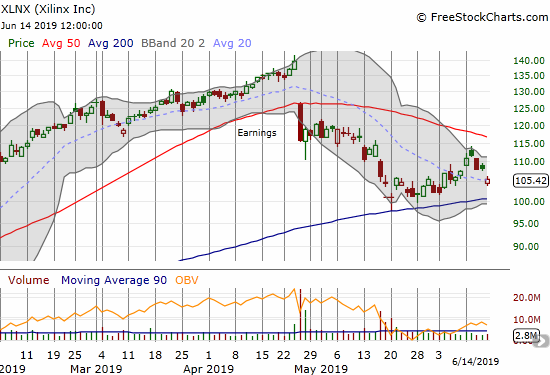
Xilinx (XLNX)
I was hopeful when I bought Xilinx (XLNX) shares into the post-earnings sell-off; I ignored the bearish implications of a clean 50DMA breakdown. I was even more hopeful when I doubled down on the test of 200DMA support. THAT trade worked out as my total position stretched into the green at the beginning of last week. Instead of selling the shares, I decided to sell a June $115 call option against my position. With the selling in sympathy with AVGO, XLNX looks set to retest 200DMA support. While I am bullish on the prospects of support holding again, I am less optimistic that XLNX can break through 50DMA resistance, especially now that the trendline is in decline.
Stock Chart Reviews – Bullish
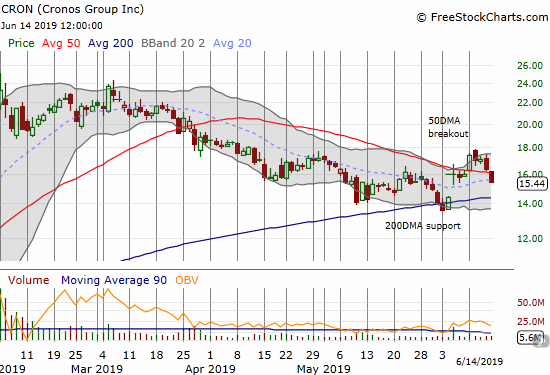
Cronos Group (CRON)
Cronos Group (CRON) quickly ended the 50DMA breakout that made me bullish on the stock. I am sticking with the bullish call until/unless the stock confirms a 200DMA breakdown. For good measure, I doubled down on my July call options (no wonder my first tranche looked so “cheap”!).
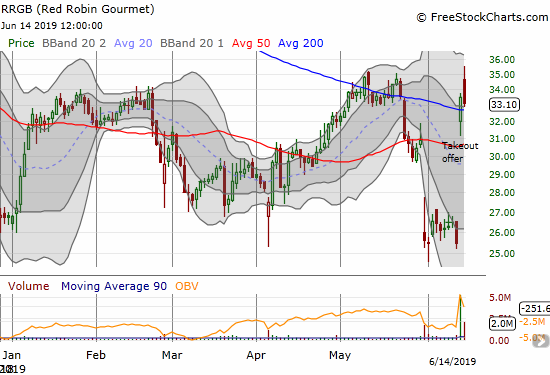
Red Robin Gourmet Burgers (RRGB)
At the end of May I was lamenting the lack of an entry point in Red Robin Gourmet Burgers (RRGB). Vintage, with an existing 11% stake in the company at around $30/share, threatened to replace the entire RRGB board in parallel with an offer to buy out the company at $40/share. The market does not currently believe $40/share is achievable. However, I decided to jump in after watching Karen Finerman, my favorite commentator on CNBC’s Fast Money, lay out the case for buying RRGB. I bought shares instead of call options given I have no feel for how long this struggle could take. Moreover, I think this investor activism marks a bottom for the stock, so I will accumulate more shares on any fortuitous pullbacks.
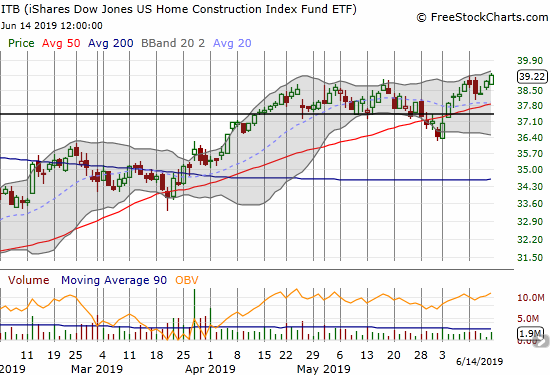
The iShares Dow Jones Home Construction ETF (ITB)
Surprisingly, the bullish momentum continues to grow in the iShares Dow Jones Home Construction ETF (ITB). If the market develops a positive response to the Federal Reserve meeting, I will devise a fresh (bullish) trade on ITB despite the seasonal top I am currently expecting. ITB is even out-performing the S&P 500 again.
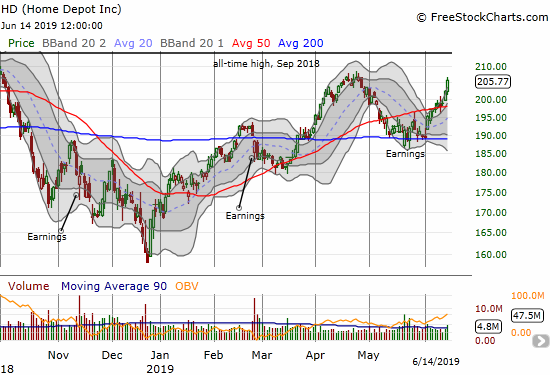
Home Depot (HD)
Home Depot (HD) is playing catch-up. The stock confirmed 200DMA support with its 50DMA breakout which itself was confirmed with follow-on buying. The April and 2019 high looks formidable, but the current momentum should prove sufficient to smash through resistance…all else being equal.
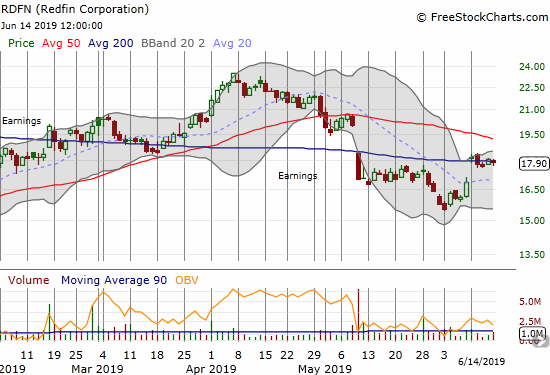
Redfin (RDFN)
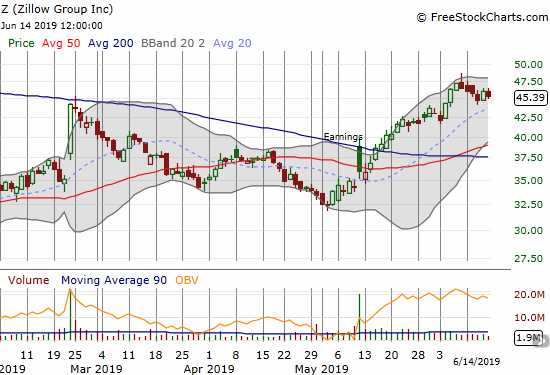
My long Redfin (RDFN) versus short Zillow Group (Z) pairs trade quickly became a winner with an analyst upgrade that gapped RDFN into its 200DMA resistance. With July expirations in play, I am comfortable holding for now. While RDFN bearishly trades below declining 50DMA resistance, I like the stock’s chances based on the strong response to the analyst upgrade.
Zillow Group (Z) (ZG)
Zillow Group (Z) moved higher soon after I bought put options as a part of the pairs trade mentioned above. The stock looks like it is resting for the next leg higher. The uptrending 20DMA makes this stock quite bullish.
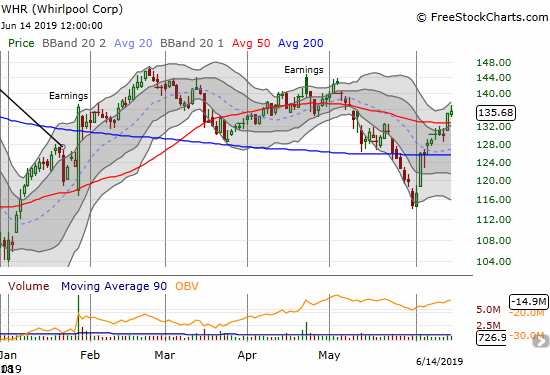
Whirlpool (WHR)
Whirlpool (WHR) took me completely by surprise. I thought May’s 200DMA breakdown would be long-lasting. Instead, the stock took just two trading days to bounce from its May low to a (marginal) close above its 200DMA. Last week’s 50DMA breakout puts WHR in a bullish position even with overhead resistance awaiting from the post-earnings highs.
— – —
FOLLOW Dr. Duru’s commentary on financial markets via email, StockTwits, Twitter, and even Instagram!
“Above the 40” uses the percentage of stocks trading above their respective 40-day moving averages (DMAs) to assess the technical health of the stock market and to identify extremes in market sentiment that are likely to reverse. Abbreviated as AT40, Above the 40 is an alternative label for “T2108” which was created by Worden. Learn more about T2108 on my T2108 Resource Page. AT200, or T2107, measures the percentage of stocks trading above their respective 200DMAs.
Active AT40 (T2108) periods: Day #109 over 20%, Day #9 over 30%, Day #2 over 40% (overperiod), Day #28 under 50% (underperiod), Day #28 under 60%, Day #71 under 70%
Daily AT40 (T2108)
")
Black line: AT40 (T2108) (% measured on the right)
Red line: Overbought threshold (70%); Blue line: Oversold threshold (20%)
Weekly AT40 (T2108)

*All charts created using FreeStockCharts unless otherwise stated
The T2108 charts above are my LATEST updates independent of the date of this given AT40 post. For my latest AT40 post click here.
Related links:
The AT40 (T2108) Resource Page
You can follow real-time T2108 commentary on twitter using the #T2108 or #AT40 hashtags. T2108-related trades and other trades are occasionally posted on twitter using the #120trade hashtag.
Be careful out there!
Full disclosure: long AAPL put spread, long UVXY calls, long RDFN calls, long Z puts, long INTC calls, long CRON calls, long XLNX shares and short a call, long AMD puts
*Charting notes: FreeStockCharts stock prices are not adjusted for dividends. TradingView.com charts for currencies use Tokyo time as the start of the forex trading day. FreeStockCharts currency charts are based on Eastern U.S. time to define the trading day.