
AT40 = 61.9% of stocks are trading above their respective 40-day moving averages (DMAs) (near 5-month high)
AT200 = 23.2% of stocks are trading above their respective 200DMAs (1-month high)
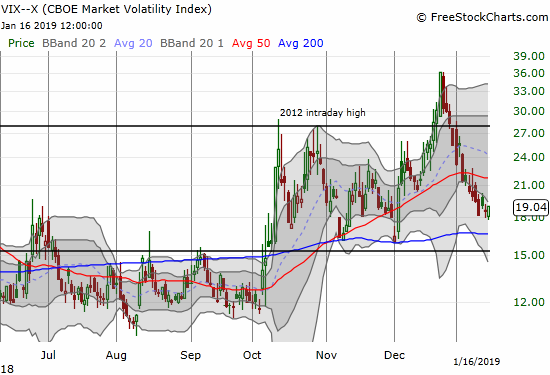
VIX = 19.0
Short-term Trading Call: cautiously bullish
Commentary
The signs of exhaustion in the major indices have given way to more and more breakouts. Most importantly, AT40 (T2108), the percentage of stocks trading above their 40-day moving averages (DMAs), sprang back to life after a small pause on Monday. AT40 closed at 61.9% and, incredibly, is within sight of hitting overbought trading conditions (above 70%). With so many stocks still below their 200DMAs – AT200 (T2107) – is only at 23.2%, I doubt the market will have enough energy to push through and maintain overbought levels.
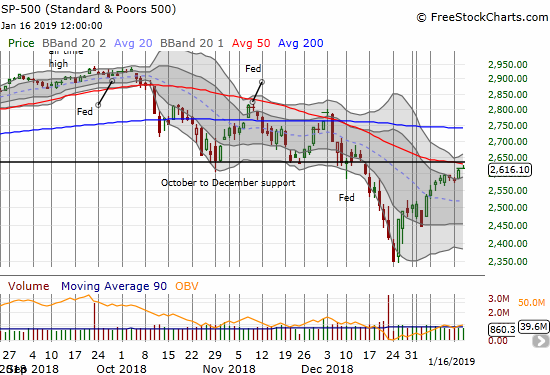
After a fresh breakout on Tuesday, the S&P 500 (SPY) challenged and faded away from its 50DMA. At 2616.10, the index closed right around the same level that served as support in October and November. This is “close enough” for me to lock in profits in my shares of ProShares Ultra S&P500 (SSO).
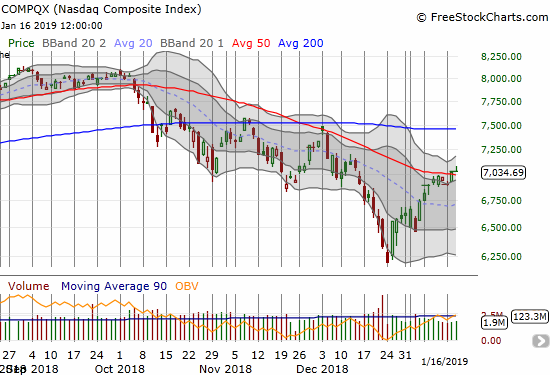
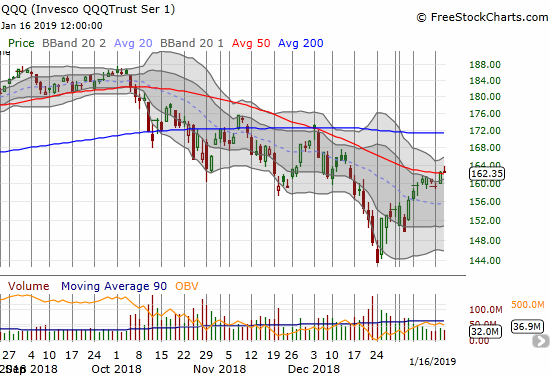
The NASDAQ and the Invesco QQQ Trust (QQQ) seemed to confirm exhaustion on Monday with a small gap down. I rushed in to buy puts on QQQ as planned. Both tech-laden indices turned right around on Tuesday for 50DMA breakouts. Wednesday’s positive open quickly flipped me into QQQ call options. I had profits by the high of the day, but I decided to keep holding. Those profits went poof after sellers faded QQQ back to a flat close on the day. The 50DMA breakout for QQQ looks more precarious than the NASDAQ’s.
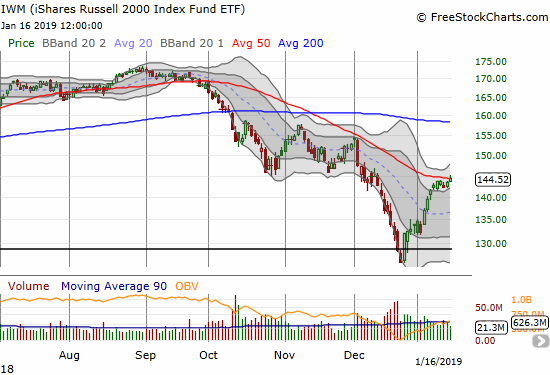
The iShares Russell 2000 ETF (IWM) fell behind the major indices as it churned a bit under 50DMA resistance. Today’s 0.8% gain put IWM above the hump.
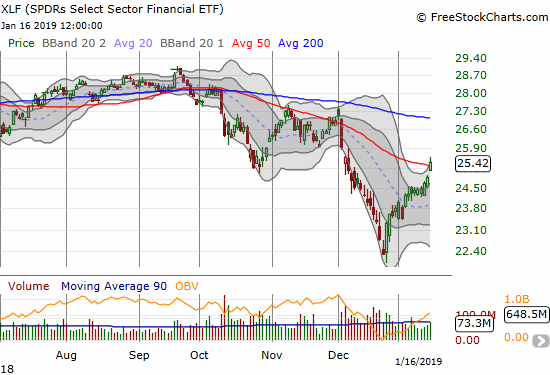
Financials have quickly transformed from anchor to rocket ship. The Financial Select Sector SPDR ETF (XLF) out-performed with a 2.1% gain and closed above its 50DMA for the first time since December 3rd. I loaded up on weekly calls in XLF on Monday as soon as I saw the bullish reaction to Citigroup’s earnings (more below). Given the single-stock reaction and the potential for more this week, I was surprised at the relatively low price of the call options. The calls even declined a bit on Tuesday. Today was the big validation. I took profits a bit early, but I will not complain about a double.
Despite the good cheer, the volatility index, the VIX, managed to gain 2.4%. The move looks like a blip given the on-going downtrend from the last highs. Still, this contrary move caught my attention.
The stock market swept away my skepticism about punching through 50DMA resistances on the major indices (the S&P 500 is the final proofpoint!). Now, my skepticism sets its sights on the overbought threshold. I am quite surprised the stock market reached these heights so soon.
CHART REVIEWS
Citigroup (C)
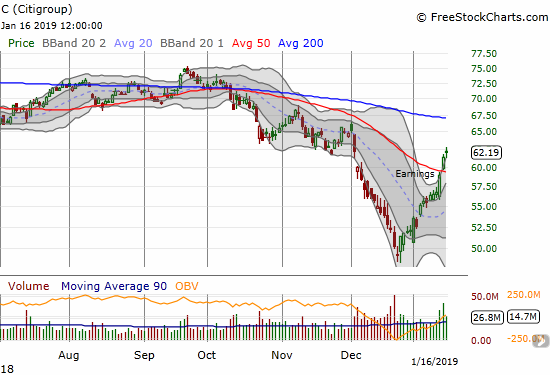
Citigroup is the earnings hero of the week. The bank stock jumped 4.0% in reaction to earnings. The buying picked right up the next day and delivered a 50DMA breakout along with bullish follow-through. At least for now, the financials are breathing fresh life into this rally from historic oversold conditions.
Goldman Sachs (GS)
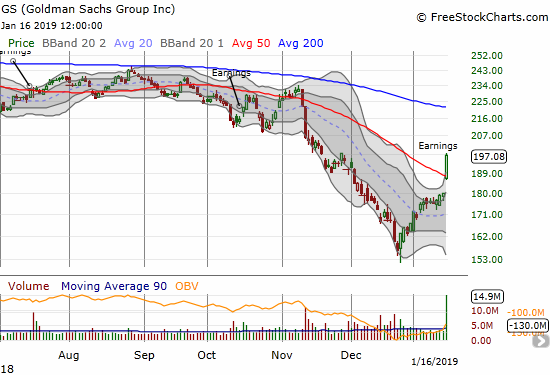
I fortuitously dropped GS from my shrinking list of stocks to use as hedges against bullishness. I did not flip bullish on the stock as previous bearishness was hard to suppress. Now, GS is in its most bullish position in a very long time. The stock soared 9.5% on an earnings-inspired 50DMA breakout. GS is now a buy on the dips with a strict stop below 50DMA support.
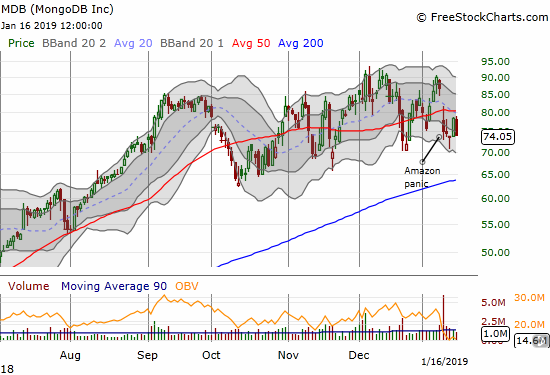
MongoDB (MDB)
Last week, MDB became the latest victim to an Amazon.com (AMZN) panic. The stock broke down below its 50DMA and is still struggling to recover. On today’s 5.6% loss I decided to try out a calendar call spread as a play on panic abatement. This is my first test of this trade since the stock market plunged into bear market trading style. MDB is particularly interesting given its relative resilience through the last three months of bearish trading action in the stock market.
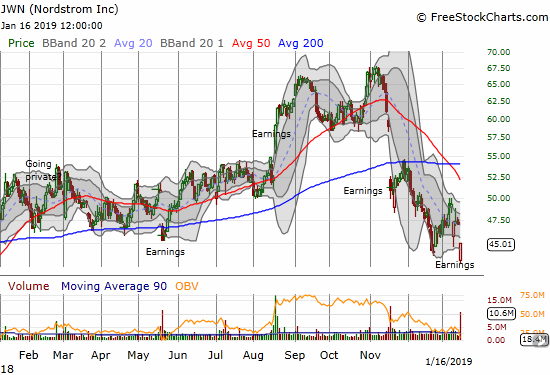
Nordstrom (JWN)
I was very tempted to pile back into JWN on the heels of its post-earnings disappointment. The stock is once again below its price where privatization talks were active, but the stock is also trading at 13-14 month lows. The double peaks from September and November look like the confirmed tops of a stock slowly breaking down.
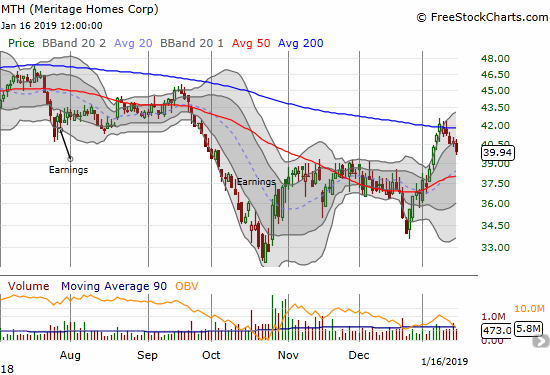
Meritage Homes (MTH)
MTH started this week by confirming its failure to break through 200DMA resistance. That raised a flag to me on my home builder seasonal trades. I will be taking profits on all these stocks and leave just my (residual) call options on iShares US Home Construction ETF (ITB) (which lost 1.0% on the day).
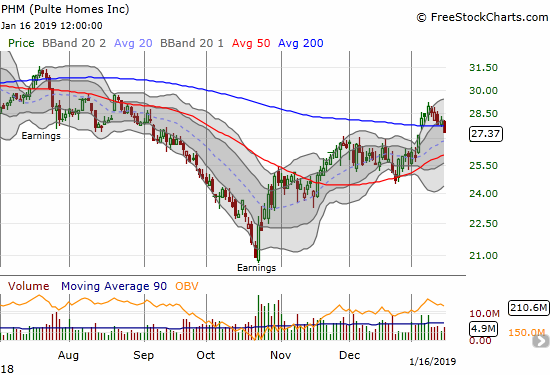
Pulte Homes (PHM)
PHM confirmed for me it is time to take profits on my seasonal home builder trades. The stock lost 2.5% after breaking down below its 200DMA. The next question is whether home builders are once again a leading indicator for a coming pullback in the stock market. A successful test of 50DMA support would be a bullish refresher.
— – —
FOLLOW Dr. Duru’s commentary on financial markets via email, StockTwits, Twitter, and even Instagram!
“Above the 40” uses the percentage of stocks trading above their respective 40-day moving averages (DMAs) to assess the technical health of the stock market and to identify extremes in market sentiment that are likely to reverse. Abbreviated as AT40, Above the 40 is an alternative label for “T2108” which was created by Worden. Learn more about T2108 on my T2108 Resource Page. AT200, or T2107, measures the percentage of stocks trading above their respective 200DMAs.
Active AT40 (T2108) periods: Day #9 over 20%, Day #7 over 30%, Day #6 over 40%, Day #5 over 50%, Day #1 over 60% (overperiod ending 94 days under 60%), Day #150 under 70%
Daily AT40 (T2108)
")
Black line: AT40 (T2108) (% measured on the right)
Red line: Overbought threshold (70%); Blue line: Oversold threshold (20%)
Weekly AT40 (T2108)

*All charts created using freestockcharts.com unless otherwise stated
The T2108 charts above are my LATEST updates independent of the date of this given AT40 post. For my latest AT40 post click here.
Related links:
The AT40 (T2108) Resource Page
You can follow real-time T2108 commentary on twitter using the #T2108 or #AT40 hashtags. T2108-related trades and other trades are occasionally posted on twitter using the #120trade hashtag.
Be careful out there!
Full disclosure: long SSO, long MDB calendar call spread, long PHM, long QQQ calls and puts
*Charting notes: FreeStockCharts.com stock prices are not adjusted for dividends. TradingView.com charts for currencies use Tokyo time as the start of the forex trading day. FreeStockCharts.com currency charts are based on Eastern U.S. time to define the trading day.