

Housing Market Intro and Summary
Across builder stocks, construction activity, permits, new home sales, and existing home sales, the same pattern persists: the housing market has yet to achieve the escape velocity needed to break free from its multiyear ranges. A month ago, the housing market and related stocks looked like they were clinging to a cliff of bad news. Little has changed since then even with the passage of historic legislation to make homes more available and affordable in America.
Here is a summary for May’s housing market update:
- The housing market showed no escape from its multiyear trading ranges as housing starts, permits, and new home sales remained constrained despite modest improvements in builder sentiment.
- Homebuilder stocks continued to significantly underperform the broader market, with the iShares US Home Construction ETF (ITB) failing to break out of its bear market and struggling below key technical resistance.
- Builder confidence improved in May as all major Housing Market Index components increased, suggesting stabilization but not a sustained recovery.
- New home sales declined in April, while permits remained near three-year lows, indicating limited momentum for future construction activity.
- Existing home sales posted only a marginal gain despite improved affordability metrics.
- California housing activity strengthened in April, supported by higher end demand.
- The historic 21st Century ROAD to Housing Act advanced efforts to increase housing supply and affordability.
- Rising mortgage rates in May threatened to reverse recent affordability improvements and hold out the prospect of no escape from the current malaise.
Housing Stocks
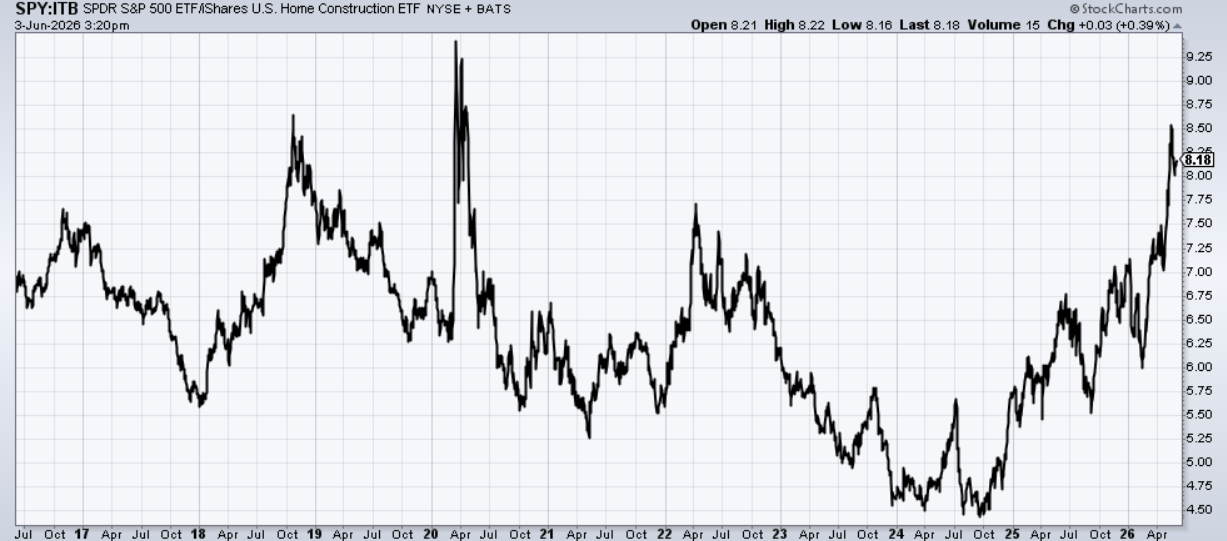
The iShares US Home Construction ETF (ITB) failed to breakout of its bear market despite a sharp rally in late April. A sell-off in the first half of May took the ETF of home builders down to levels last seen in March, 2025. The passage of a Federal housing affordability bill (more details in the “home closing thoughts” section) revived interest in builders just in time to prevent a major multi-year breakdown. Still, the upside for ITB looks very limited as long as interest rates remain elevated with no prospects of rate cuts anywhere in sight. Home builders have insufficient momentum to reach “escape velocity” to sustain an end to the ongoing bear market. The current struggle at resistance from the 50-day moving average (DMA) (the red line) is telling.
")
ITB’s under-performance versus the S&P 500 has become quite extreme, reaching levels last seen in the early weeks of the COVID-19 pandemic.
While trading in the stocks of home builders looks bleak, a burst of good news came in the form of another acquisition. Berkshire Hathaway (BRK.A) (BRK.B) purchased Taylor Morrison Home (TMHC) for $72.50 in cash. I am quite surprised given TMHC is selling out during a time builders are priced near or at recession-like valuations. Even at $72, TMHC has a rock bottom valuation of 10.6 P/E GAAP, 0.9 price/sales, and 1.1 price/book. Moreover, the company has/had big ambitions as one of the nation’s largest builders. Finally, the offer price stops short of bringing TMHC back to its all-time high set in late 2024.
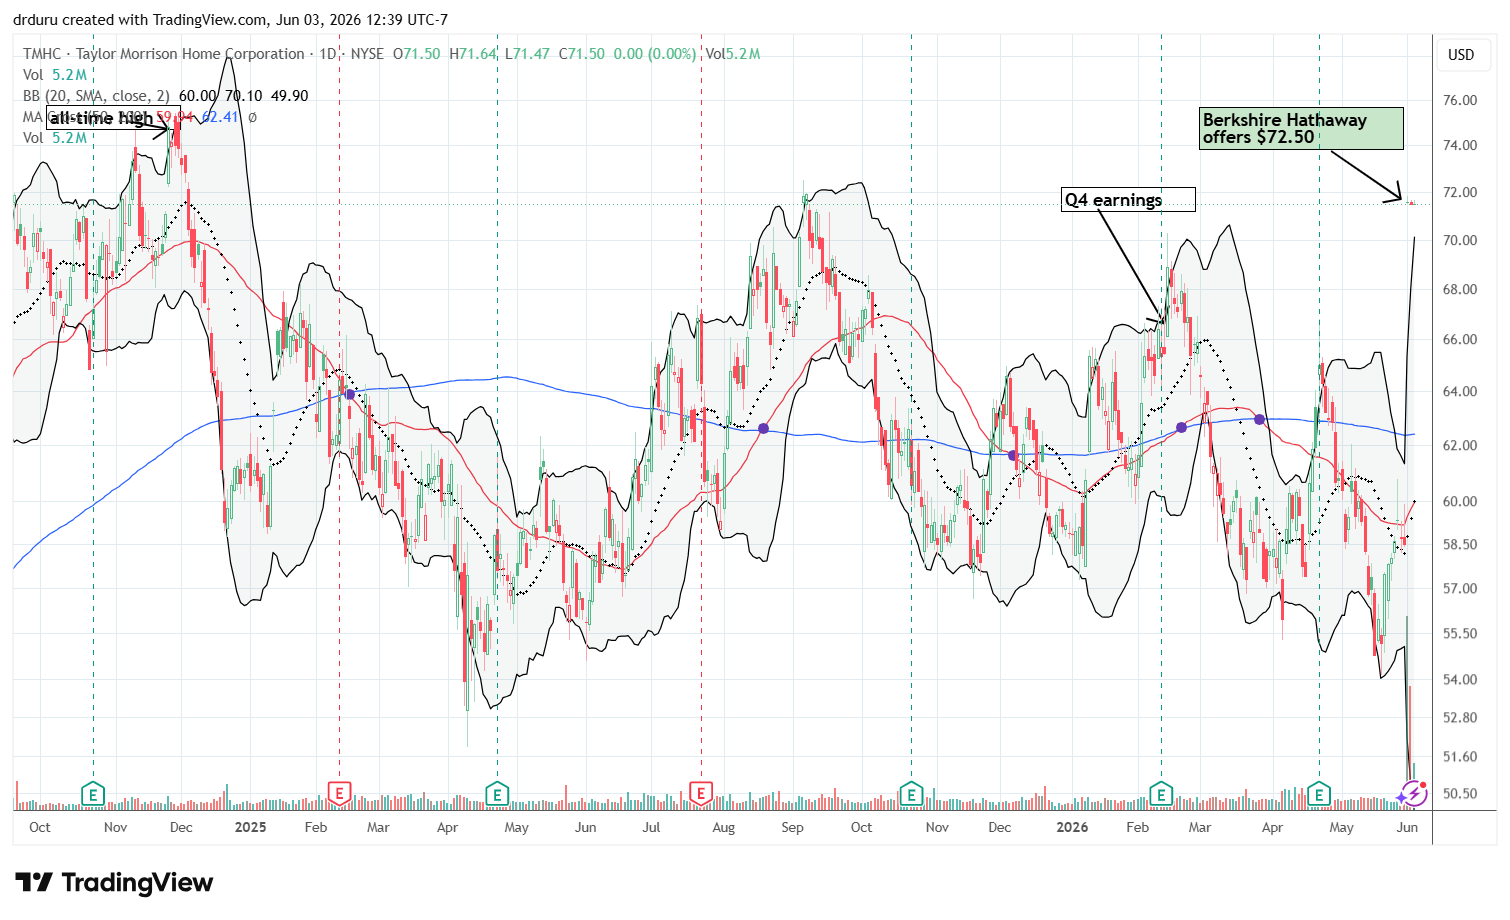
Fortunately, I kept my large position in TMHC as part of the last seasonal trading on homebuilders. So while I brought the seasonal trade to an end back in March, TMHC became one of my most successful trades since I started this strategy over 10 years ago. I took profits the same day of the announcement.
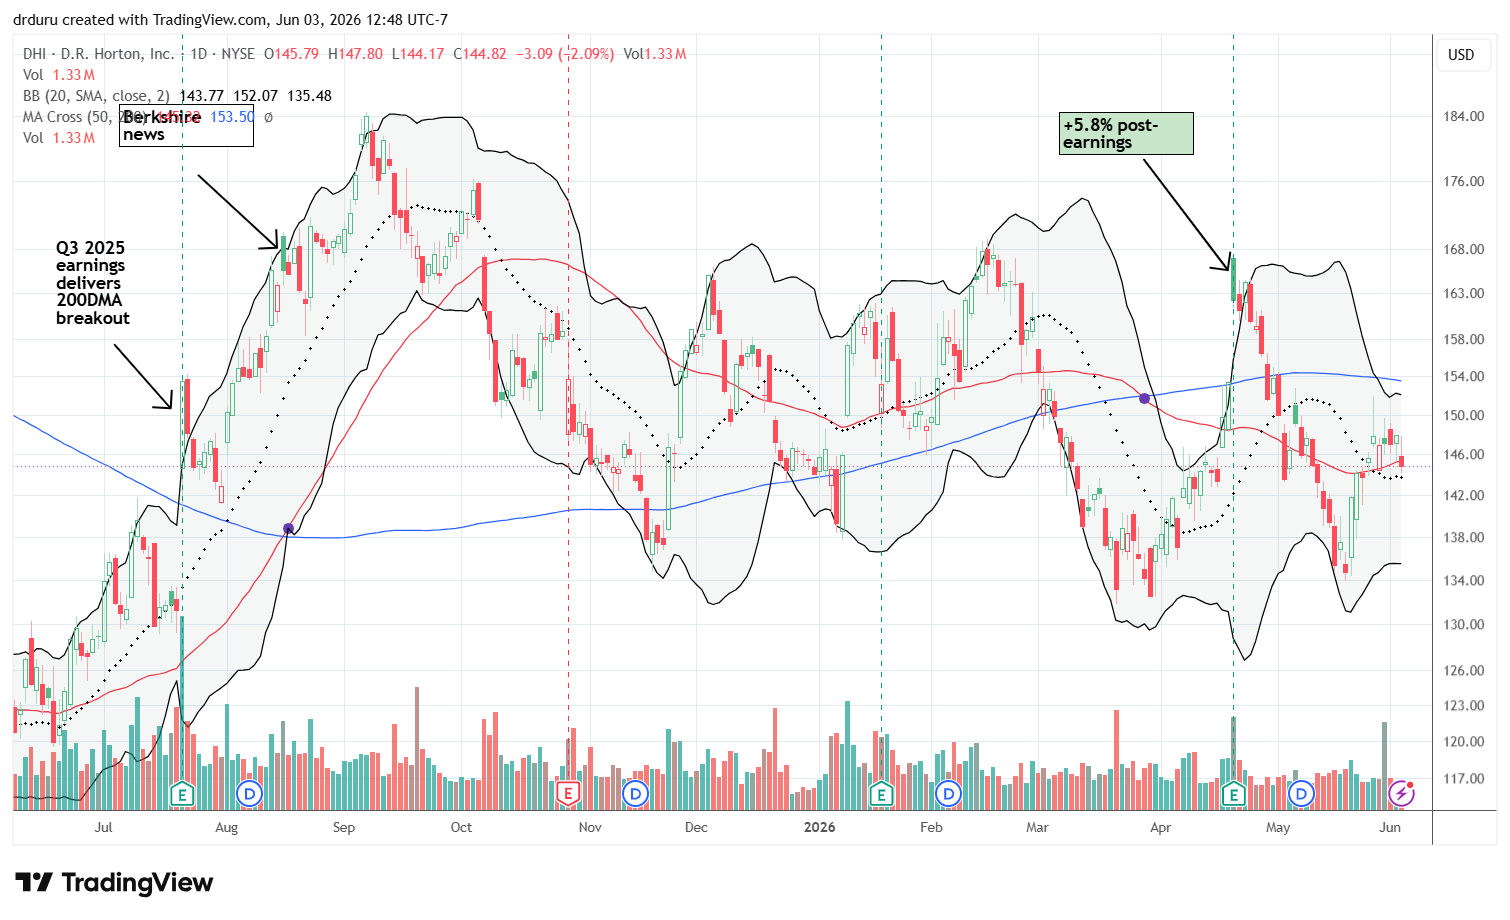
This acquisition and the on-going structural issues in the industry mean that the seasonal trade’s relevance has greatly declined. The trend for home builders is toward consolidation. Thus, I am transitioning to becoming a “value” buyer no matter the season. For example, after seeing builders barely respond to the acquisition, I still bought shares in D.R. Horton (DHI). This builder is a natural first target given BRK purchased shares in DHI last year. Since the news was released on August 15, 2025, the shares have traded mostly lower. I will continue to buy alongside BRK.
Housing Data
Home Builder Confidence: The Housing Market Index – May, 2026
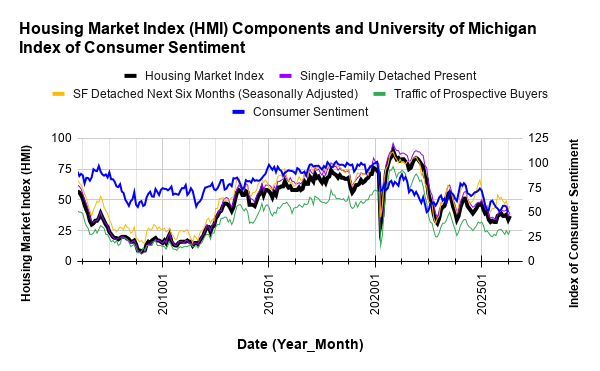
The National Association of Home Builders (NAHB)/Wells Fargo Housing Market Index (HMI) increased 3 points from 34 in April to 37 in May. The NAHB undersold the jump by calling the gain “modest” and choosing to emphasize economic uncertainty and affordability issues.
All three of the major HMI indices posted gains in May. The “Single-Family: Present” component rose 3 points to 40. The “Single-Family: Next Six Months”, a measure of expectations for future sales, increased 3 points to 45. The “Traffic of Prospective Buyers” posted a 3-point gain to 25. Thus across the board builders improved their perspective and outlooks on the market.
/Wells Fargo Housing Market Index (HMI) and the University of Michigan Index of Consumer Sentiment")
Source for data: NAHB and the University of Michigan
While the May consumer sentiment data remains pending, the rebound in builder sentiment suggests consumer sentiment could soon bottom.
The dynamics of price incentives were mixed in May. The share of builders cutting prices decreased from 36% in April to 32% in May. The average price reduction increased to 6% from 5%. The use of sales incentives was 61% in May, up from 60% in April, and extending the streak at or above 60% to 14 straight months.
Each region made gains in May. The Northeast region jumped to its second highest level of the year, going from 39 to 44. The Midwest tied its high for the year set at 45 in March, completing a large swing from 39 as the low of the year set in April. The South has been relatively stable for the year. The region increased from 34, its low of the year, to 36, its high of the year. The West continued its regional underperformance with its HMI gaining one point from its low of the year at 26. The West started 2026 at 34 and has trended downward since then.
New Residential Construction (Single-Family Housing Starts) – April, 2026
Single-family housing starts declined in April but have a good chance to quickly recover the 1M mark given the jump in builder sentiment in May. April’s 930K in single-family starts represents a 9.0% month-over-month decrease and a 2.4% year-over-year decrease.
The NAHB blamed the declines on “continued economic uncertainty and affordability challenges, including higher construction costs, ongoing labor shortages and elevated financing expenses.”
![US. Bureau of the Census, Privately Owned Housing Starts: 1-Unit Structures [HOUST1F], first retrieved from FRED, Federal Reserve Bank of St. Louis, June 2, 2026](https://drduru.com/onetwentytwo/wp-content/uploads/2026/06/20260602_Housing-Starts-April-2026.png "Housing starts")
While builders decreased the pace of starts, permits are still around 3-year lows. Building permits (new privately-owned housing units authorized in permit-issuing places) have stalled out since June, 2025. Permits were 881K, a 1.5% month-over-month decrease from March and a 4.6% year-over-year decline. The sluggish activity in permits suggests starts will remain rangebound for quite some time to come.
Starts were mixed across regions. Month-over-month the changes were +16.1%, -18.8%, -2.7%, and -22.9% for the Northeast, Midwest, South, and West respectively. Year-over-year the changes were -3.2%, -33.3%, +1.7%, and +7.3% for the Northeast, Midwest, South, and West respectively.
New Residential Sales (Single-Family) – April, 2026
New home sales declined in April. Sales fell 6.2% from March’s sales figure of 663K to 622K in April. Year-over-year sales declined 11.3%. The margin of error on the sequential change is once again particularly large. At ±12.8% the decline could easily disappear or even reverse in future revisions. Note that March sales were revised downward 2.9%.
While the NAHB attributed March’s increase in sales to greater inventory availability at the lower end of the market. The organization blamed April’s decline on “elevated mortgage rates, higher inflation and economic uncertainty kept more buyers on the sidelines in April as ongoing affordability challenges continue.” Overall, just like starts, new home sales are simply stuck in an extended multiyear range.
![US. Bureau of the Census, New One Family Houses Sold: United States [HSN1F], first retrieved from FRED, Federal Reserve Bank of St. Louis, June 2, 2026](https://drduru.com/onetwentytwo/wp-content/uploads/2026/06/20260602_New-home-sales-April-2026.png "new home sales")
For April, the median price for new homes increased 8.0% sequentially and increased 2.2% year-over-year to $422,500. As is often the case, the increase in prices coincided with a shift in the sales mix.
Sales of homes priced over $1M remained at 6% of sales. The two lowest tiers declined from 52% to 45% of sales. The $500,000 to $599,999 tier increased from 18% to 22% of sales.
March’s inventory was 8.7 months of sales. April’s inventory increased to 9.4 months of sales compared to 8.6 months a year ago. Absolute inventory increased from 481K to 489K. Note well that “greater inventory availability” did not help sales this month.
The Northeast, Midwest, South, and the West changed -12.9%, -21.4%, -14.7%, +4.6% respectively year-over-year. Sequentially, the Northeast, Midwest, South, and the West changed -12.9%, -25.0%, -9.8%, +18.7% respectively. The wide swings and variety in regional changes continue to align with the high degree of uncertainty in the aggregate estimate.
Existing Home Sales – April, 2026
Existing home sales increased slightly in April. The National Association of Realtors (NAR) reported a 0.2% month-over-month increase to 4.02M, alongside flat sales year-over-year.

(For historical data from 1999 to 2014, click here. For historical data from 2014 to 2018, click here) Source for chart: National Association of Realtors, Existing Home Sales© [EXHOSLUSM495S], retrieved from FRED, Federal Reserve Bank of St. Louis, June 2, 2026

The organization credited improved affordability for the tiny incremental gain. Although there was no gain from a year ago, the NAR reported year-over-year changes for its Housing Affordability Index. At an aggregate level, the index improved from 101.4 to 110.6. Each region also experienced healthy gains in year-over-year affordability: Northeast +4.7%, Midwest +5.9%, South +9.6%, West +12.5%.
Total housing inventory in April was 1.47M units, up 5.8% from March and up 1.4% from April 2025. The NAR reported a 4.4-month supply of unsold inventory, up from 4.2 months last month and up from 4.3 months one year ago. As usual, inventory gains did not prevent price appreciation.
The median sales price of an existing home was $417,700 in April, up 0.9% from one year ago ($414,000). April marked the 34th consecutive month of year-over-year price increases.
The REALTORS® Confidence Index showed a median time on market of 32 days in April, down from 41 days in March and up from 29 days in April 2025.
The NAR also reported that first-time homebuyers represented 33% of sales (up from 32% in March and down from 34% one year ago).
Regional sales changes were mixed, an unsurprising configuration given the slight gain in aggregate sales. Month-over-month sales were unchanged in the Northeast, increased 2.2% in the Midwest, increased 0.5% in the South, and declined 2.6% in the West. The regional year-over-year changes were: Northeast -8.2%, Midwest -1.0%, South +2.7%, West unchanged.
Single-family existing home sales were unchanged month-over-month in April at a seasonally adjusted annual rate of 3.64M and declined 0.3% year-over-year. The median price of a single-family home was $422,300, an increase of 1.0% from last year.
California Existing Single-Family Home Sales – April, 2026

After increasing in February, California existing home sales increased again in April. The California Association of Realtors (C.A.R.) reported that existing single-family home sales increased 3.9% in April to 275,580, up 4.1% year-over-year. The C.A.R. noted that the largest sales increase happened for homes priced at or above $2M with an 8.4% surge. The organization surmised the gains were driven by a strong stock market alongside lower mortgage rates in the first half of April.
The median price increased 2.9% month-over-month and up 0.4% year-over-year to $914,810. This price increase set a new all-time high driven by the shift in mix toward the high end of the market. Still, the statewide median price per square foot was $428, down from $431 a year ago. Moreover, the sales-price-to-list-price ratio was 100% in April, unchanged from a year ago.
April’s unsold inventory index (UII), which measures the number of months needed to sell the supply of homes on the market at the current sales rate, declined 17.5% from February and was down 5.7% from March 2025. Total active listings rose from February 2026 but fell year-over-year for a second straight month. In the March report, the C.A.R. blamed a decline in inventory on the “lock-in effect”, where existing homeowners with low mortgage rates are reluctant to move and incur higher mortgage rates for a replacement residence. However, this lock-in has been a salient feature of the housing market for around four years, and April’s mix of inventory effects shows that lock-in is not a consistent driver of inventory dynamics.
The median time on market remained unchanged from 21 days a year ago to 21 days.
Georgia’s Housing Market – April, 2026
{No data made publicly available for April}
Home closing thoughts
Beyond the monthly data, several housing-related developments continue to shape affordability, supply, and market structure. Below are some of the more notable stories that caught my interest over the last month or so.
The 21st Century ROAD to Housing Act
The 21st Century ROAD (Renewing Opportunity in the American Dream) to Housing Act is a bi-partisan Federal effort to address the nation’s housing affordability crisis. On May 20th, the House passed the bill by an overwhelming majority of 396-13. The Senate is expected to pass the bill as well despite the House slightly watering down the Senate’s amendment to preventing institutional investors from buying homes. Here are the highlights of the bill (from the legislation itself):
- Revises federal housing programs, including by expanding available financing for affordable housing and providing grants for planning and community development activities;
- Increases the maximum eligible income for the Department of Housing and Urban Development’s (HUD’s) HOME Investment Partnerships Program (grants to states and localities to support housing for low-income households) and establishes a grant program to assist regional, state, and local entities with strategies to support affordable housing;
- Exempts certain housing-related activities from the environmental review process, including certain construction, improvement, or rehabilitation of residential buildings;
- Excludes veterans’ disability benefits from being considered as income for purposes of determining eligibility for the Veterans Affairs Supportive Housing (VASH) program;
- Establishes a pilot program to provide grants to public housing agencies (PHAs) and other owners of federally assisted housing to test the efficacy of temperature sensors to support compliance with temperature requirements;
- Eliminates the requirement that manufactured homes must be constructed with a permanent chassis;
- Authorizes HUD to conduct performance reviews of organizations that provide housing counseling services.
The bill emphasizes assistance to lower income households and reduces regulations that slow and prevent housing construction. The bill is traditional bi-partisan legislation with both parties accomplishing their goals. While the stock market sent ITB up 4.3% on the day of passage, I expect a net wash for publicly traded home builders as increasing supply will be a net constraint on margins and the ban on institutional investors eliminates a sales channel. Still, expanding the topline opportunity will help builder operations and cashflow. Moreover, the bill looks like a big win for American households.
Both the NAR and the NAHB celebrated passage of the bill.
“The National Association of REALTORS® applauds House passage of the 21st Century ROAD to Housing Act, one of the most significant bipartisan housing packages Congress has considered in decades. ..This bill reflects the growing bipartisan consensus that the nation needs bold action to expand housing inventory, improve affordability, and create more pathways to homeownership and rental opportunity.”
“In a significant victory for NAHB and the broader housing sector, the U.S. House of Representatives approved an amendment to the 21st Century ROAD to Housing Act that removes a build-to-rent (BTR) sales provision that would have hurt affordability and reduced much-needed housing supply.”
“MBA commends House Financial Services Committee Chair French Hill, Ranking Member Maxine Waters, and the bipartisan group of lawmakers whose leadership and collaboration resulted in overwhelming passage of this consequential housing package. The House revisions addressed many key concerns raised by MBA and other stakeholders, strengthening the legislation while preserving important measures in the Senate’s bill to boost housing supply and expand access to affordable mortgage credit.”
Mixed Affordability News
While relief may be on the way for home buyers, May’s news offered a mix of perspectives on affordability developments.
The NAHB reported a small improvement in affordability in the first quarter even though households remain cost-burdened. The reconvergence of the median prices for new and existing homes means that affordability is also the same for both categories. The National Association of Home Builders (NAHB)/Wells Fargo Cost of Housing Index (CHI) improved for both median and low income households from Q4 2025 to Q1 2026. For new homes, the share of income needed to purchase a home fell from 34% to 32% for a median family and from 67% to 65% for a low-income family. For existing homes, the share of income needed fell from 34% to 32% for a median family and from 69% to 65% for a low-income family.
The NAR warned that “households today can access about one-quarter fewer homes than they could in a balanced market.” In March 2026, the national “Listing-Income Alignment Score” remained below the pre-pandemic baseline of 84.4%. Still, the trend appears favorable as the score increased year-over-year from 66.7% to 74.9%.
The C.A.R. reported a 4-year high in affordability for Californians. Specifically, “twenty-two percent of California households could afford to buy an $843,390 median-priced home in the first quarter of 2026, up from 21 percent in fourth-quarter 2025 and up from 19 percent in first-quarter 2025.” I expect a setback in affordability in Q2 as mortgage rates have been creeping higher and the median price hits a new record.
Spotlight on Mortgage Rates
The Mortgage Bankers Association (MBA) reported three weeks with a decrease in mortgage applications and one weekly increase for the month of May. For all of April, new home purchase mortgage applications decreased 2.4% year-over-year but dropped 10% sequentially (not seasonally adjusted), a significant turnaround from March’s 26% month-over-month surge.
Mortgage rates rebounded sharply in May as the bond market continues to respond to inflationary pressures in the economy. Thus, I expect sharp pullbacks in new and existing home sales from the month, especially at the lower ends of the market.
![Freddie Mac, 30-Year Fixed Rate Mortgage Average in the United States [MORTGAGE30US], retrieved from FRED, Federal Reserve Bank of St. Louis; June 3, 2026.](https://drduru.com/onetwentytwo/wp-content/uploads/2026/06/20260603_30-Year-Fixed-Rate-Mortgage-Average.png)
Be careful out there!
Full disclosure: long ITB, long DHI