

Stock Market Commentary
I am seeing more and more cracks widening in the stock market, and I am getting increasingly concerned. I am trying to stay bullish because the seasonally strong period has started for the stock market. However, after such a strong August, strong September, and strong October, each of which is historically one of the most dangerous months of the year for the S&P 500, some kind of real selloff seems overdue. Buyers stepped in so quickly during each of the last three pullbacks that the market barely paused. With market breadth continuing its downtrend and the volatility index forming a bottom, I see cracks widening.
The stock market and its technicals have delivered an impressive compilation of poetry. The S&P 500 hit a new all-time high at the start of the government shutdown, yet as soon as the shutdown ended, the index and the market in general deepened its sell-off. Disappointment over growing hawkishness from Fed-speak has become a new excuse for bad sentiment. Now the market is struggling to hold on to critical support…or recover support.
Stock Market Commentary
The Stock Market Indices
S&P 500 (SPY)
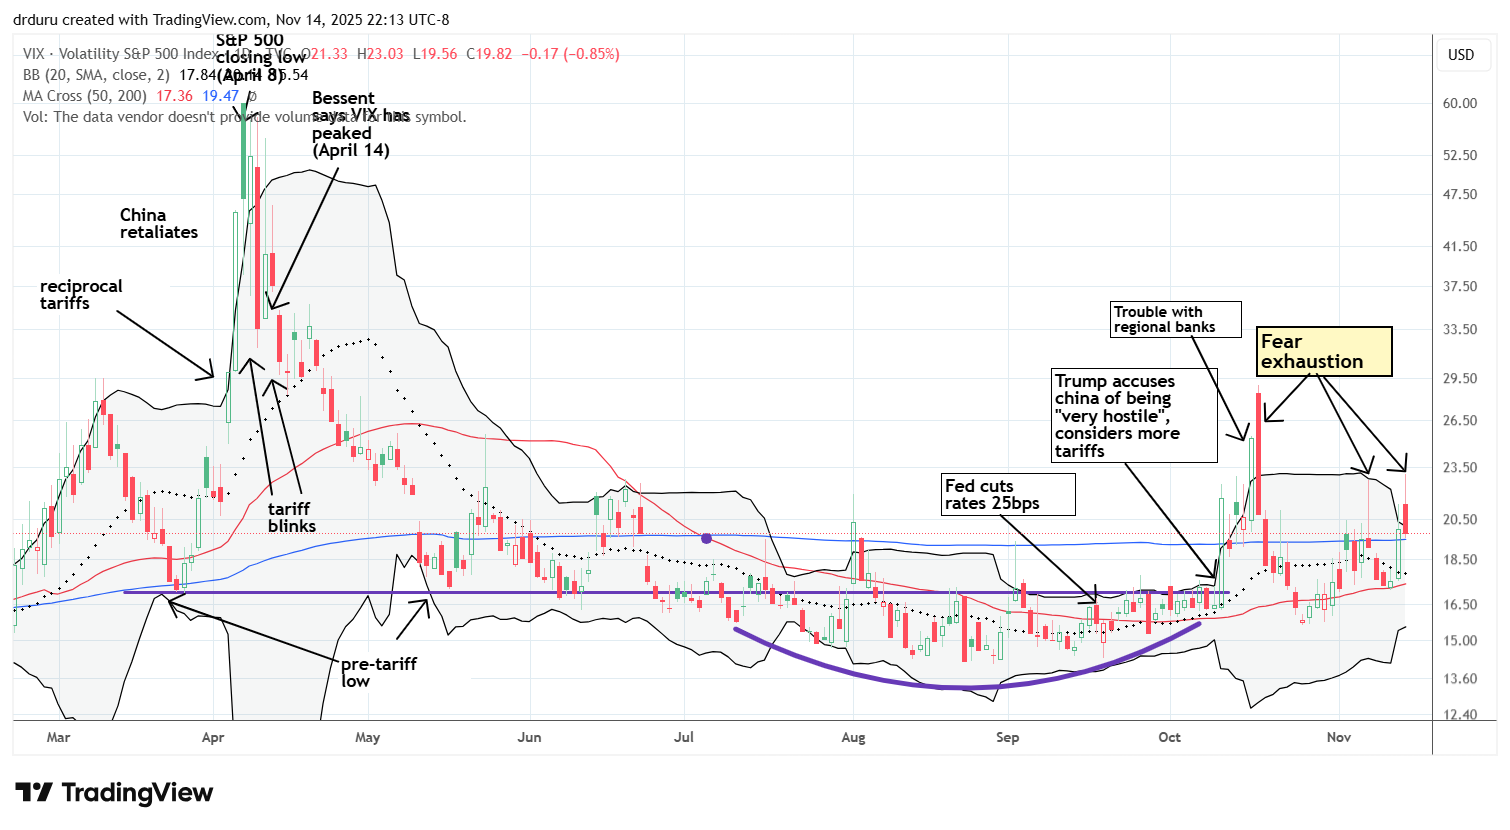
The S&P 500 recently marked a top following the Federal Reserve rate cut. The index tested its 50DMA on Thursday and then gapped down below support on Friday. That move was bearish, but buyers stepped into the breach and pushed the index back above its 50-day moving average (DMA) (the red line below) for a flat close on the day. This struggle is very important because the S&P 500 has not closed below its 50DMA since April, a milestone that underscores the power of the drama, trauma, and noise of the tariff issues earlier this year. Given market breadth’s downward bias, something eventually has to give…
")
NASDAQ (COMPQX)
The NASDAQ looks similar to the S&P 500. The tech-laden index barely closed above its 50DMA, which increases my concern for technology stocks even with the marginally positive close. The growing fear of an AI bubble seems to be cascading through the sector as traders slowly take profits after a year of strong gains.
")
iShares Russell 2000 ETF (IWM)
IWM has confirmed a breakdown below its 50DMA and is trading below its previous all-time high. The 20DMA (dashed line) is now pointing downward, reinforcing the bearish shift for IWM. Despite IWM’s return to bearish territory, I placed one more short-term trade using an IWM calendar call spread. This trade is positioned for a rebound to resistance from any one of the three overhead converging lines of resistance.
")
The Short-Term Trading Call With A Partial Rescue
- AT50 (MMFI) = 38.8% of stocks are trading above their respective 50-day moving averages
- AT200 (MMTH) = 53.5% of stocks are trading above their respective 200-day moving averages
- Short-term Trading Call: cautiously bullish
AT50 (MMFI), the percentage of stocks trading above their respective 50DMAs, closed the week at 38.8%. Market breadth has been declining for months; an early-week rebound fizzled out in the final two days of the trading week. AT200 (MMTH), the percentage of stocks trading above their respective 200DMAs, is still holding up better than short-term breadth. This longer-term measure of market breadth is helping me to cling to my cautiously bullish short-term trading call despite the bearish breakdown for IWM and the the S&P 500 and the NASDAQ to 50DMA precariously clinging to support. One more confirmed breakdown flips me to neutral and then anticipating a quick trip to oversold trading conditions.
The Equities: Cracks Widening
Oracle (ORCL)
Description: Oracle (ORCL) provides enterprise software, cloud services, and database technology to businesses worldwide.
Technical status: ORCL tested its 200DMA after reversing all of its post-earnings gains, reflecting a breach of prior support levels.
Trade commentary: When Oracle announced its $350 billion revenue deal in September and the stock surged 36 percent, buyers were not able to generate further momentum, which in hindsight was a clear tell. Since then Oracle has drifted downward and then fallen straight through several support levels, reversing the entire post-earnings gain before finally testing its 200DMA. Normally I would rush to buy ORCL at such a clean technical setup. However, I do not want to play that game now because I am worried the cracks widening for ORCL flashed the first major signal of exhaustion from AI hype. I remain bullish on AI overall, but I am getting more wary.
")
NVIDIA Corporation (NVDA)
Description: Nvidia (NVDA) designs and sells graphics processing units, semiconductor hardware, and related software for computing and artificial intelligence applications.
Technical status: NVDA held its 50DMA support but formed another bearish topping pattern beneath its all-time high.
Trade commentary: NVIDIA reports earnings this coming week, and while it is still holding its 50DMA support, the tests of support are looking like ever more precarious pivots around support. Note that Michael Burry announced his bearish stance on the AI trade at a very opportune moment…surely adding more heft to growing AI fears.
")
VanEck Semiconductor ETF (SMH)
Description: The VanEck Semiconductor ETF (SMH) holds a portfolio of semiconductor manufacturers and related technology companies.
Technical status: SMH tested its 50DMA during a short-term downtrend that began in late October.
Trade commentary: The semiconductor sector has been pulling back since its all-time high in late October. Now SMH has delivered a picture-perfect 50DMA test. Technicals are lining up across individual semiconductor stocks as represented by the trading action in SMH. Cracks widening with two consecutive closes below the 50DMA will confirm bearishness for semiconductors broadly and add yet more weight to AI fears. To date semiconductors have been riding the wave of AI spending and spending promises.
")
iShares Expanded Tech-Software ETF (IGV)
Description: The iShares Expanded Tech-Software ETF (IGV) holds a broad basket of large-cap software companies.
Technical status: IGV defended its 200DMA after confirming a breakdown below the 50DMA.
Trade commentary: IGV delivered a picture-perfect test of its 200DMA (the blue line). If IGV can close one level higher, I may consider buying the ETF. Such a move would work against the cracks widening in the stock market and signal at least a pause in this bearish phase for software stocks. However, if IGV widens its cracks with a close below its 200DMA, I will get even more wary about the market in general. IGV includes major software names, some directly related to AI, making this level an important gauge for the broader tech landscape.
")
Datadog, Inc (DDOG)
Description: Datadog, Inc (DDOG) provides cloud-based monitoring and analytics tools for servers, databases, applications, and network infrastructure.
Technical status: DDOG pulled back naturally after a large post-earnings gain and remained in a bullish setup above prior support.
Trade commentary: DDOG is one of those few stocks that rallied (soon) after joining the S&P 500. The stock gained 23.1 percent post-earnings and has held up in the days since. The current pullback is a natural cooling of the price action. I put DDOG on my buy list; for example, I will buy on a move above 188, the intraday high from Friday.
")
ARK Innovation ETF (ARKK)
Description: The ARK Innovation ETF (ARKK) holds a portfolio of companies focused on disruptive and innovative technologies.
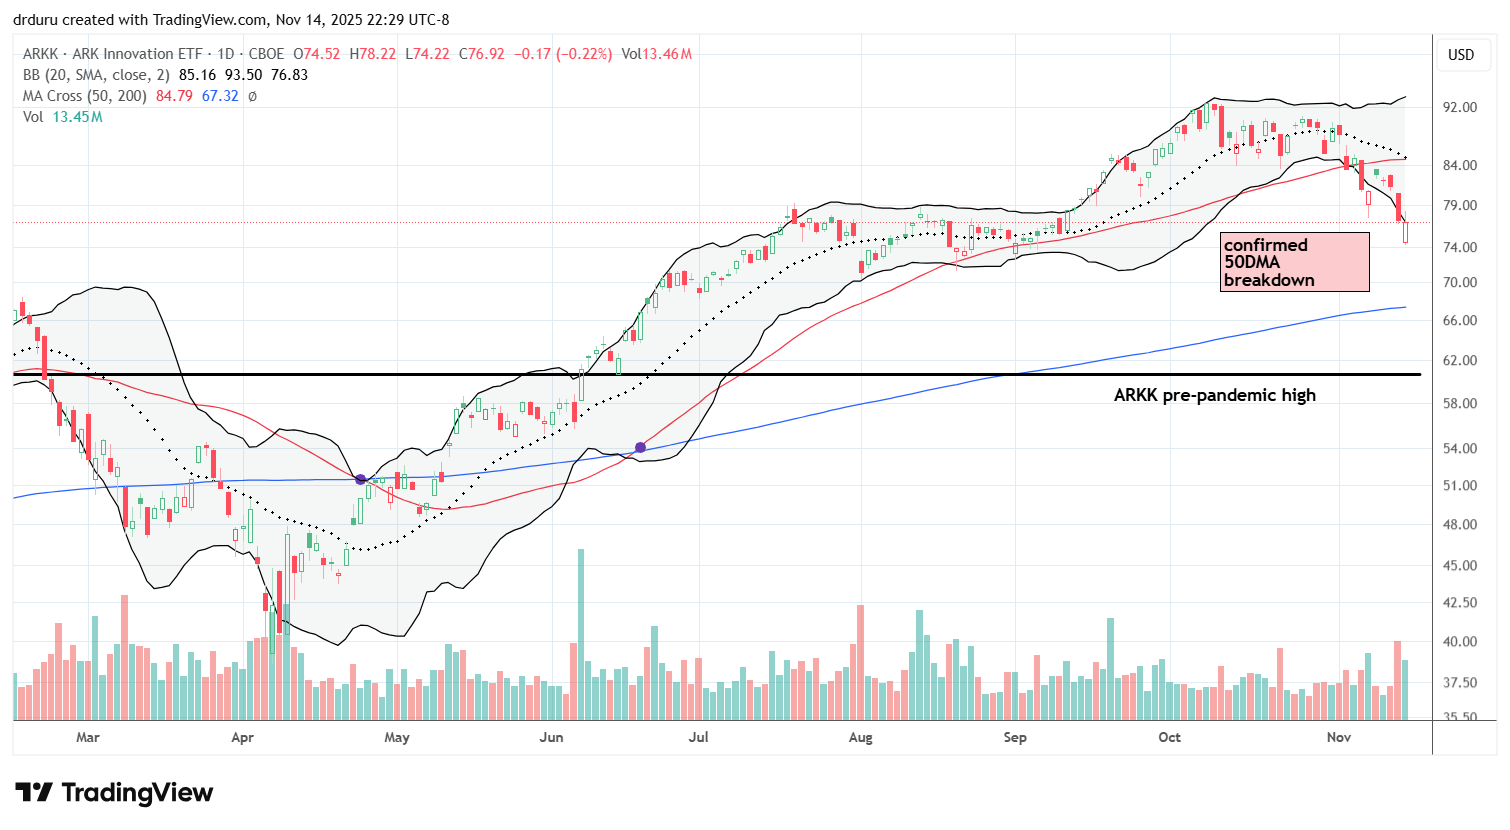
Technical status: ARKK remained in bearish territory after losing its 50DMA support and is now sagging toward its 200DMA.
Trade commentary: I am once again long ARKK and have been selling call options against the position. Recall that when ARKK finally broke above its pre-pandemic high last year, I turned bullish. My most recent trade is now in the red, although I did not expect to lose a core position in the first place (one of the cycles of covered calls called away my core position). With ARKK in bearish territory, I expect it to test its 200DMA in due time where I plan to add shares. This bearish breakdown is another negative sign for speculation in the stock market.
Tesla (TSLA)
Description: Tesla (TSLA) designs and manufactures electric vehicles, energy storage products, and related clean-energy technologies.
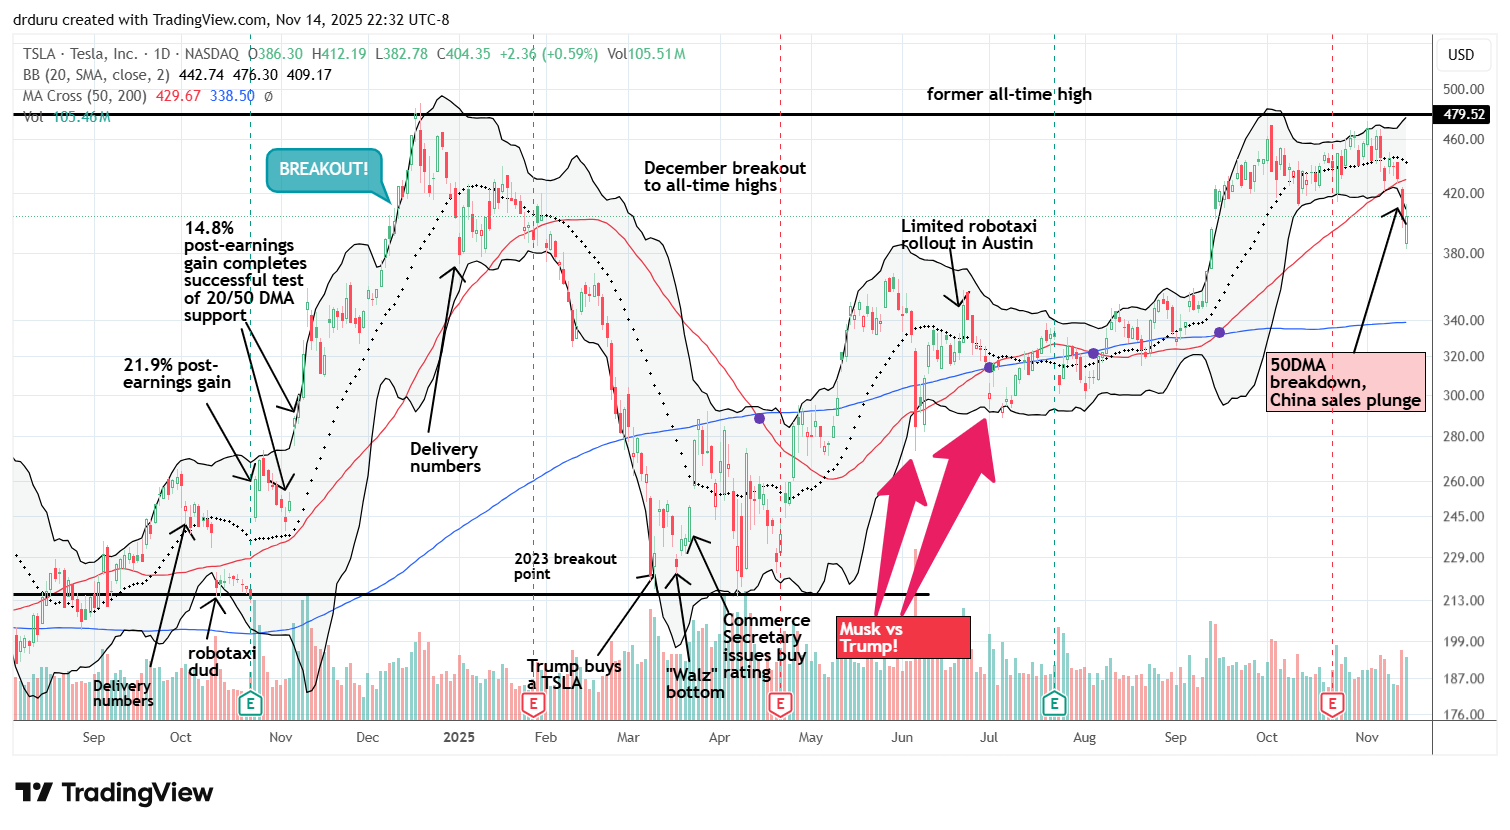
Technical status: TSLA broke below its 50DMA support on heavy volume following weak China sales.
Trade commentary: TSLA broke down last week on news of plunging China sales and other bearish tidbits, losing 6.6 percent on a big spike in volume. The stock gapped down sharply again at Friday’s open, confirming selling pressure and a decline in sentiment. Buyers stepped in and pushed the stock to a 0.6 percent gain by the close. Still, the stock faded from the lower Bollinger Band and kept it planted firmly in a bearish position. With TSLA fading overall from its former all-time high, the stock has printed a double-top until proven otherwise. Thus, I expect an eventual drift toward 200DMA support, which in turn would help drag ARKK toward its own 200DMA.
The Walt Disney Company (DIS)
Description: The Walt Disney Company (DIS) produces entertainment content, operates media networks, theme parks, and consumer product franchises.
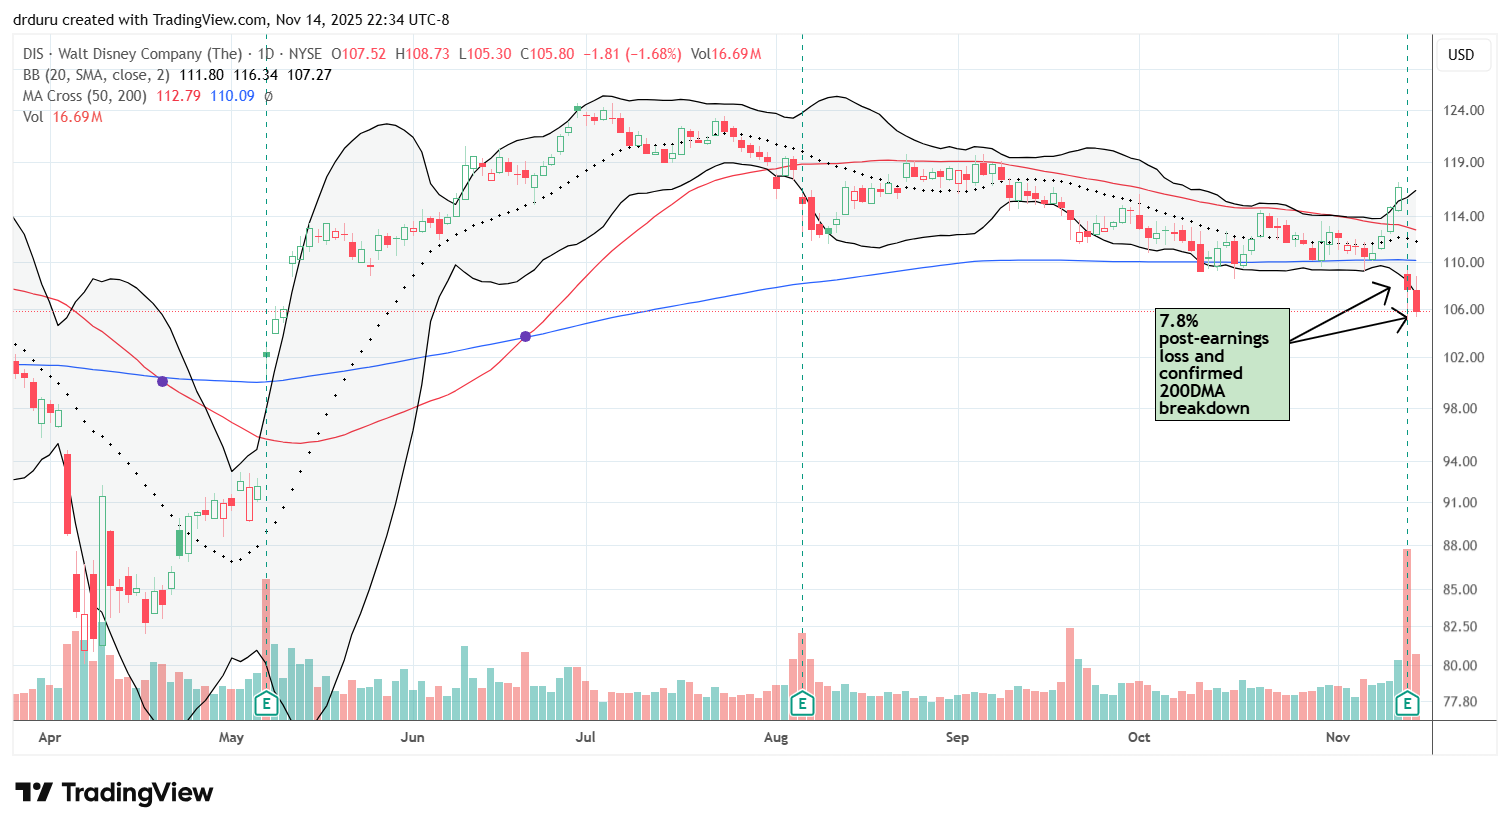
Technical status: The Walt Disney Company (DIS) confirmed a breakdown below its 200DMA after a 7.8 percent post-earnings loss.
Trade commentary: Disney’s 7.8 percent post-earnings drop and subsequent 1.7% loss confirmed a 200DMA breakdown. I assume expectations for DIS were too high. When I zoom out, I note that DIS has been stuck in a broad trading range for almost four years and has gone nowhere since 2018-2019. Thus while the recent trading action looks serious under a microscope, in the larger context DIS continues to chop around. The stock remains dead money unless something fundamental changes.
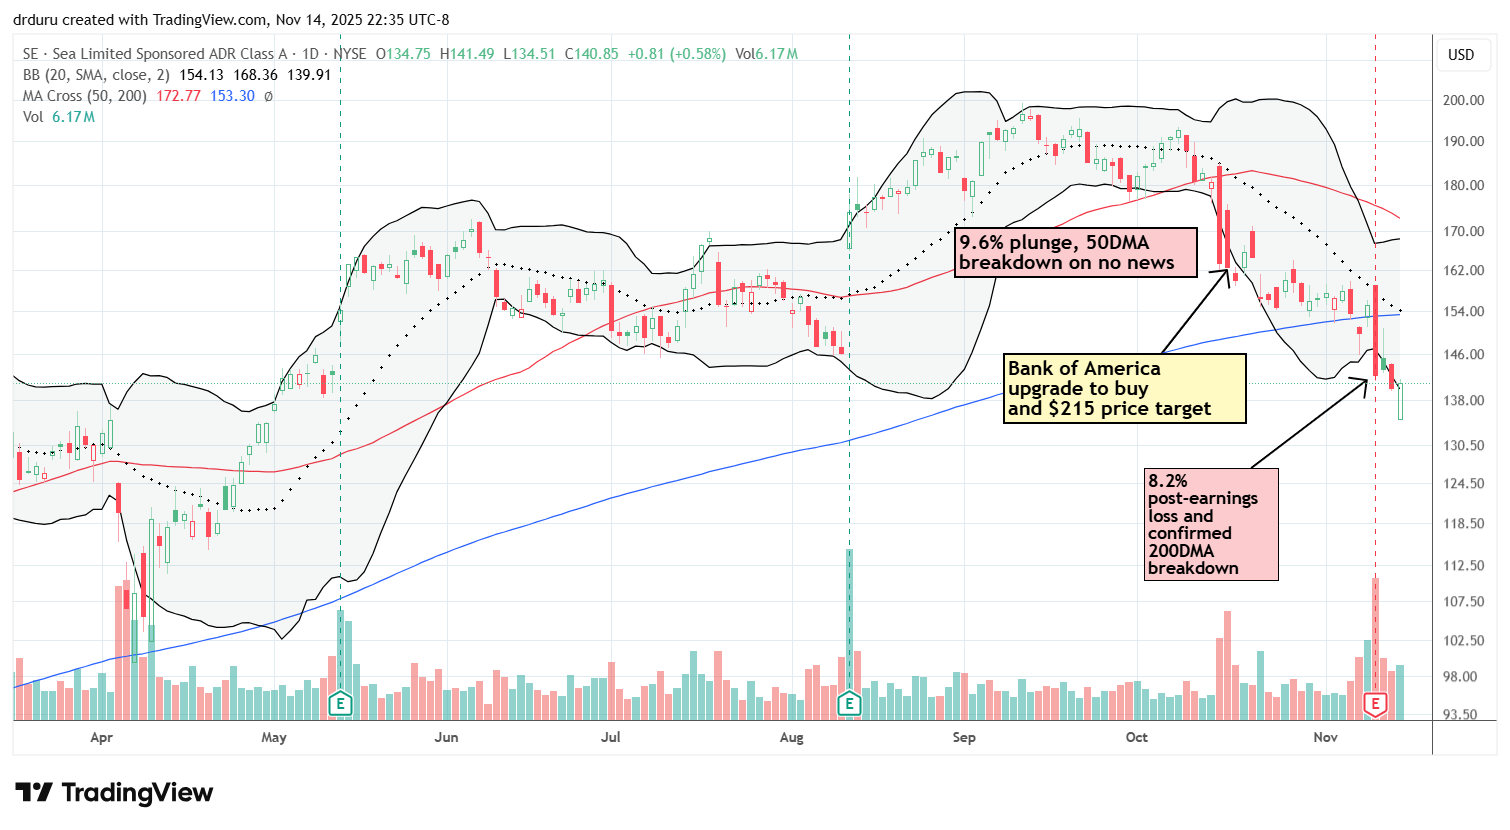
Sea Limited (SE)
Description: Sea Limited (SE) provides digital entertainment, e-commerce services, and financial technology platforms in Southeast Asia.
Technical status: Sea Limited (SE) confirmed a 200DMA breakdown after earnings but remains in a broader uptrend from its 2023 lows.
Trade commentary: SE showed strange trading last month when it plunged 9.6 percent on no news, only for Bank of America to upgrade it to a $215 price target the next day. Sellers immediately faded the upgrade rally, which was a clear warning. SE then lost 8.2 percent post earnings and confirmed a 200DMA breakdown. Despite this bearishness, the stock remains in an uptrend from the 2023 lows. Buyers could step in at any point to treat this dip as a buying opportunity. I shorted SE briefly but exited after the upgrade shook me out. I expect volatile moves in the coming weeks and prefer to leave the stock alone for now.
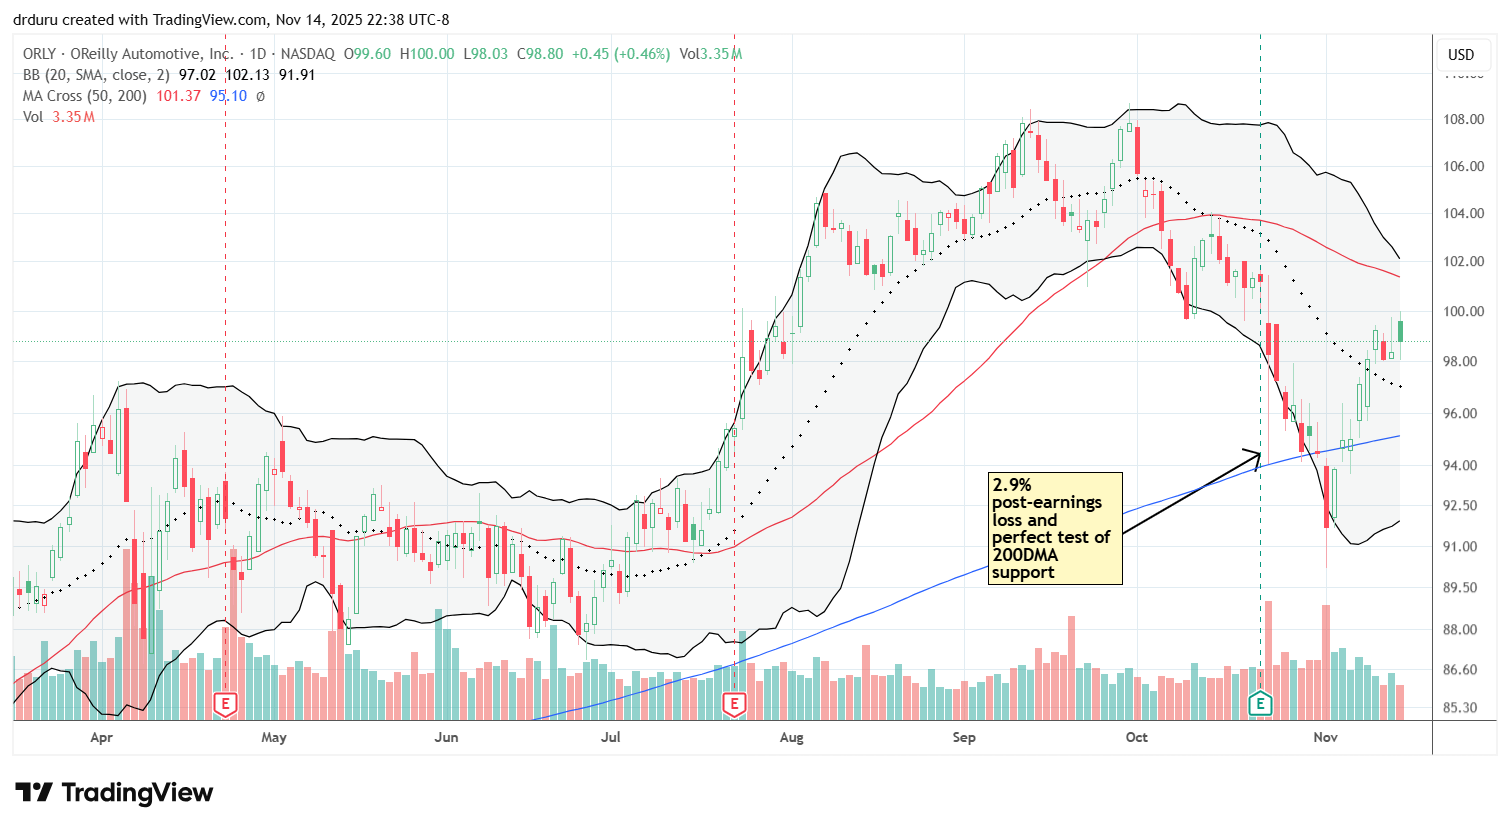
O’Reilly Automotive (ORLY)
Description: O’Reilly Automotive (ORLY) sells automotive aftermarket parts, tools, and maintenance products across retail locations.
Technical status: O’Reilly Automotive (ORLY) rebounded from its 200DMA but faces resistance beneath a downtrending 50DMA.
Trade commentary: O’Reilly lost 2.9 percent post earnings last month but delivered a picture-perfect intraday rebound from its 200DMA. That immediate rebound did not hold, and sellers plunged the stock well below its 200DMA before buyers regained control. ORLY is now trending higher, but both its 20DMA and 50DMA are declining, and the stock is losing momentum just below 50DMA resistance. I bought the breakout from the 200DMA and am closely monitoring.
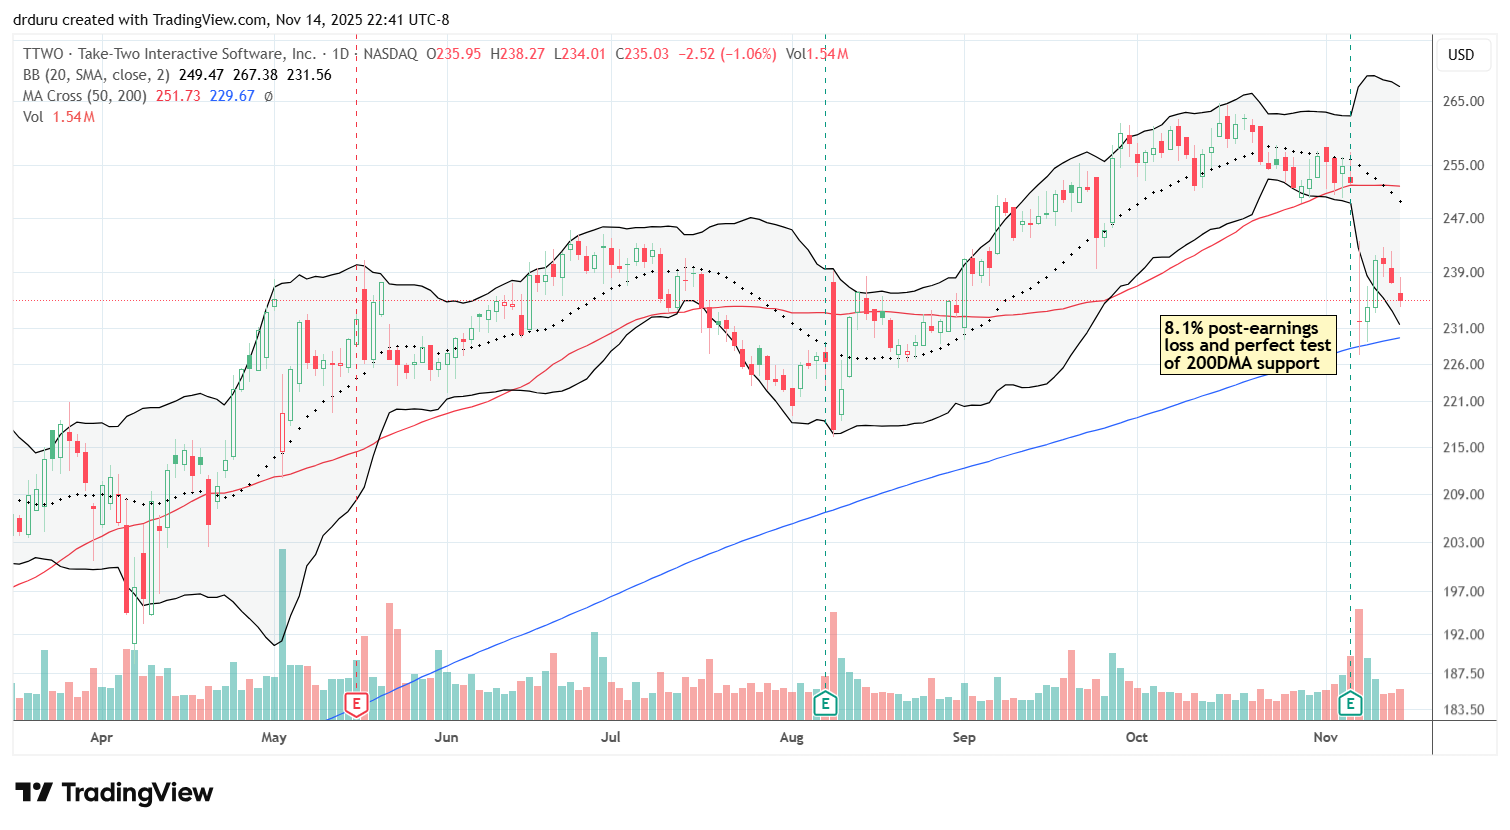
Take-Two Interactive (TTWO)
Description: Take-Two Interactive (TTWO) develops and publishes video games and interactive entertainment content.
Technical status: Take-Two Interactive (TTWO) held its 200DMA support after a post-earnings loss but failed to maintain momentum at prior resistance.
Trade commentary: TTWO’s 200DMA support held after its post-earnings loss. Buyers lifted the stock until it approached the intraday high from earnings day, where buyers lost confidence. The stock has been drifting lower since. On a longer-term chart, TTWO is still in a bullish run, which makes this post-earnings dip and defense of 200DMA support a buying opportunity. I plan to buy around this level and will stop out below the post-earnings intraday low.
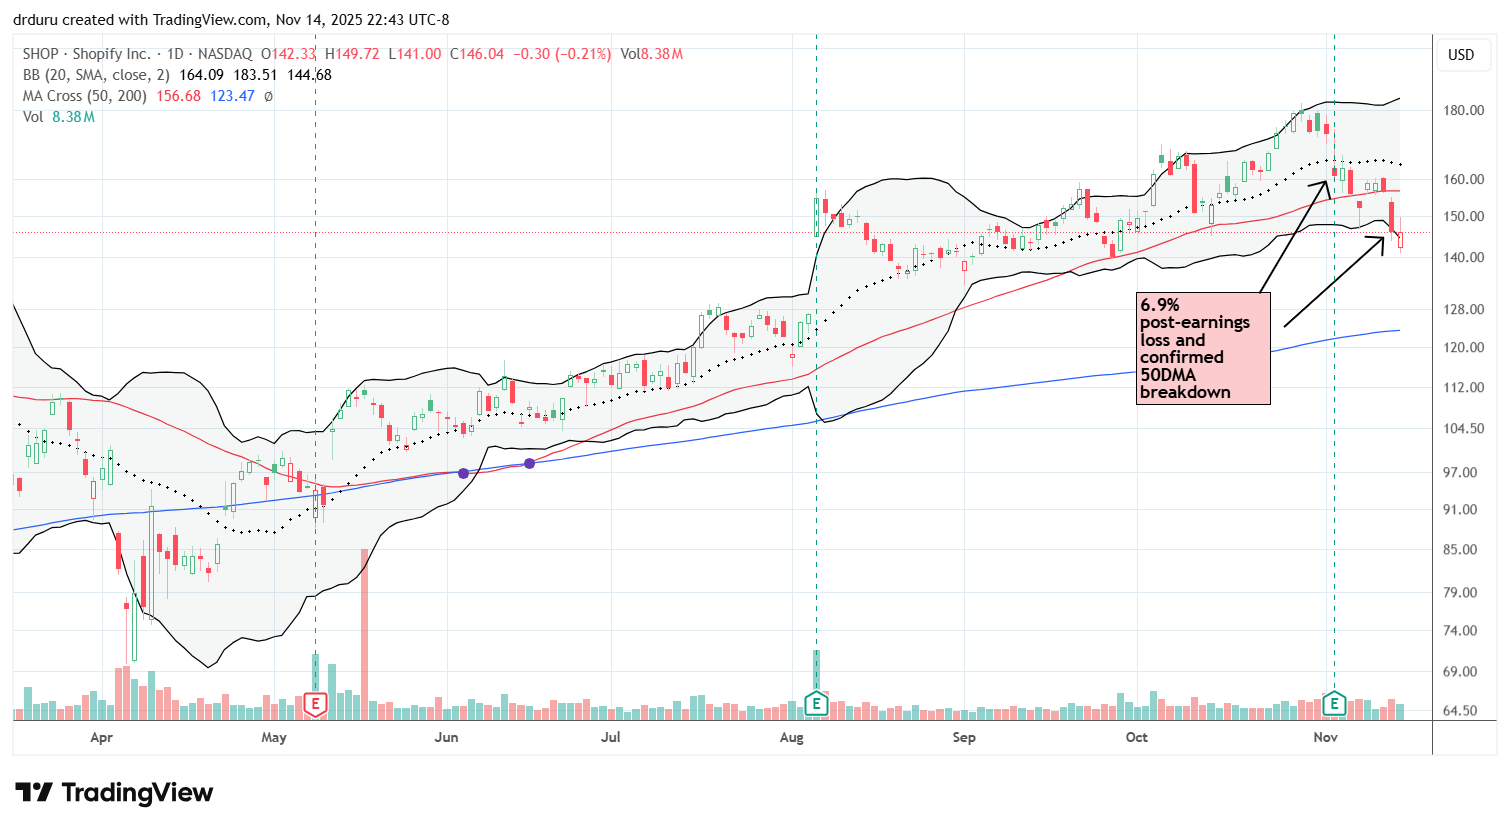
Shopify (SHOP)
Description: Shopify (SHOP) provides e-commerce software and payment solutions for businesses operating online stores.
Technical status: SHOP confirmed a 50DMA breakdown after a failed attempt to hold support, placing the stock at risk of drifting toward 200DMA support.
Trade commentary: SHOP fooled me. I attempted a bullish trade hoping for a reestablishment of 50DMA support to hold despite the earlier 6.9% post-earnings loss. Instead, the stock plunged on Thursday and confirmed the 50 breakdown on Friday. My calendar call spread blew up from the depth of the sell-off. The stock could now drift toward a 200DMA test, similar to other names showing breakdown patterns.
Lucid Group, Inc (LCID)
Description: Lucid Group, Inc (LCID) manufactures electric vehicles and related automotive technology.
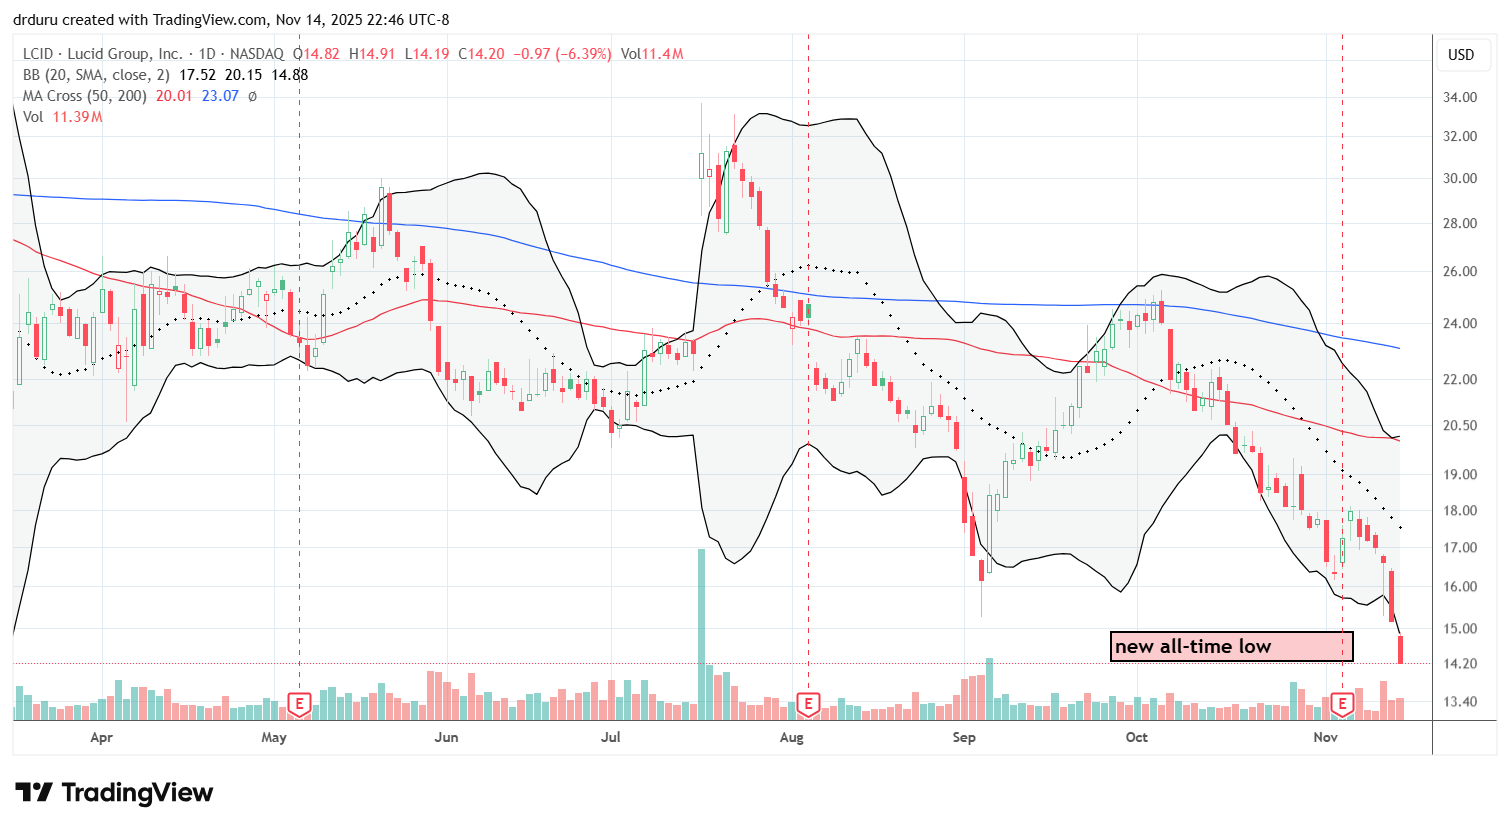
Technical status: LCID fell to a new all-time low after failing to sustain its post reverse split rally, continuing a long-term downtrend.
Trade commentary: LCID completed a reverse split in September, which disappointed me because reverse splits often signal weakness. The move looked like another step toward the bust that worries me, so I finally took my lumps and sold my stock. At first the joke was on me because LCID rallied quickly after the split, but that rally turned out to be a dead-cat bounce within a strong downtrend. Lucid sold off nearly every day heading into earnings, had another brief bounce, and then resumed falling to new all-time lows. I expect the company will eventually need to raise capital by selling additional stock (a common motivation for reverse splits). I hope the stock recovers someday, but that day seems further away now.
Helius Medical Technologies / Solana Company (HSDT)
Description: Helius Medical Technologies (HSDT), recently renamed Solana Company, is a firm transitioning from medical device development to crypto-related treasury operations.
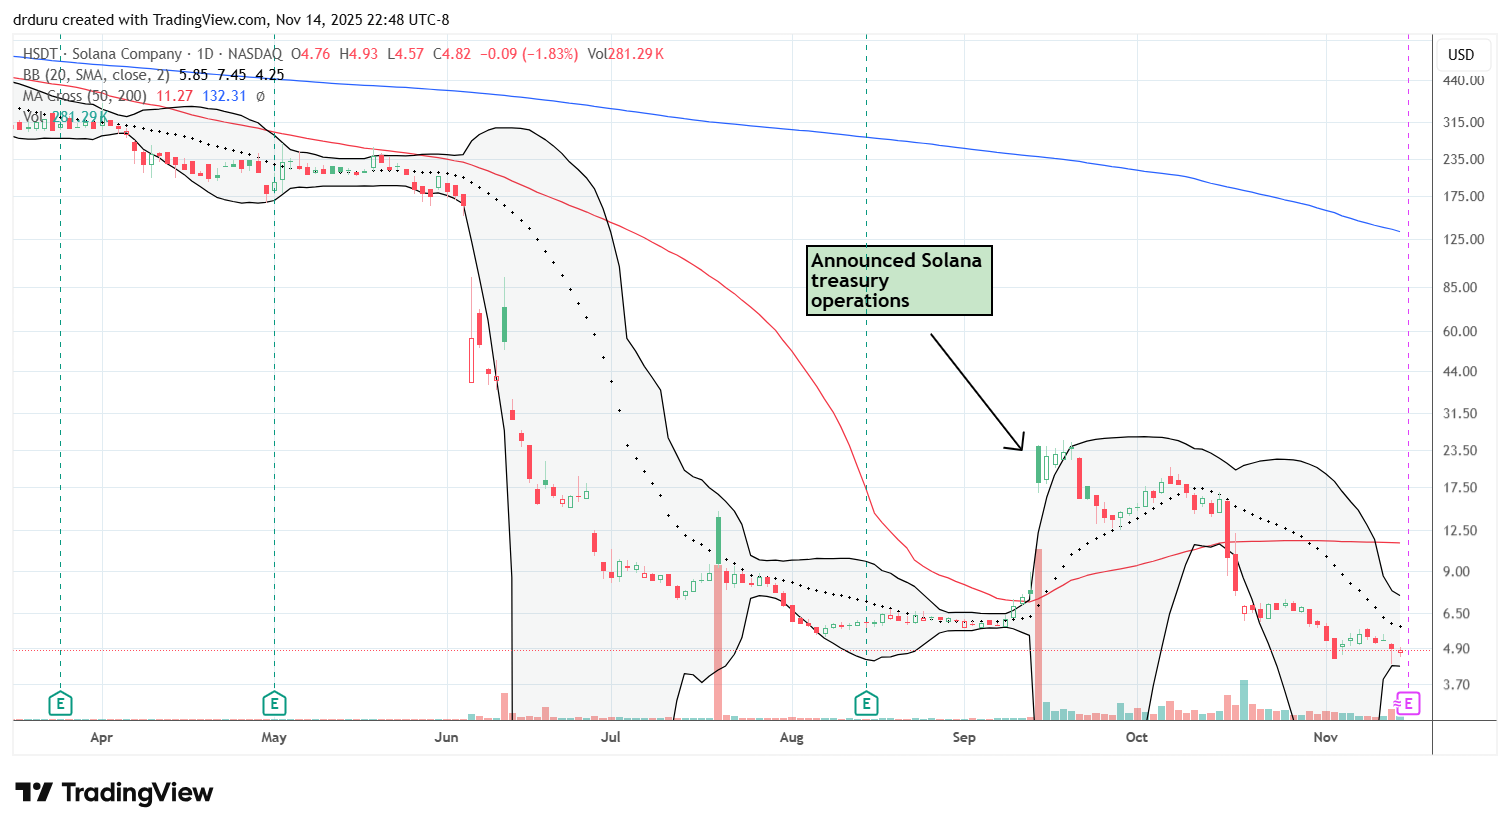
Technical status: Solana Company (HSDT) reversed its initial crypto-related surge and fell to new all-time lows.
Trade commentary: HSDT announced a pivot to crypto treasury operations, triggering a 142 percent surge. Buyers quickly lost momentum, and the stock failed to maintain gains above the intraday high. Since then, sellers have pushed HSDT to new all-time lows. Many companies attempting crypto treasury strategies have long histories of reverse splits and significant declines. HSDT is no exception, having once traded at astronomical split-adjusted levels before collapsing for decades. This pattern flags the risk of future reverse splits and ongoing deterioration.
Sequans Communications (SQNS)
Description: Sequans Communications (SQNS) operates technology and data-related services and recently announced a Bitcoin treasury strategy.
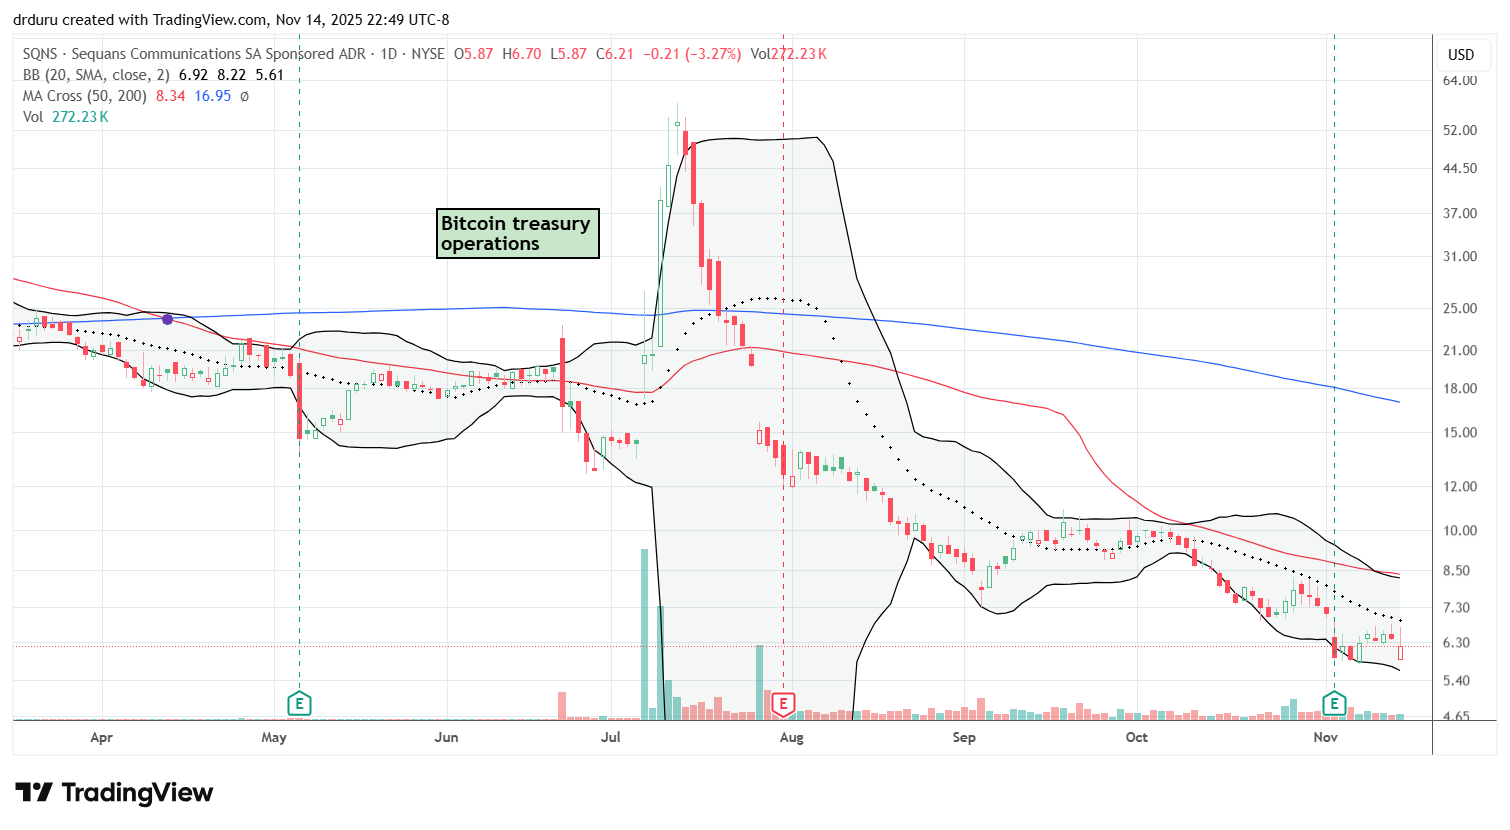
Technical status: Sequans Communications (SQNS) reversed its treasury-related gains and fell to new all-time lows, consistent with the long-term pattern of severe post reverse split declines for this kind of stock.
Trade commentary: SQNS surged 88 percent when it announced its Bitcoin treasury strategy and even added gains for two more days. After that, buying momentum disappeared and sellers overwhelmed the stock. SQNS fell below its pre-announcement levels and continued to new all-time lows. Like other treasury-pivot companies, SQNS has a long history of reverse splits and staggering losses. At one time, the split-adjusted price exceeded $1,500 per share before collapsing to single digits. I anticipate another reverse split sometime on the horizon.
BitMine Immersion Technologies (BMNR)
Description: BitMine Immersion Technologies (BMNR) engages in cryptocurrency-related operations and recently adopted an Ethereum-focused treasury approach.
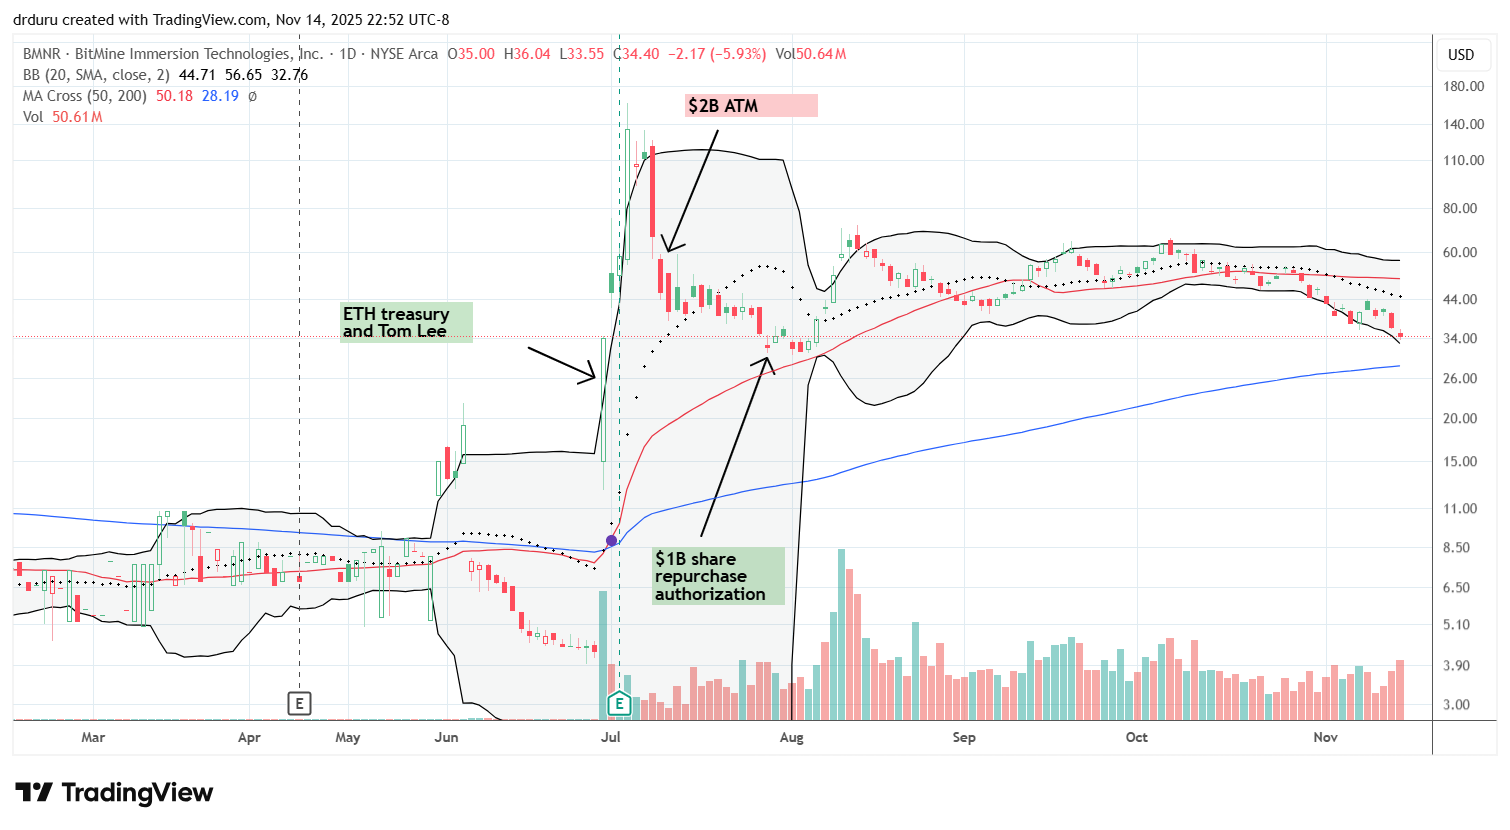
Technical status: BitMine Immersion Technologies (BMNR) rebounded off 50DMA support but drifted toward its 200DMA as prior enthusiasm faded.
Trade commentary: BMNR is my one exception in the group of treasury-pivot companies, but I am close to giving up the speculation as cracks widening for cryptocurrencies continue a broad sell-off. When famous permabull Tom Lee joined the board, the stock soared nearly 700 percent, followed by continued strong buying. The company then announced a $2 billion share offering to buy Ethereum. That move took down the stock until the company announced a $1 billion repurchase authorization. The stock rebounded sharply from its 50DMA, and that level has held as support since. I accumulated shares on the recent pullback, and I am counting on the company defending the stock as it drifts toward its 200DMA. The defense will fail if Ethereum continues lower. If so, BMNR could follow the same pattern as other treasury-pivot names and eventually sink to new lows. Historically, the stock once traded above $477 million per share (not a typo!) before collapsing over decades. The risks remain high.
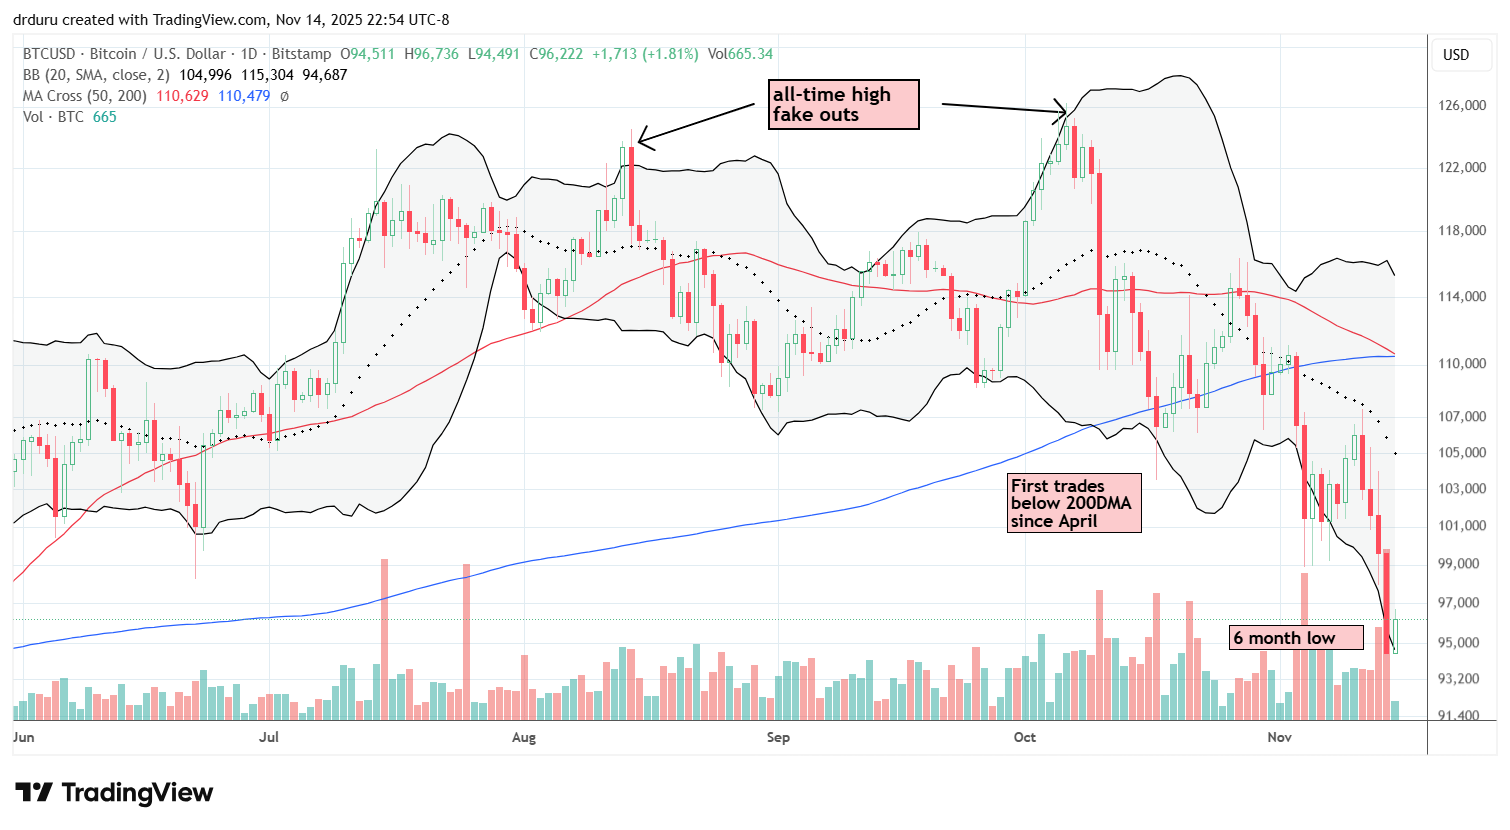
Bitcoin (BTC/USD)
Description: Bitcoin (BTC/USD) is a decentralized digital currency secured through blockchain technology.
Technical status: Bitcoin (BTC/USD) broke below its 20DMA, 50DMA, and 200DMA and fell to a six-month low.
Trade commentary: Bitcoin has been selling off since its October peak and second false breakout to all-time highs. This failure apparently broke trader sentiment. Bitcoin is now at a six-month low and below its 20DMA, 50DMA, and 200DMA. I am buying dips as I typically do, accumulating during sell-offs, but I prefer to buy into crashes rather than slow declines. Bitcoin is now in bearish territory given it has remained below $100,000 for this long.
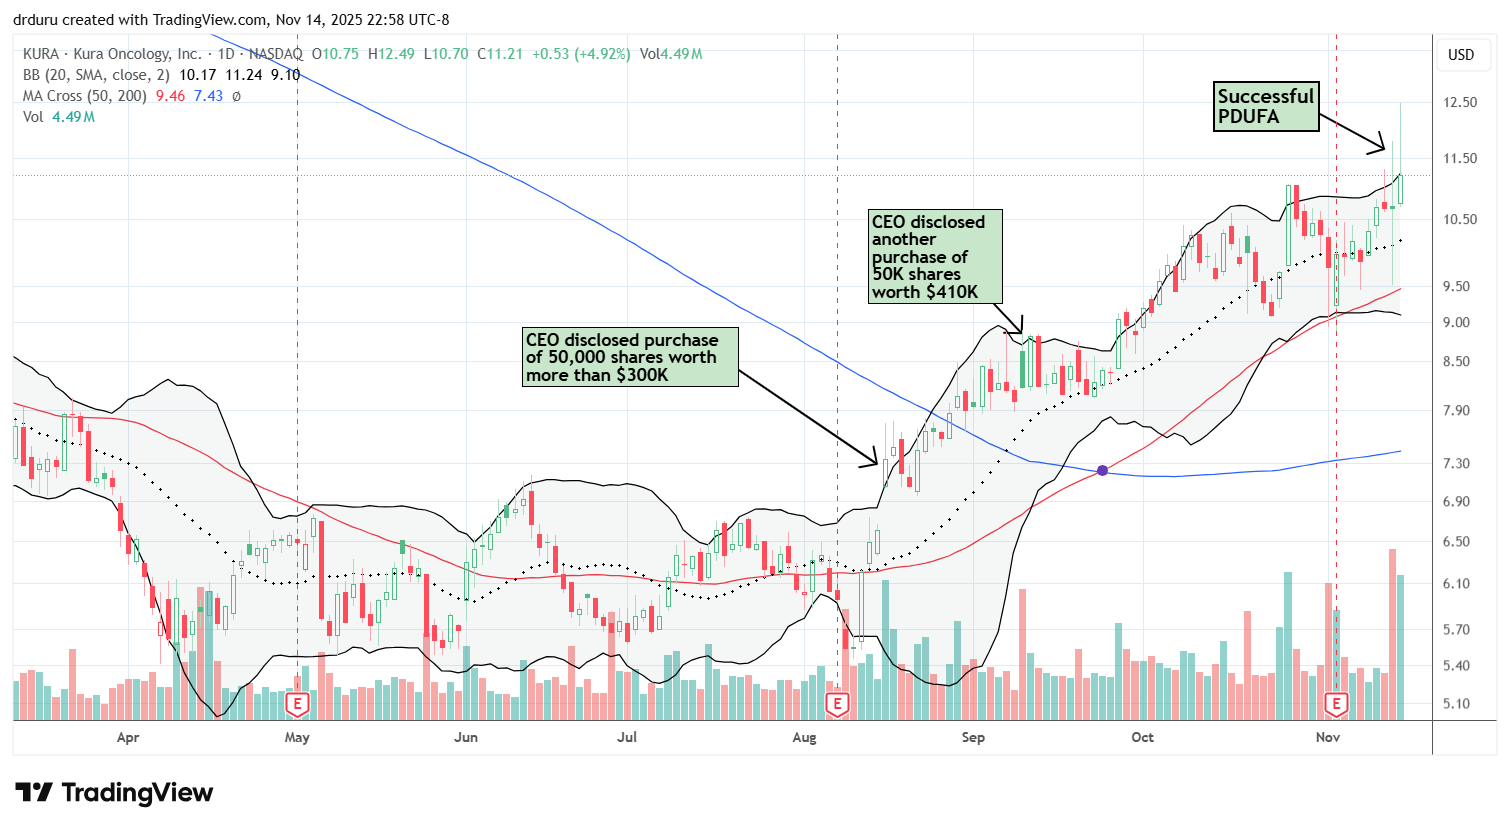
Kura Oncology (KURA)
Description: Kura Oncology (KURA) develops targeted oncology therapeutics for cancer treatment.
Technical status: Kura Oncology (KURA) held its 50DMA post-earnings and advanced into a successful PDUFA announcement, closing at an 11-month high despite multiple fades from intraday highs.
Trade commentary: KURA is my positive example to end this worrying tale of cracks widening. KURA’s CEO bought shares twice, and those insider purchases worked beautifully as buy signals. The stock held its 50DMA support during attempts at post-earnings selling, rebounded, and climbed into the successful PDUFA announcement. However, the fade from $12.50 to $11.21 may indicate the excitement is running its course. If weakness continues, I will protect my profits. The good news is that the stock has so far survived the typical sell-the-news reaction. While I do not think KURA has hit a ceiling, I will defer to the technicals if sellers take control.
")
")
Be careful out there!
Footnotes
Subscribe for free to get email notifications of future posts!
“Above the 50” (AT50) uses the percentage of stocks trading above their respective 50-day moving averages (DMAs) to measure breadth in the stock market. Breadth defines the distribution of participation in a rally or sell-off. As a result, AT50 identifies extremes in market sentiment that are likely to reverse. Above the 50 is my alternative name for “MMFI” which is a symbol TradingView.com and other chart vendors use for this breadth indicator. Learn more about AT50 on my Market Breadth Resource Page. AT200, or MMTH, measures the percentage of stocks trading above their respective 200DMAs.
Active AT50 (MMFI) periods: Day #107 over 20%, Day #105 over 30% (overperiod), Day #2 under 40% (underperiod), Day #14 under 50%, Day #38 under 60%, Day #80 under 70%
Source for charts unless otherwise noted: TradingView.com
Full disclosure: long IWM shares and calls, long SPY put spreads, long ARKK, long TSLA, DIS, long ORLY, long SHOP calendar call spread, long BMNR, long BTC/USD, long KURA
FOLLOW Dr. Duru’s commentary on financial markets via StockTwits, BlueSky, and even Instagram!
*Charting notes: Stock prices are not adjusted for dividends. Candlestick charts use hollow bodies: open candles indicate a close higher than the open, filled candles indicate an open higher than the close.
* Blog notes: this blog was written based on the heavily edited transcript of the following video that includes a live review of the stock charts featured in this post. I used ChatGPT to process the transcript.