
Stock Market Commentary
The stock market fell into chaos all over again as the U.S. retaliated against China’s tariff retaliation, hiking tariffs up to 104%. This escalation halted a rally that started as solid follow-through from the bullish engulfing bottom from the previous trading day. The whipsaw action underscored the fragility of technical setups in the face of significant macro news. Technical analysis offers an edge primarily when the market anticipates developments, whether macro or company-specific.
Today’s trading scenario motivated me to update my tariff crash trading plan as follows:
- Do not chase an oversold bounce higher.
- On or after a follow-through day, look to buy a pullback above the presumed sustainable low.
- Target next overhead resistance to take profits
- Stop out of the position below the presumed low. Redeploy the cash for the next oversold setup.
- Size position according to the upside potential versus the downside risk as described above using risk tolerance and trading horizon.
- Be extremely cautious as earnings season approaches: the current market and economic chaos will likely deliver plenty of earnings warnings and disappointing earnings guidance.
Further below, I provide a live example with one of the potential trades I discussed in the last blog post.
For longer-term holdings, I continue to accumulate small amounts of shares with a focus on ETFs.
The Stock Market Indices
S&P 500 (SPY)
The S&P 500 opened with a gap higher and posted gains for the first 45 minutes before selling off for the rest of the day. The index lost 1.6% but held above yesterday’s intraday low, keeping the sustainable low intact. The 20% decline from all-time highs remains a looming target and the conventional bear market definition is still beckoning.
NASDAQ (COMPQ)
The NASDAQ initially gapped right up to the 20% threshold for the conventional definition of a bear market but quickly reversed on the latest tariff news. This failure at resistance is a first glimpse of the challenge ahead for future bounces from oversold conditions. The tech laden index lost 2.2% for the day, yet remained above yesterday’s intraday low.
The iShares Russell 2000 ETF (IWM)
IWM mirrored the broader indices, reversing its opening gains and closing the day without violating the prior intraday low. The ETF of small caps still has its pre-pandemic high as a key level of potential support.
The Short-Term Trading Call With Chaos
- AT50 (MMFI) = 5.5% of stocks are trading above their respective 50-day moving averages (Day #4 oversold)
- AT200 (MMTH) = 15.0% of stocks are trading above their respective 200-day moving averages
- Short-term Trading Call: bullish
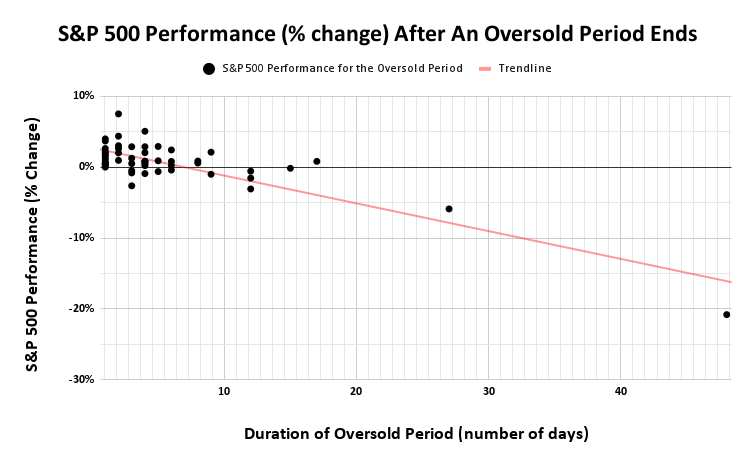
AT50 (MMFI), the percentage of stocks trading above their respective 50-day moving averages (DMAs), closed at 5.5%, just about the previous day’s intraday low. At this stage, further downside in market breadth offers little information value, as nearly the entire market is already oversold. What matters now is duration—the longer this oversold condition persists, the worse the implications for future performance. The chart below shows that if oversold conditions ended at 4 trading days, the S&P 500 is expected to gain around 1% over the duration of the oversold period. Also at 4 days this oversold period is already beyond the median duration (3.5 days) of oversold periods. Past 10 days and the market is really in trouble.
The VIX initially showed signs of implosion—key to confirming a sustainable low—but reversed higher with the tariff news. I need to see the VIX close lower on a volatility implosion to confirm a sustainable low. (As a reminder, I can only use these technicals to identify a sustainable low. THE final bottom is only known with hindsight).
The Equities: In Chaos
Flex Ltd. (FLEX)
I bought shares in FLEX based on the bullish engulfing setup I discussed in my previous post. My execution provides an example of my addendum on the tariff crash trading plan in the midst of chaos.
FLEX gapped up 4.7% and traded as high as 7.7%. I feared that the stock was getting away from me, but I resisted chasing FLEX higher; sharp oversold bounces are prone to sharp reversals. Instead, I placed a limit order right in the middle of the gap at $28.50, hoping for an intraday pullback (I did not want to miss the opportunity while I was away from the stock market). I also reduced my initial target number of shares to accommodate the potential stop loss below the low of the bullish engulfing pattern. The resumption of the tariff crash sent FLEX right through my limit order and a 1.0% loss on the day for FLEX. Given the extreme length of the bullish engulfing candle, I will consider adding to my position on a further pullback to the midpoint of that candle, keeping the same stop loss point.
International Business Machines Corporation (IBM)
IBM remained above its 200DMA and now enters my buy list among AI-related stocks, particularly as one of the few stocks left in the market still holding this important long-term line of support. I only like IBM if it holds above its 200DMA.
iShares 20+ Year Treasury Bond ETF (TLT)
TLT broke below a previous long-standing trading range, reflecting a sharp rise in long-term yields since Friday. Rising rates and falling stocks form a toxic combination. I took minimal profits in my existing TLT put options. It never occurred to me accumulate more put options after TLT gapped above its 200DMA or even after it sharply reversed. Next time around I will try to exercise more patience before buying put options to fade a TLT rally.
iShares U.S. Home Construction ETF (ITB)
Rising rates cascaded into extra weakness for rate-sensitive stocks like home builders. ITB dropped another 3.6%, reaching levels not seen since November 2023. Weakness in ITB often precedes broader market downturns, raising my concern that persistent weakness in home builders signals further weakness in the stock market ahead. This year, ITB peaked three weeks before the S&P 500 peaked. ITB was 8 days into a conventional bear market when the S&P 500 hit its all-time high.
Bitcoin (BTC/USD)
Bitcoin weakened again and returned to its post-election close. I have to assume that the next downside target is around 67,000, which would represent a full reversal of all post-election gains. Given its correlation with speculative assets, this slide in bitcoin presents another cautionary signal for risk assets.
Be careful out there!
Footnotes
Subscribe for free to get email notifications of future posts!
“Above the 50” (AT50) uses the percentage of stocks trading above their respective 50-day moving averages (DMAs) to measure breadth in the stock market. Breadth defines the distribution of participation in a rally or sell-off. As a result, AT50 identifies extremes in market sentiment that are likely to reverse. Above the 50 is my alternative name for “MMFI” which is a symbol TradingView.com and other chart vendors use for this breadth indicator. Learn more about AT50 on my Market Breadth Resource Page. AT200, or MMTH, measures the percentage of stocks trading above their respective 200DMAs.
Active AT50 (MMFI) periods: Day #4 under 20% (oversold), Day #10 under 30%, Day #29 under 40%, Day #41 under 50%, Day #68 under 60%, Day #169 under 70%
Source for charts unless otherwise noted: TradingView.com
Full disclosure: long SPY shares, long SPY put spread, long QQQ calendar call spread, long IWM call, long VXX puts, long FLEX, long BTC/USD
FOLLOW Dr. Duru’s commentary on financial markets via StockTwits, BlueSky, and even Instagram!
*Charting notes: Stock prices are not adjusted for dividends. Candlestick charts use hollow bodies: open candles indicate a close higher than the open, filled candles indicate an open higher than the close.
* Blog notes: this blog was written based on the heavily edited transcript of the following video that includes a live review of the stock charts featured in this post. I used ChatGPT to process the transcript.