

Introduction
The U.S. housing market follows a seasonal pattern. The spring selling season typically represents the year’s peak of activity in the housing market. During this time, households try to settle into a new home before summer travel or well ahead of the Fall start to the next school year. Like retailers who eagerly anticipate the Christmas shopping season, home builders deliberately prepare for the promising prospects of the spring selling season. As a result, the stocks of home builders also approximate a trade in a seasonal pattern where investors and traders try to anticipate the blossoms of the spring selling season. Analysts and market participants follow this enthusiasm by bidding up the stocks of home builders.
Unless spring sales greatly surprise to the upside, momentum for these stocks starts to wane around the peak of the spring selling season. The seasonal pattern for the stocks of home builders is so strong that the iShares U.S. Home Construction ETF (ITB) typically outperforms the S&P 500 (SPY) over this time. This out-performance creates the basis for a short-term trading strategy that can supplement investments in the housing sector.
The Seasonal Pattern
People who follow the housing market are very familiar with its seasonality. For example, in November, 2015, KBW announced “rally time for home builders.” An article describing KBW’s analysis noted “spring is the season for home sales, but it is the November-January period that’s rally time for homebuilder stocks…the team noting 75% of homebuilder returns occur during this period….Homebuilders, they say, historically outperform the market by 1.4% in November, 6.2% in December, and 6.4% in January.”
KBW’s commentary followed on the heels of the 2014 to 2015 season which delivered the expected trading pattern. The iShares U.S. Home Construction ETF (ITB) gained 17.3% from the end of October, 2014 to the end of March, 2015. Over this same time period, the S&P 500 only gained 2.4%. ITB went on to gain 13.0% for the full 12 months starting November 1, 2014. Thus, holding ITB through the full 12 months resulted in a loss of 25% of the gains from the seasonally strong period.
Even when ITB performs poorly, the ETF can still out-perform the S&P 500 during the seasonally strong period for trading. For example, the very next season, 2015 to 2016, disappointed with ITB losing 0.4% from the end of October, 2015 to the end of March, 2016. The S&P 500 fared slightly worse with a 1.2% loss. Moreover, the seasonally strong period performed much better than ITB’s -5.2% performance for the full 12 months.
Analysts periodically confirm their expectations for seasonal trading behavior. For example, when Susquehanna downgraded D.R. Horton (DHI) and Lennar Corporation (LEN) to neutral from positive in April, 2019, they reasoned that the year already delivered a “classic spring season for both demand and the stocks.” The 2018 to 2019 season generated a 13.1% gain from the end of October, 2018 to the end of March, 2019. The S&P 500 only gained 4.4% during this time. That year 2019 also happened to be an extremely strong year. The spring season surprised to the upside mainly thanks to fresh interest rate cuts from the Federal Reserve. ITB gained a whopping 43.2% for the full 12 months versus the S&P 500’s 12.1% gain.
These examples illustrate the power of the seasonal effects in the housing market along with some nuances. Traders anticipating the seasonal effect can distort timing for the trade. Macroeconomic forces can override typical seasonality.
How to Trade the Seasonal Pattern
Using 18 years of data, I created rules for trading the seasonal pattern for home builder stocks using ITB to minimize the impact of company-specific performance. I also call this period of trading the seasonally strong period for home builder stocks.
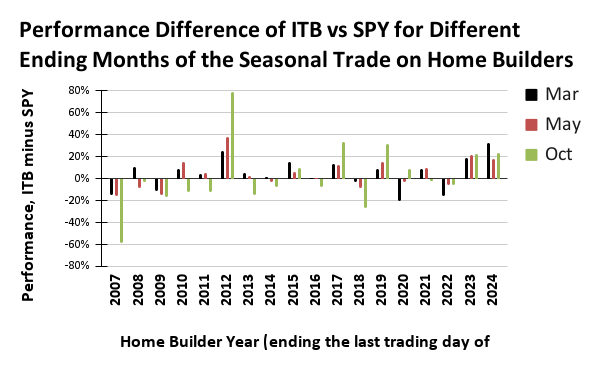
The chart below compares ITB’s out-performance over SPY when ending the seasonal trade on March, May, and October (the end of my “home builder year”). Since 2007, there are only five years (28%) – 2012, 2017, 2018, 2019, and 2020 – when ITB ended the 12 months with greater out-performance over SPY than ending the trade during the spring selling season (March or May). The year 2020 was the start of the pandemic when housing-related stocks collapsed in March. The abrupt price shock disrupted the seasonal trade in historic fashion.
Nine of eighteen (50%) home builder years ended with ITB under-performance. The chart below shows that traders should generally end the seasonal trade by May. Excluding 2020, March has been the optimal ending month ten out of the fourteen years (71%) when holding ITB the full year was not the optimal holding period. Thus, I tend to sell my short-term home builder shares by March.
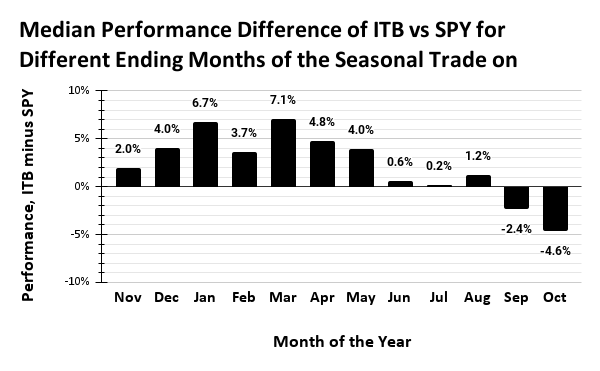
The next chart shows the median performance of the seasonal trade across the years for different ending months. This view shows a stark difference in performance during the seasonally strong period for home builder stocks (November to May) and the rest of the year. March shows up clearly as the optimal month for exiting the trade while January is a “sufficient” exit point. This chart directly guides traders to switch out of ITB for SPY by the end of the seasonally strong period as the performance differential rapidly declines. (Note the chart also includes the performance of the first two months of the 2024 to 2025 seasonal period…more on that below!)
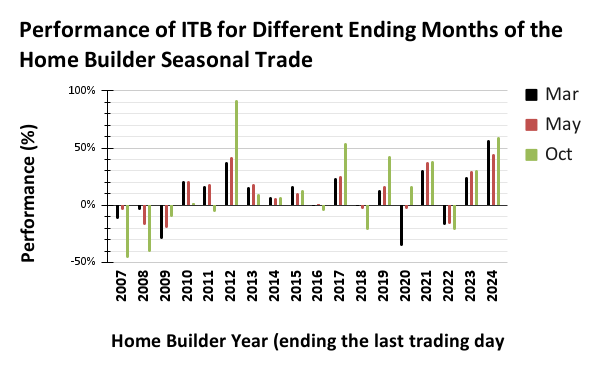
For reference, the chart below shows the absolute performance for ITB when ending the seasonal trade at the end of March, May, or October. Overall, even without comparing ITB to SPY performance, March turns out to be a good month to exit the seasonal trade on ITB.
The last home builder year was exceptionally strong with record March and May ending performance. The October ending performance was the second best ever. The last home builder year is even more exceptional given it came on the heels of a relatively strong year.
Note that the seasonal trade gets a boost from another seasonal pattern: the tendency for the S&P 500 to suffer its worst monthly drawdowns between August and October.
Trading Strategy: Buy the Dips
These “fun with numbers” exercises rarely produce straightforward trading strategies. The seasonal trade on ITB is about as “simple” as these trades can get. Still, to account for the possibility that the season will fail to unfold as expected, I allow myself the discretion to take profits along the way. If I am lucky, I can buy on the next dip to refresh the trade. This more frequent trading strategy worked well until the pandemic. The normal skepticism about home builders that produces periodic and significant sell-offs surprisingly dissolved even after the Fed tightened monetary policy in 2022. The persistent narrative of tight housing inventories and pent-up demand has captured imaginations and provided a simple enough justification to buy and hold builders throughout the calendar year.
That tailwind may finally be fading as affordability pressures reach the boiling point for buyers amid stubbornly high mortgage rates.
In December, 2024, ITB suffered its worst monthly performance (-16.5%) since its 33.3% collapse in March, 2020 (the start of the pandemic). Besides that tragic month, ITB last performed this poorly in June, 2010 (-16.6%) as the dust was finally settling after the Great Financial Crisis (GFC). In other words, December, 2024 was a historic extreme for ITB. With the S&P 500 down “only” 2.7%, the 2024 to 2025 seasonal period for trading home builders is off to its worst ever start since the GFC. If the seasonal pattern even plays a modest amount of catch-up, then ITB, and some constituent builders, provide excellent buy-the-dip opportunities. I will explore those trades in future housing posts.
In the meantime, before I could recognize that an extreme under-performance was underway, I started to accumulate ITB shares. The stock market is now close to oversold conditions, so I am tempted to start accumulating ITB again. However, January offers its own risks as many investors who did not want to recognize capital gains in the 2024 tax year may unleash their selling in January. As a result, I evaluate fresh ITB entry points after at least the first two trading days of the year.
How to Track the (Seasonal) Trade on Home Builders
Readers can follow my commentary on the housing market by subscribing to One-Twenty Two mailing list or by reviewing articles listed under the “housing category.” I also write on Seeking Alpha about the fundamentals of select home builders. Readers interested in more details about the seasonal trade on home builders can review the data and calculations located in Google sheets. The charts are also easier to read in the sheet. All data are sourced from Yahoo Finance and Google Finance through Google sheets. Post any questions below.
Be careful out there!
Full disclosure: long ITB shares