Stock Market Commentary
Holiday trading last week was deceptively lazy. The indices did a lot of churning, yet the S&P 500 and the ETF of small caps each made all-time highs at some point. A good number of individual stocks developed and followed through on bullish setups. For example, all week long, new highs greatly outnumbered new lows with Monday delivering the largest gap of 397 vs 6. Advancers outnumbered decliners Monday, Wednesday, and Friday. The technical signals on Friday were dominated by bullish setups. Now the stock market can look forward to December’s holiday cheer…unless the Federal Reserve somehow disappoints in its announcement on monetary policy the week before Christmas. Tensions could run high as the market wrestles with the potential for the Fed to withhold rate cut goodies.
The Stock Market Indices
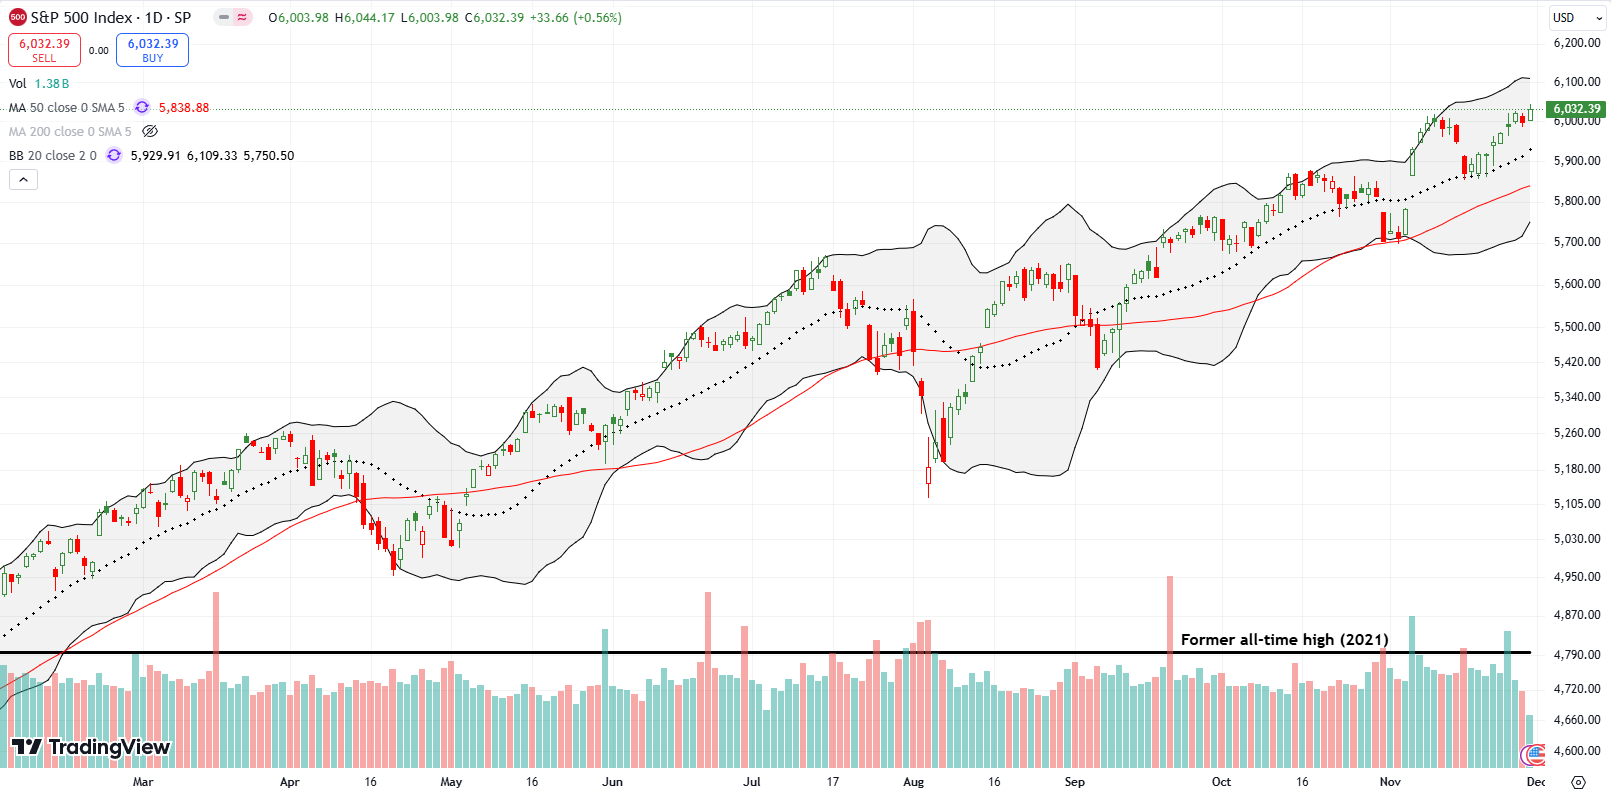
The S&P 500 (SPY) gained 1.1% for the week and closed at an all-time high. The gains were so incremental that the trading felt like a lazy holiday week. The all-time highs underline the successful test of support at the 20-day moving average (DMA) (the dotted line below) in the prior week.
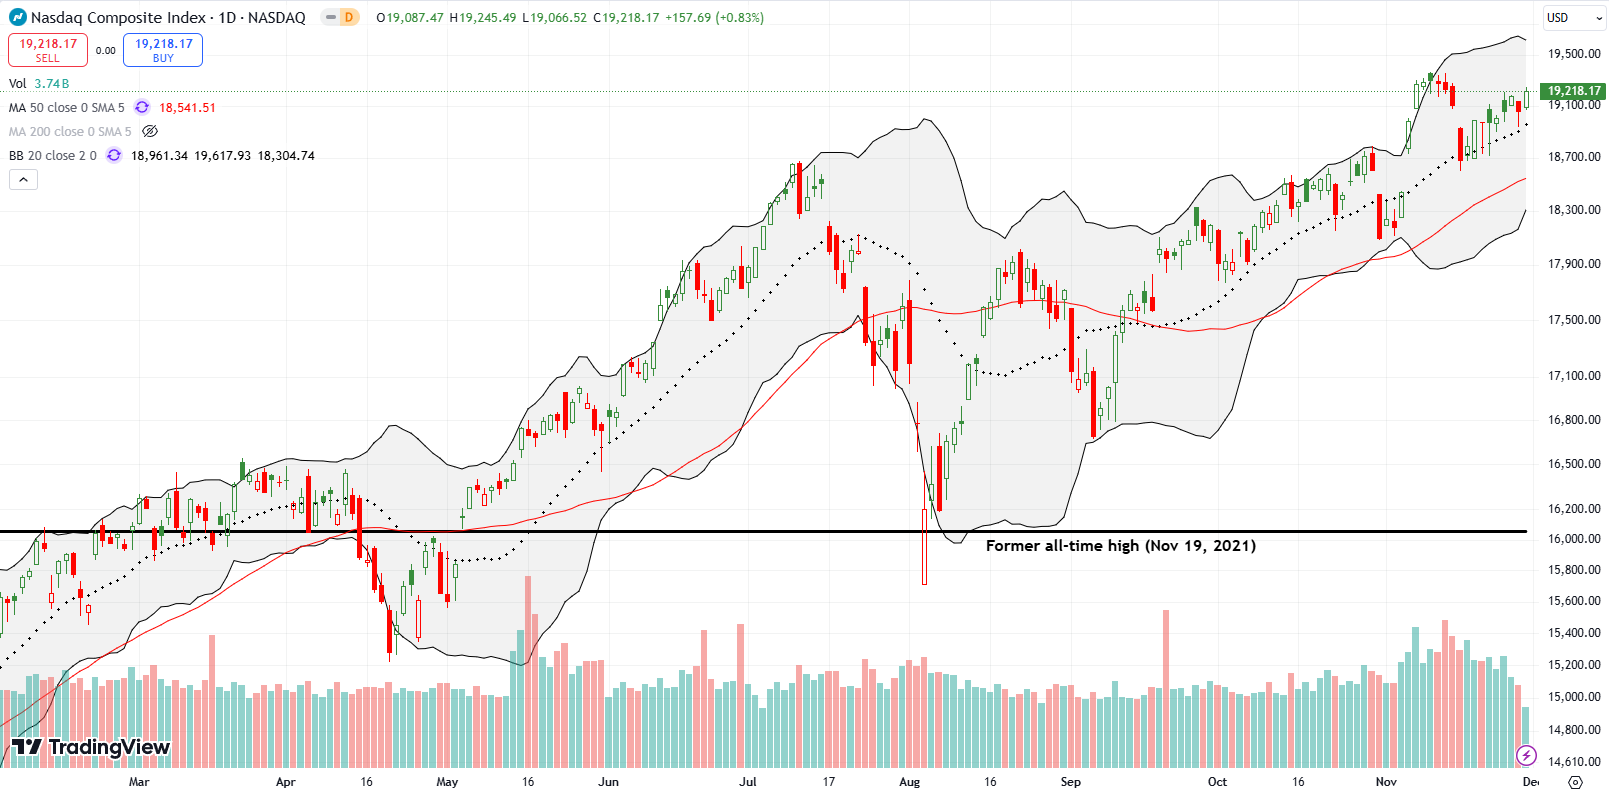
The NASDAQ (COMPQX) also gained 1.1% for the week. While the tech laden index finally closed its gap from earlier in the month, it has yet to challenge its all-time high. The NASDAQ even retested 20DMA support on Thursday. Like with the S&P 500, the NASDAQ’s trading was so tight on a daily basis that the trading felt like a lazy holiday week. The NASDAQ looks poised to continue grinding higher into December’s buys.
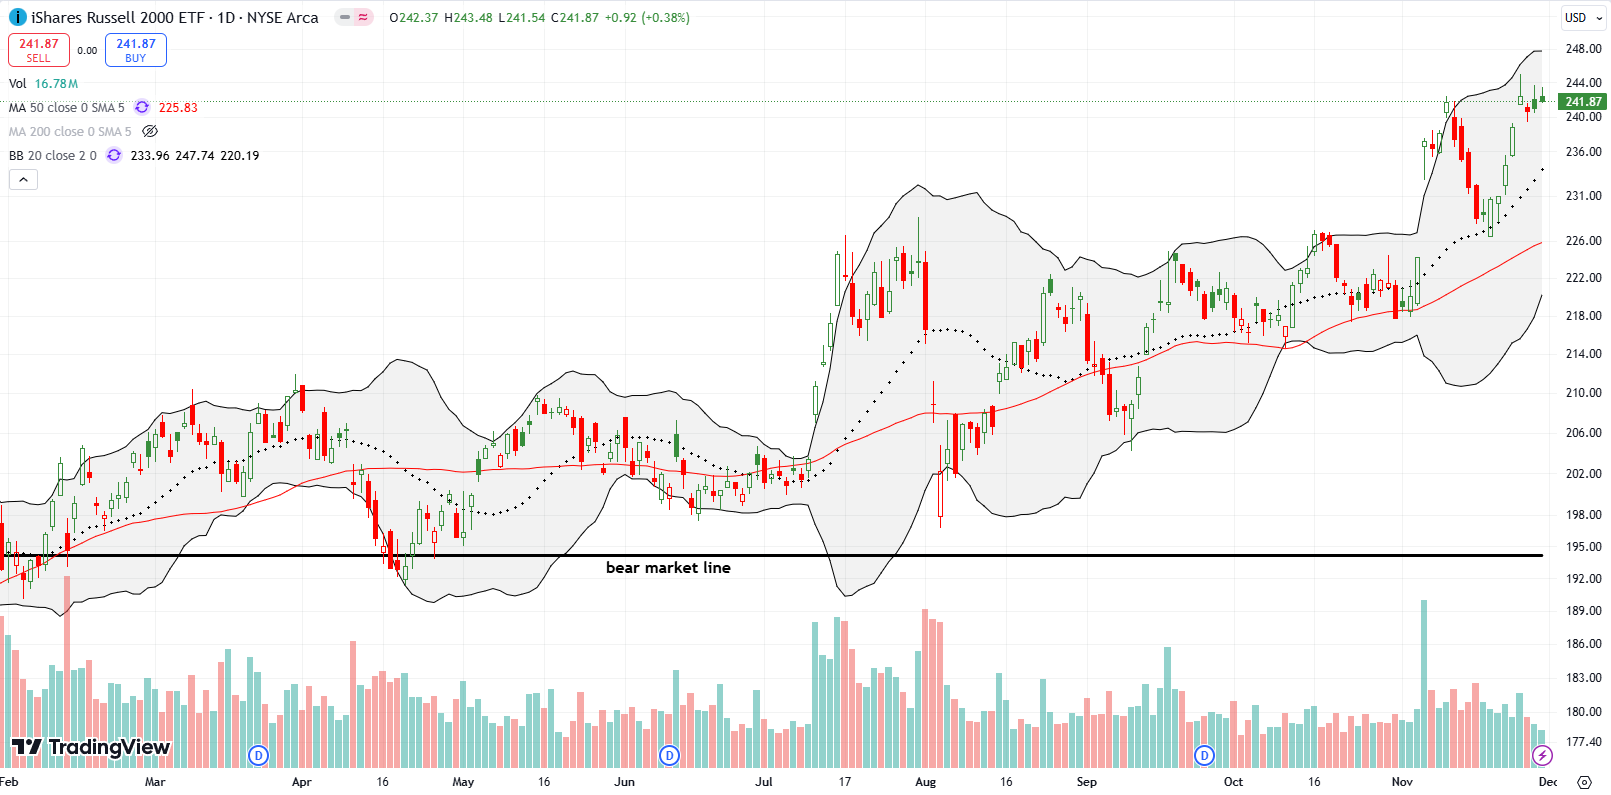
The iShares Russell 2000 ETF (IWM) broke out to an all-time high to start the week but faded sharply from its intraday all-time high. Trading lazily fell asleep from there as the ETF of small caps clung close to its all-time high. IWM looks like it printed another blow-off top, so I have muted expectations in the coming days.
The Short-Term Trading Call With Lazy Holiday
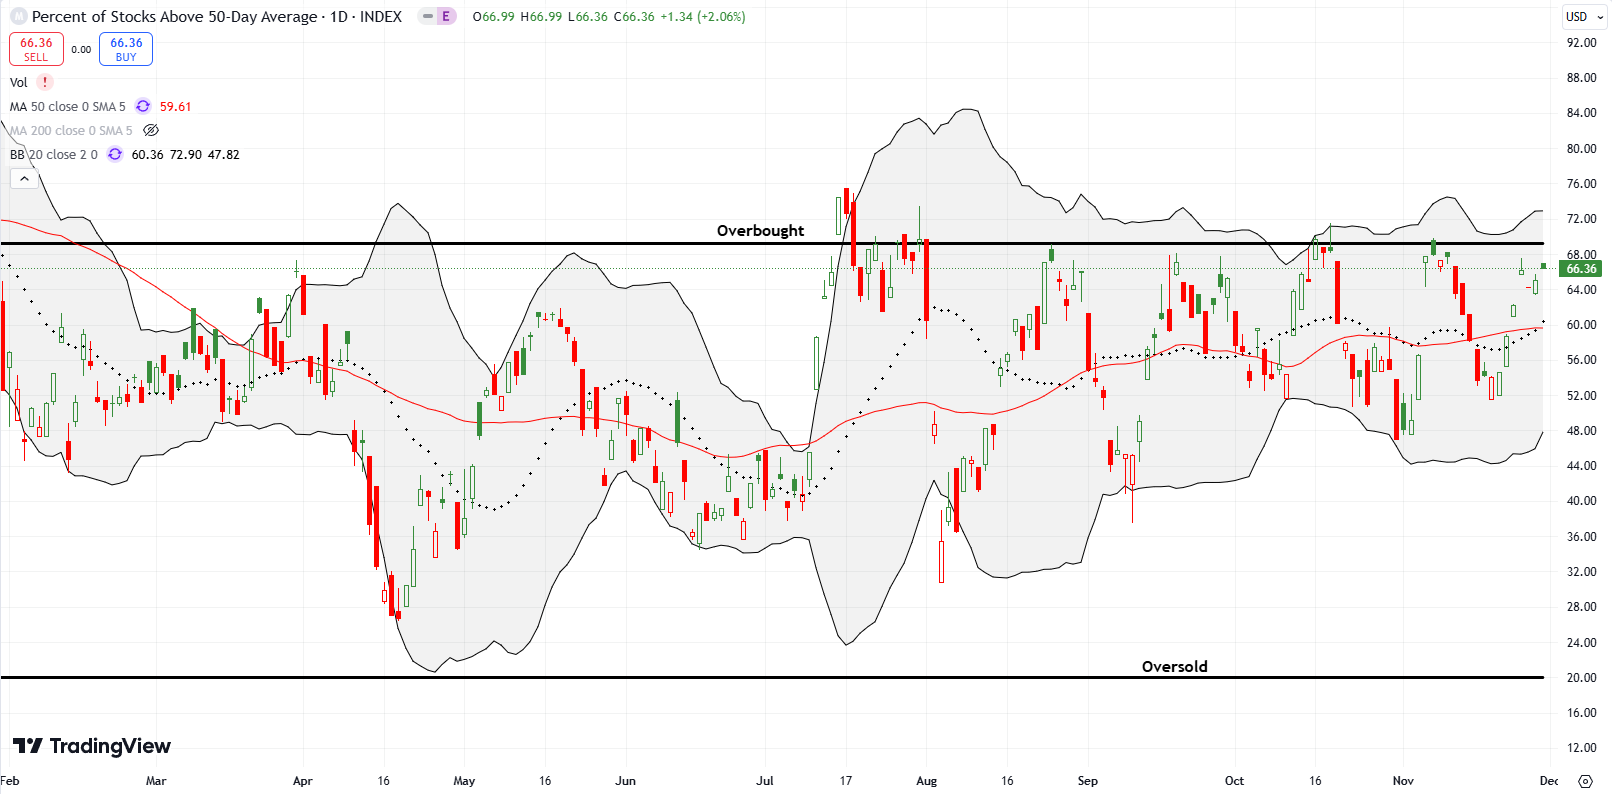
- AT50 (MMFI) = 66.4% of stocks are trading above their respective 50-day moving averages
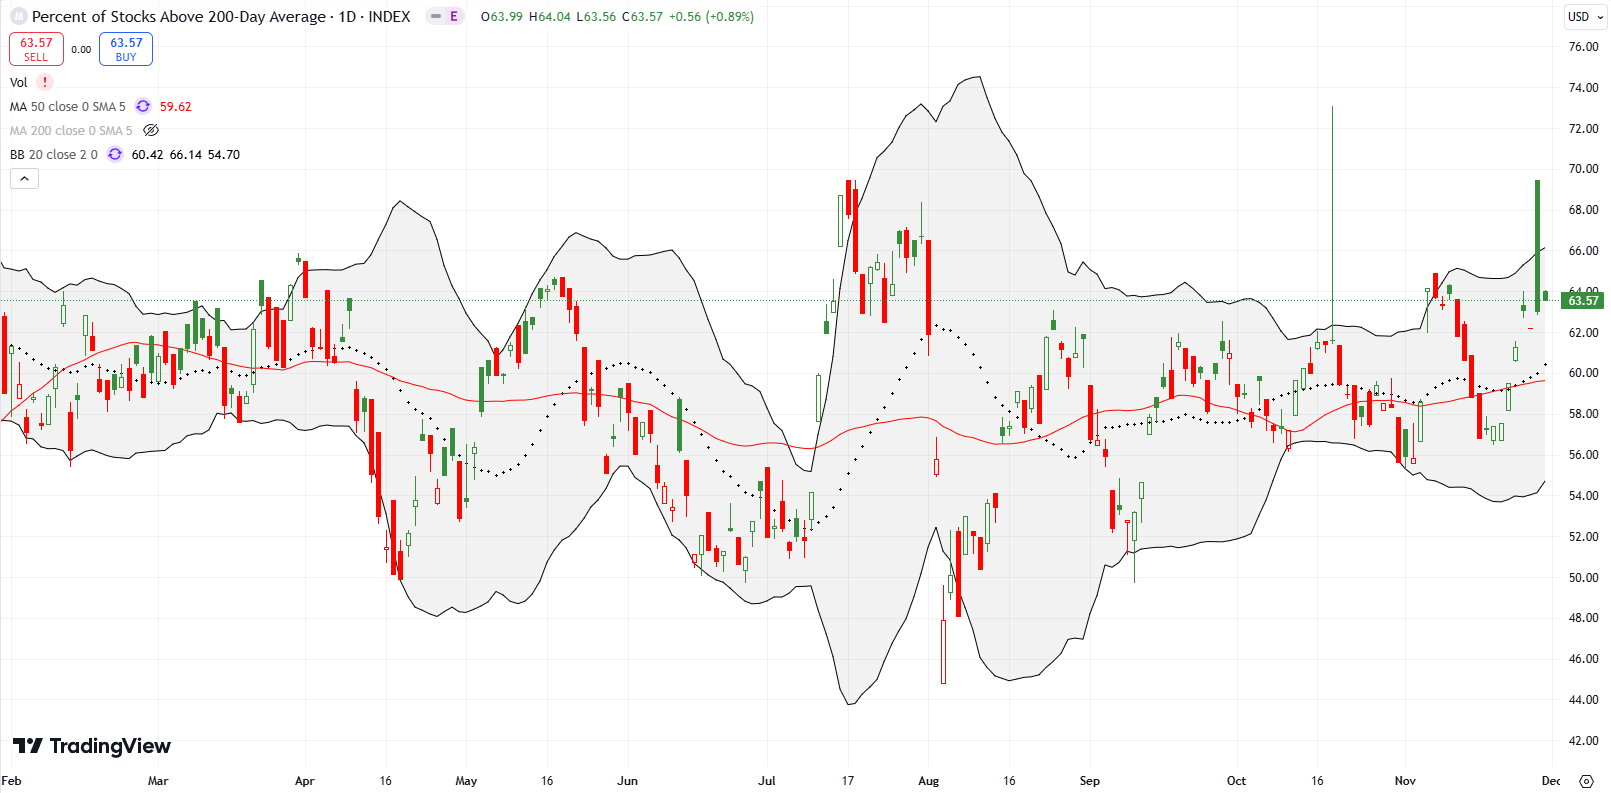
- AT200 (MMTH) = 63.6% of stocks are trading above their respective 200-day moving averages
- Short-term Trading Call: neutral
AT50 (MMFI), the percentage of stocks trading above their respective 50DMAs, closed the week at 66.4%. My favorite technical indicator is once again teasing a test of resistance at the overbought threshold (70%). If I am correct that last week’s lazy holiday trading set the market up for December buys, then AT50 should finally break into overbought territory. If instead AT50 reverses course and fails at the overbought threshold, I am prepared to flip (cautiously) bearish per the AT50 trading rules. As for most of this year, I will expect a bearish signal to last for a short and tight window.
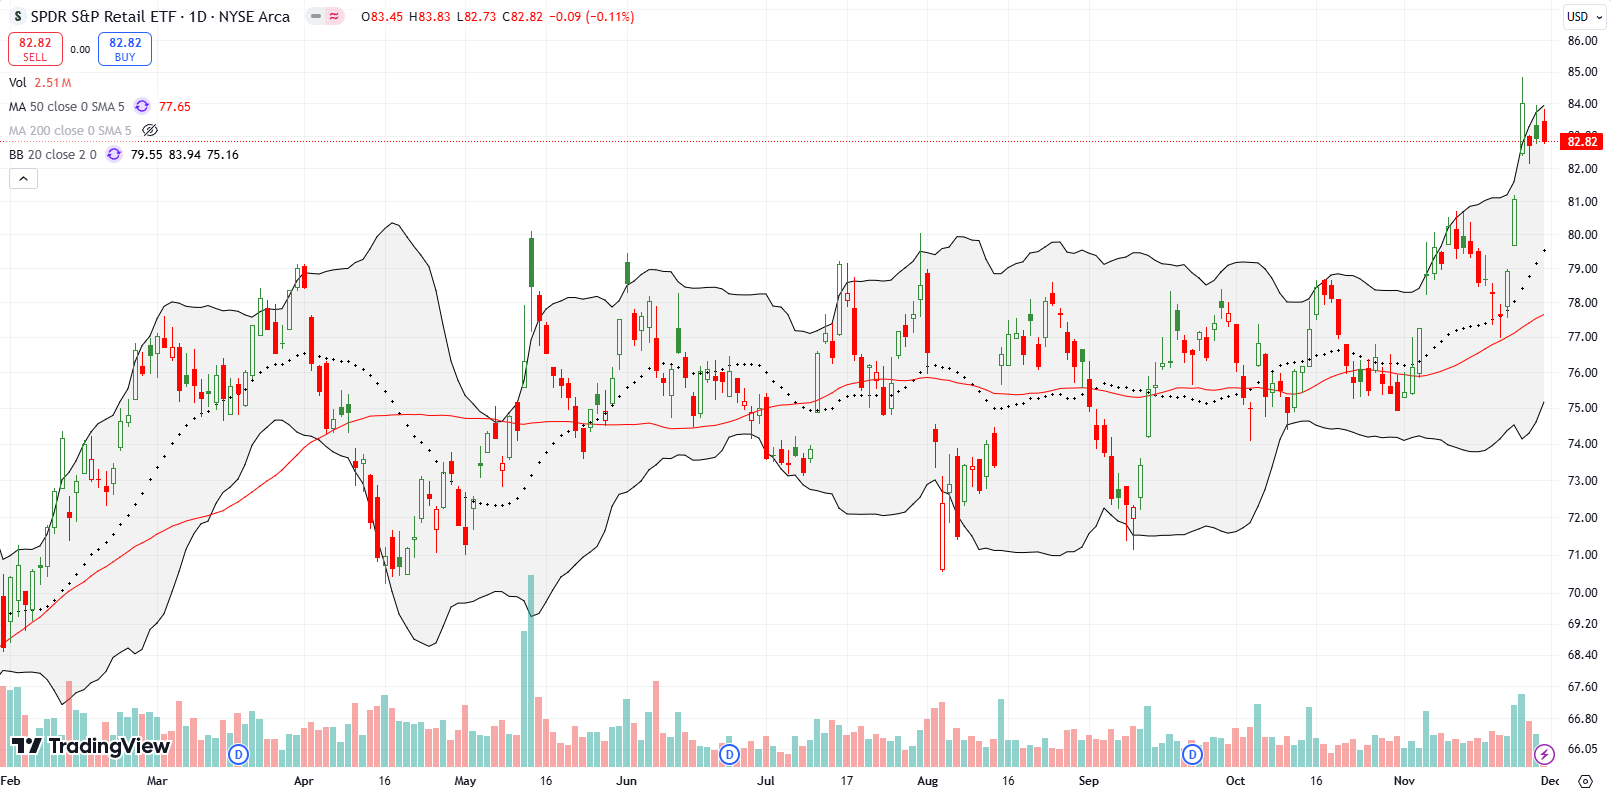
The SPDR S&P Retail ETF (XRT) was last this high back in February, 2022. Monday’s 3.6% breakout was all the excitement for the week. XRT immediately cooled down and lazily churned the rest of the week. I used Tuesday’s pullback to buy XRT call options. Given the holidays, a major XRT breakout seems aligned with December buys.
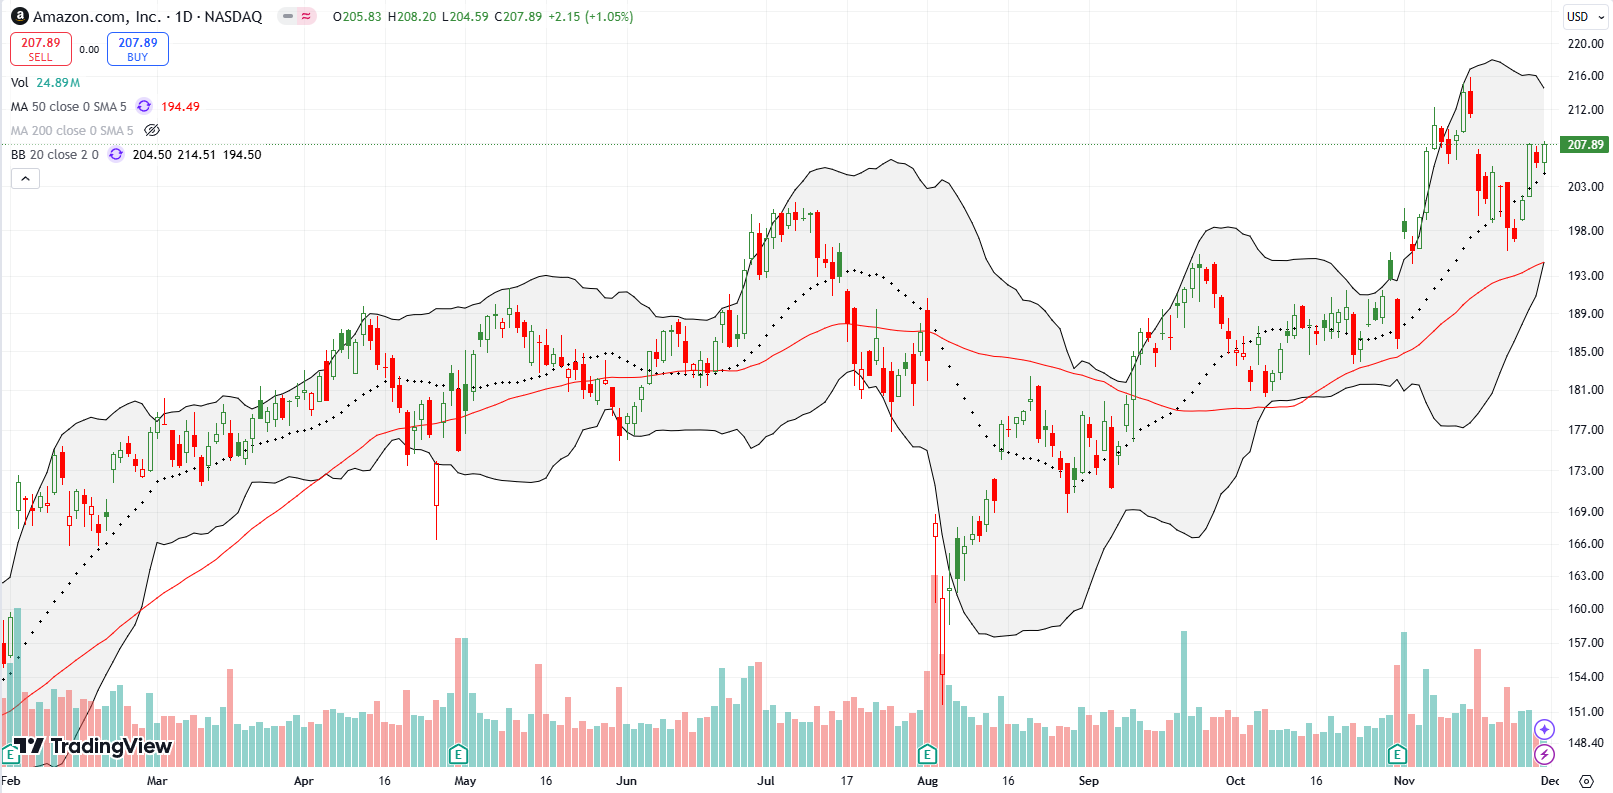
I also bought a call option on Amazon.com (AMZN). The online retailer bounced away from 50DMA support (the red line below) in the prior week, so I was late in starting a position. Tuesday’s 3.2% surge off 20DMA support motivated me to buy a call spread. I am targeting a test of and then a breakout above the all-time high set earlier in November.
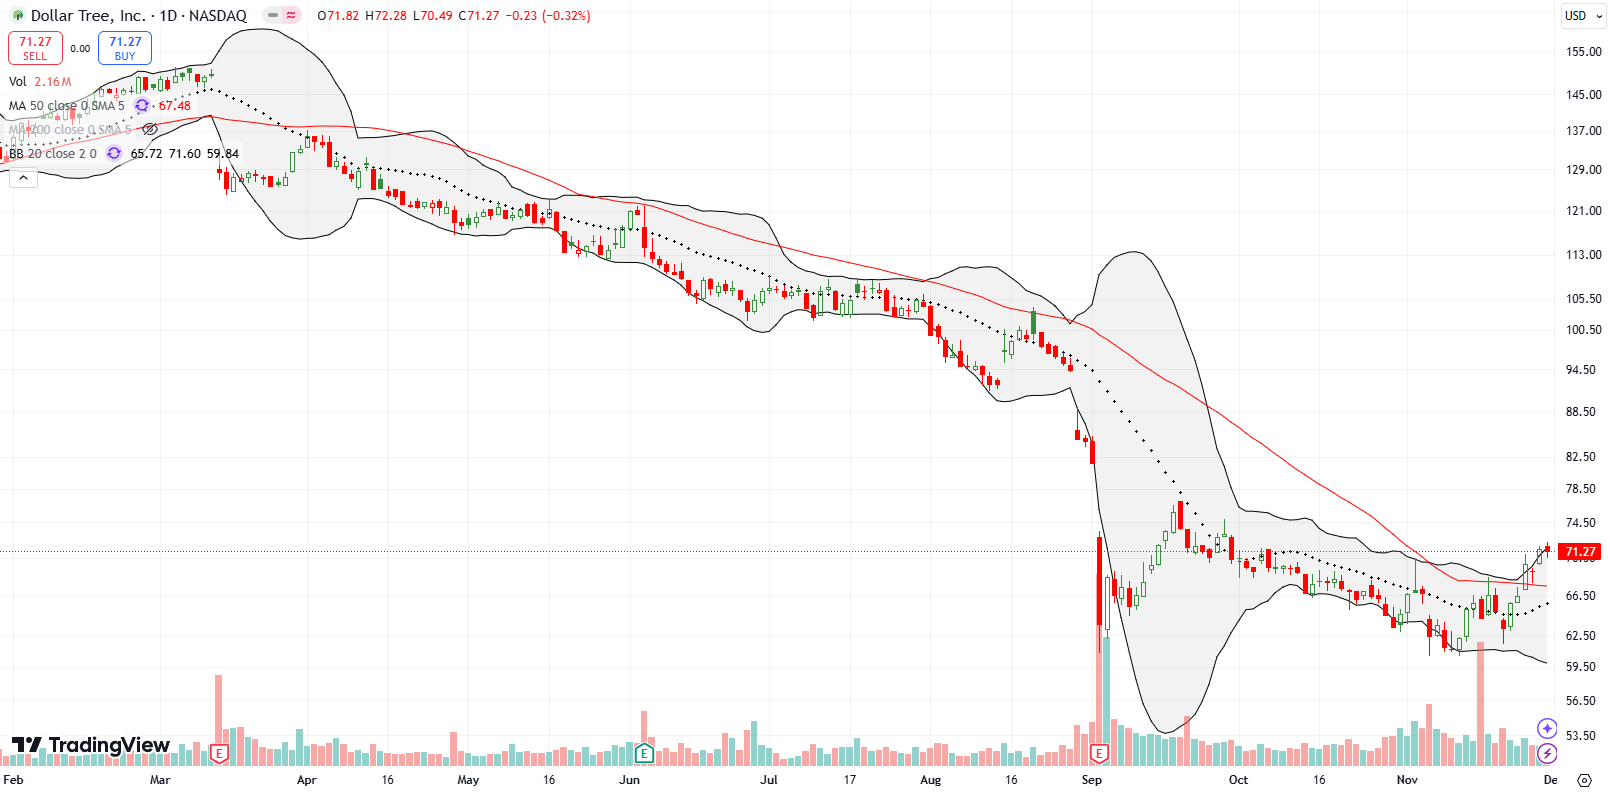
The Dollar Tree, Inc (DLTR) is vying to become a turnaround stock. The discount retailer confirmed a 50DMA breakout last week and set a near 2-month high. Even with earnings coming on December 4th, I see a decent risk/reward justifying speculating on a sustained turnaround. This December buy will stay active as long as DLTR trades above its 50DMA support.
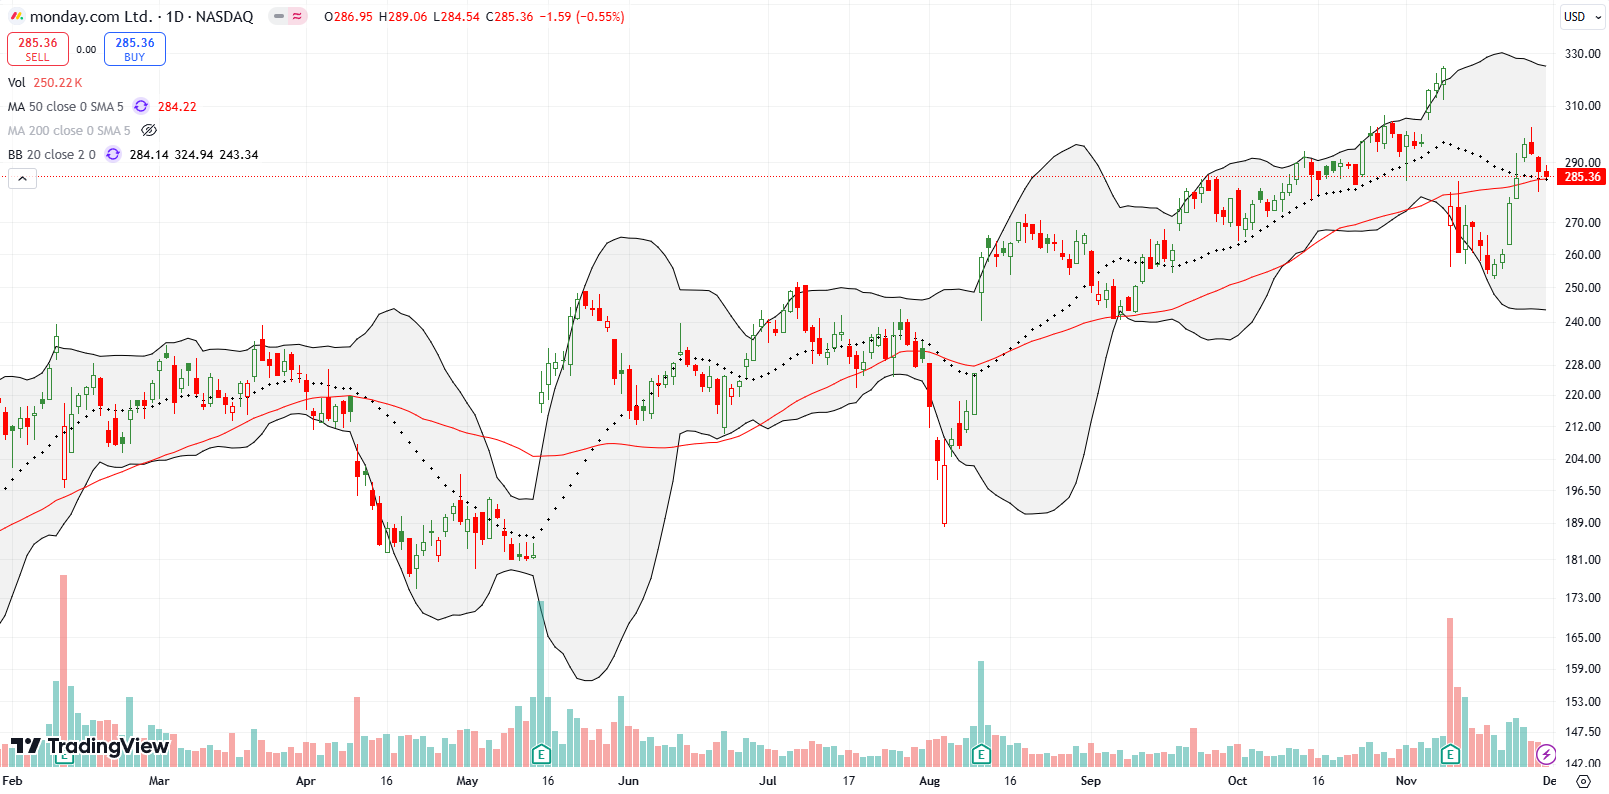
Two weeks ago, I made the case for going short against monday.com Ltd (MNDY). The stock triggered, I bought a put spread, and MNDY promptly bounced straight up for a 50DMA breakout. Sellers reversed that breakout by the end of the week. Now MNDY looks positioned to eventually fill its post-earnings gap down after a bounce from 50DMA support.
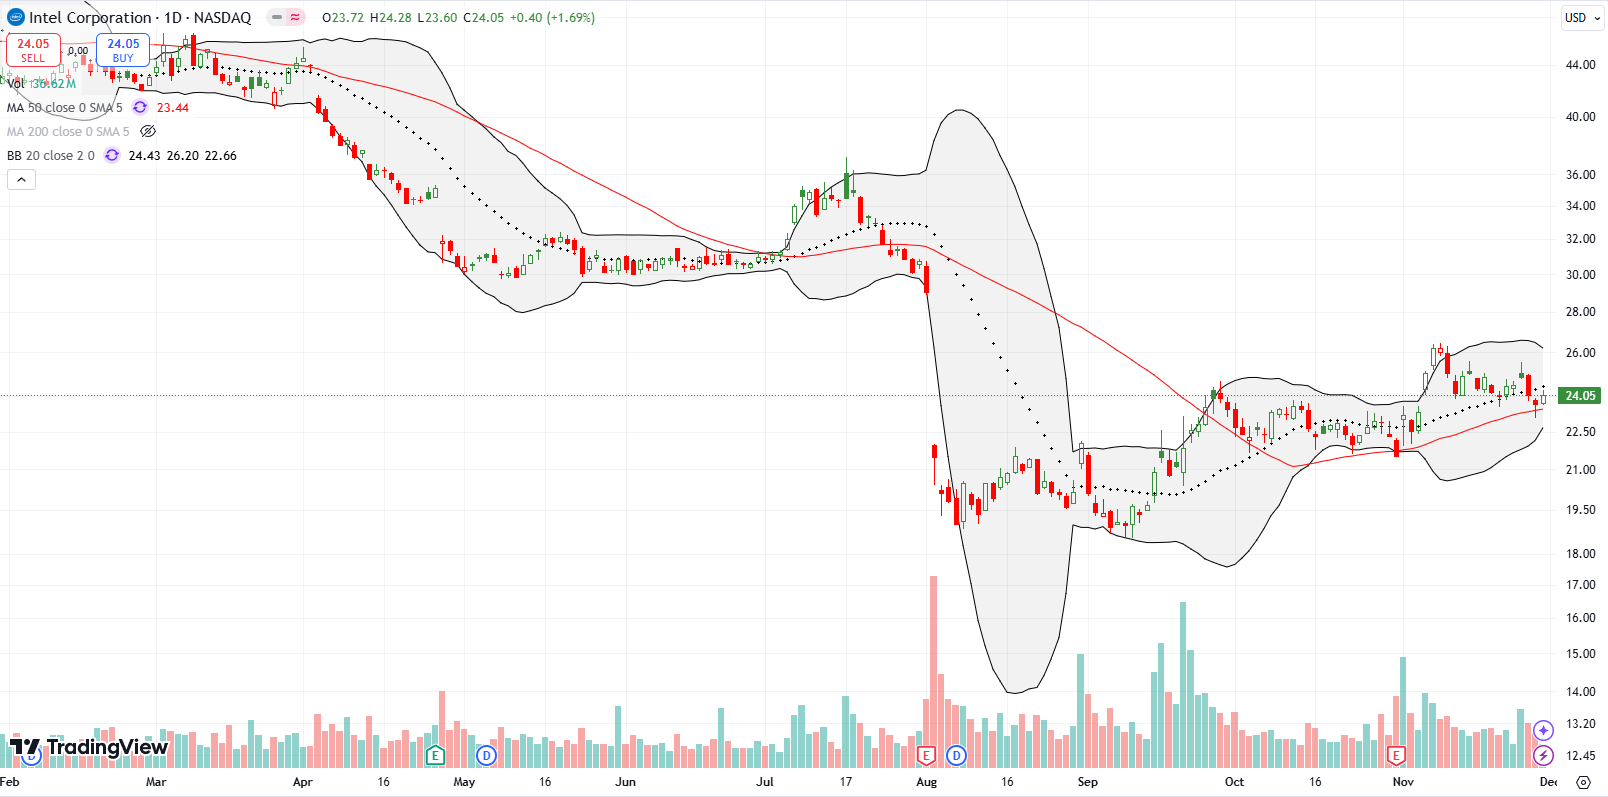
I have been waiting for Intel Corporation (INTC) to trigger a between-earnings trade. That moment finally came as INTC tested 20DMA and then 50DMA support. The bollinger bands (BBs) are also closing in again, so a big move, up or down, should be around the corner.
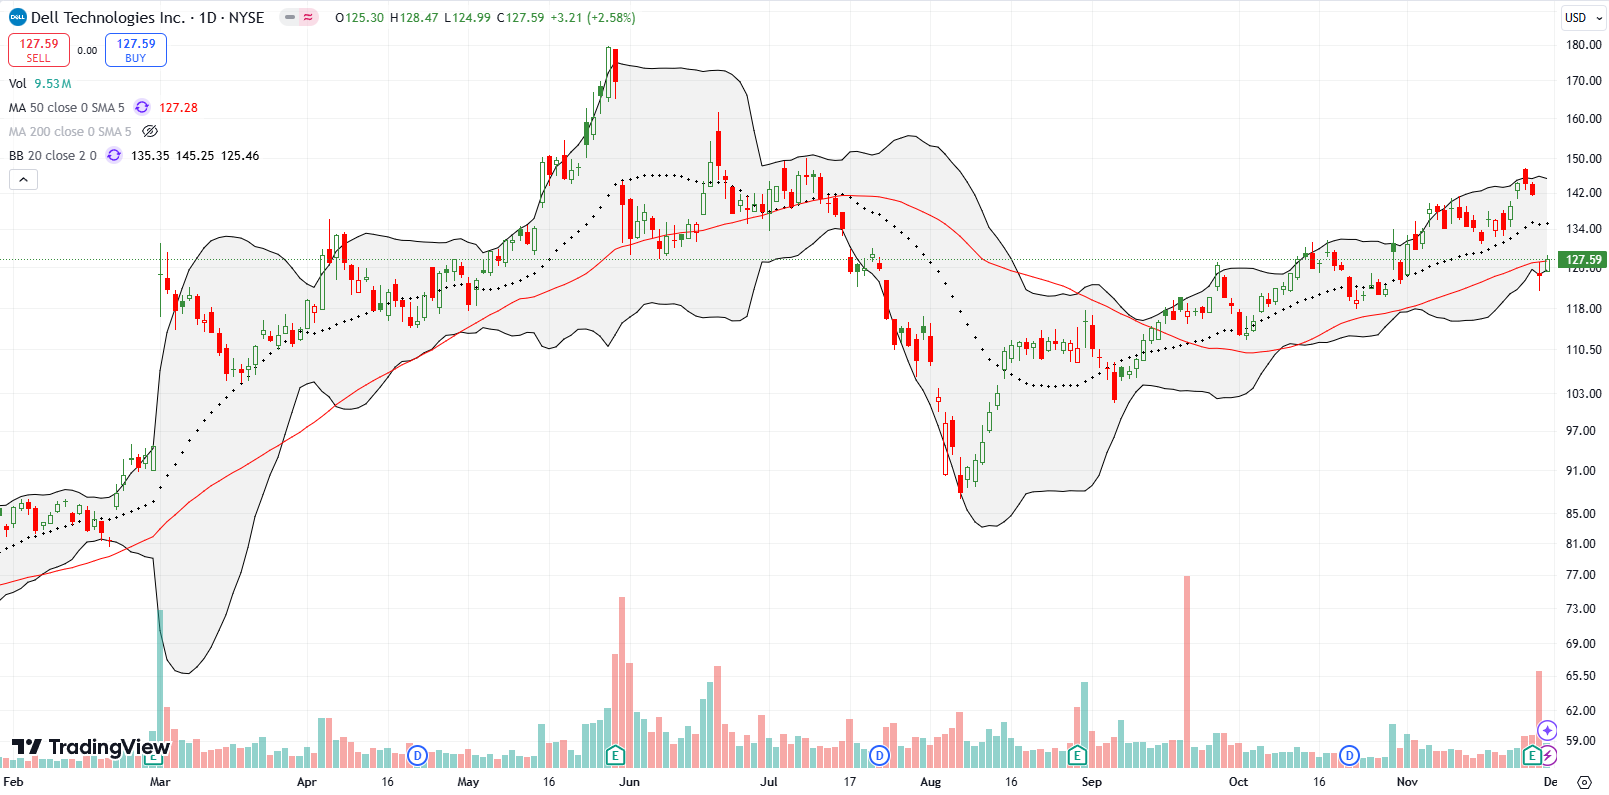
Dell Technologies Inc (DELL) pulled off an impressive uptrend after its summer low. DELL followed 20DMA support higher until a 12.3% post-earnings loss ended the streak. The stock ended the week testing its 50DMA as resistance. On a close above the 50DMA, I will add shares as one of my core positions in my generative AI trade.
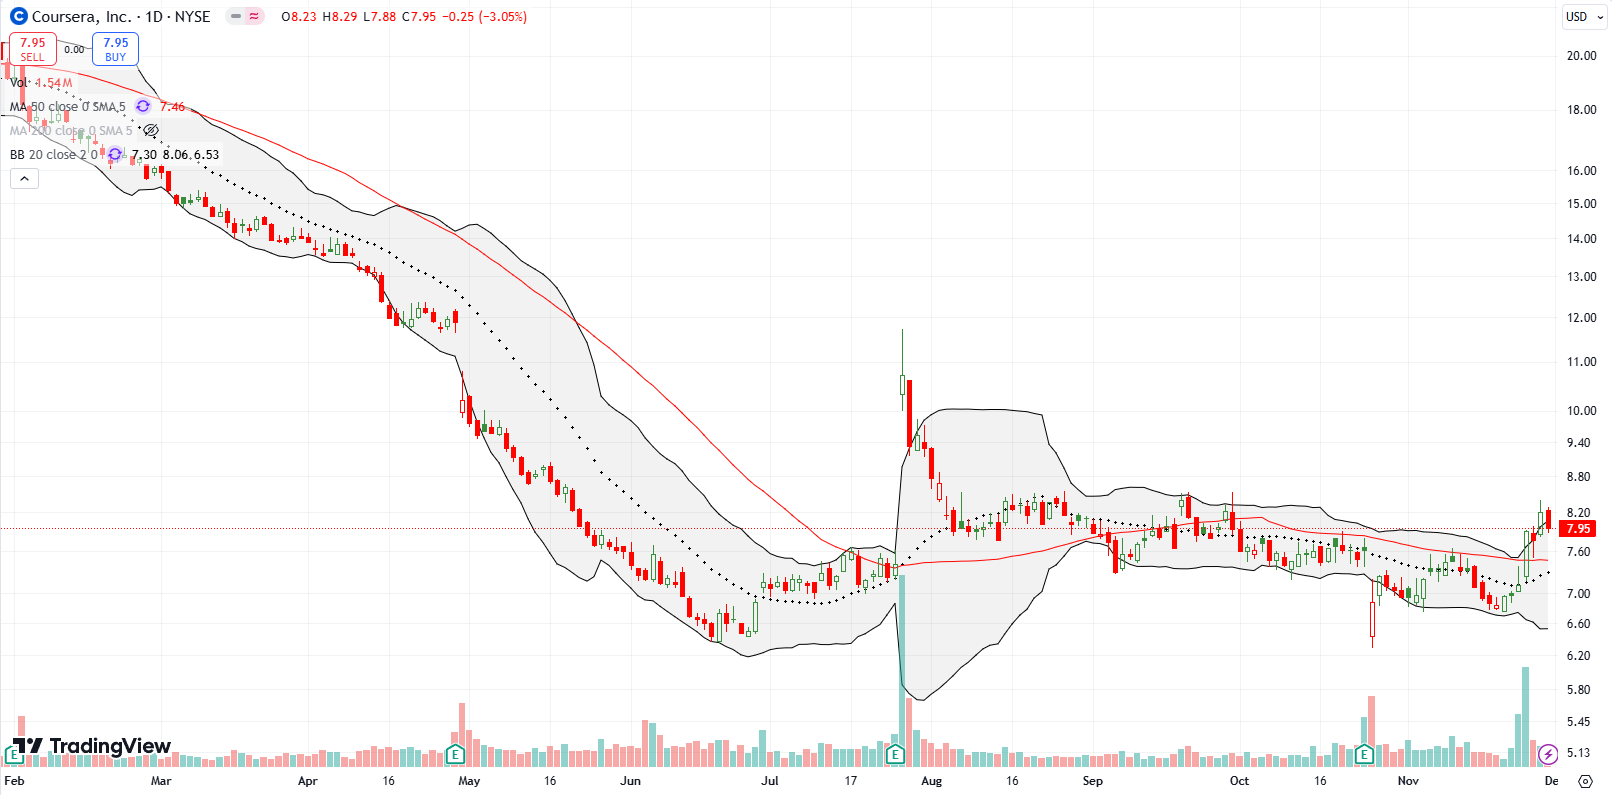
I am back at it again. After October’s post-earnings loss, I claimed that Coursera, Inc (COUR) would only be a buy on a 50DMA breakout. Last week delivered the trigger, and I bought shares on a confirmation of the breakout. Given the tentaive nature of this price action, I will stop out again if COUR closes below its 50DMA support.
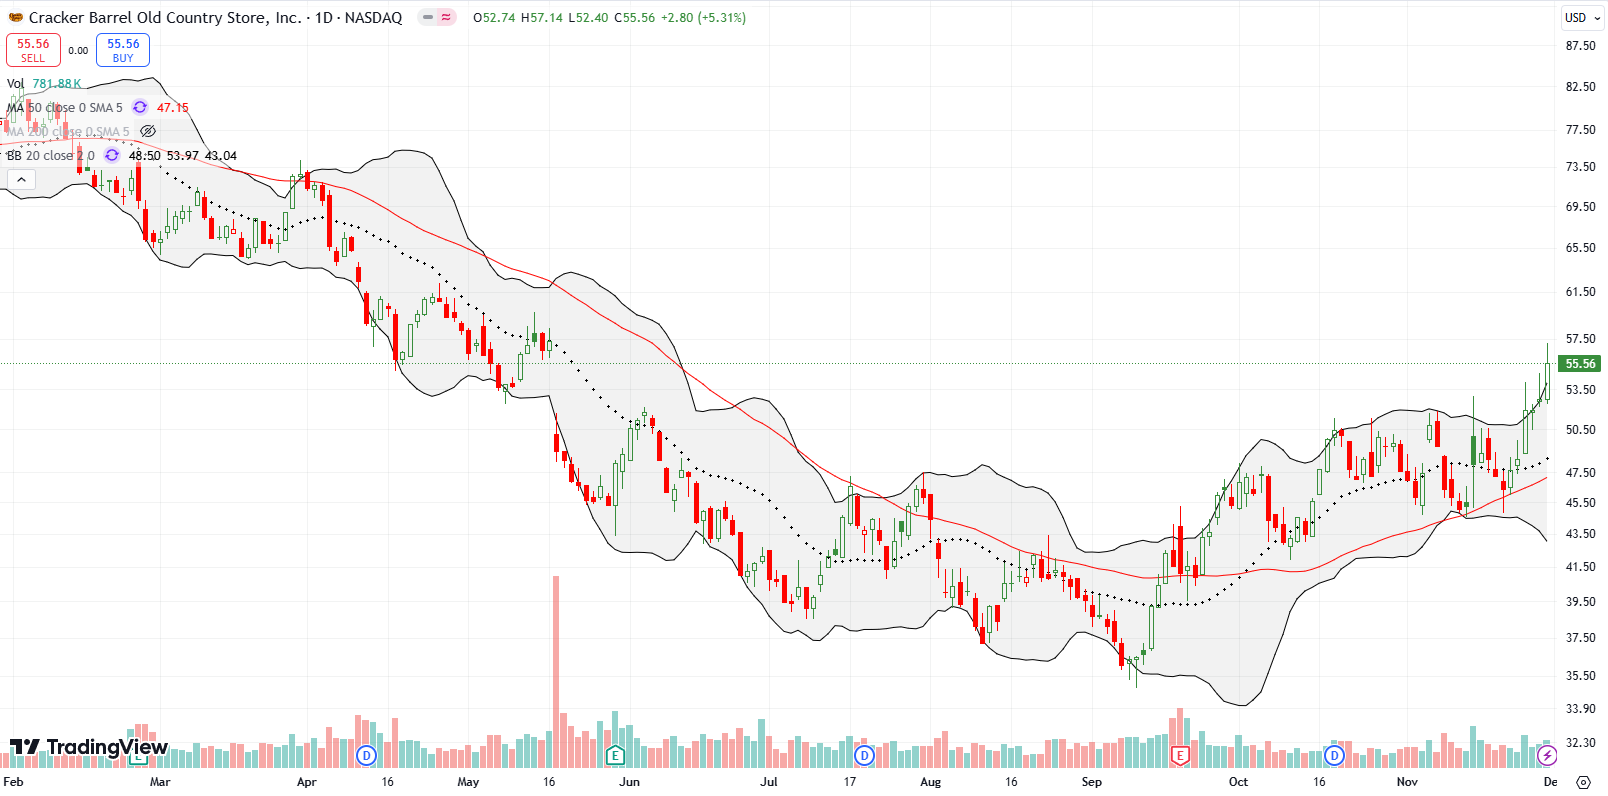
I am also back in Cracker Barrel Old Country Store, Inc (CBRL) as a turnaround stock. CBRL beautifully held 50DMA support twice last month. The first successful test came after a 6.2% post-earnings gain. Last week CBRL broke out to a 6-month high and almost filled a gap down from May. A sustainable turnaround looks like it is finally underway.
Be careful out there!
Footnotes
Subscribe for free to get email notifications of future posts!
“Above the 50” (AT50) uses the percentage of stocks trading above their respective 50-day moving averages (DMAs) to measure breadth in the stock market. Breadth defines the distribution of participation in a rally or sell-off. As a result, AT50 identifies extremes in market sentiment that are likely to reverse. Above the 50 is my alternative name for “MMFI” which is a symbol TradingView.com and other chart vendors use for this breadth indicator. Learn more about AT50 on my Market Breadth Resource Page. AT200, or MMTH, measures the percentage of stocks trading above their respective 200DMAs.
Active AT50 (MMFI) periods: Day #255 over 20%, Day #154 over 30%, Day #78 over 40%, Day #16 over 50%, Day #5 over 60% (overperiod), Day #93 under 70% (underperiod)
Source for charts unless otherwise noted: TradingView.com
Full disclosure: long SPY put spread, long IWM shares, long QQQ put spread, long AMZN call spread, long MNDY put spread, long DELL, long COUR, long CBRL
FOLLOW Dr. Duru’s commentary on financial markets via StockTwits, BlueSky, and even Instagram!
*Charting notes: Stock prices are not adjusted for dividends. Candlestick charts use hollow bodies: open candles indicate a close higher than the open, filled candles indicate an open higher than the close.

