Stock Market Commentary
This year’s Jackson Hole confab hosted by the Kansas City Federal Reserve delivered for financial markets. In his prepared speech, Fed Chair Jerome Powell issued an historic and classic sound bite for all of the history of monetary policy (emphasis mine): “The time has come for policy to adjust. The direction of travel is clear, and the timing and pace of rate cuts will depend on incoming data, the evolving outlook, and the balance of risks” (YouTube clip here).
Powell went on to acknowledge increasing weakness in the labor market. While the unemployment rate is still only 4.3%, this weakness has gone far enough for Powell (emphasis mine): “It seems unlikely that the labor market will be a source of elevated inflationary pressures anytime soon. We do not seek or welcome further cooling in labor market conditions.” In other words, the Fed is about as dovish as it can get at this juncture in the economy.
For those of us who have followed markets a long time, this environment feels and looks surreal. The S&P 500 is a hair away from all-time highs, yet the Fed is scrambling to cut interest rates. The is typically cutting rates in response to an economic emergency that has helped to pummel the stock market and/or the economy through a big sell-off. Thus, forgive me for wondering aloud whether the stock market has already priced in a lot of future rate cuts.
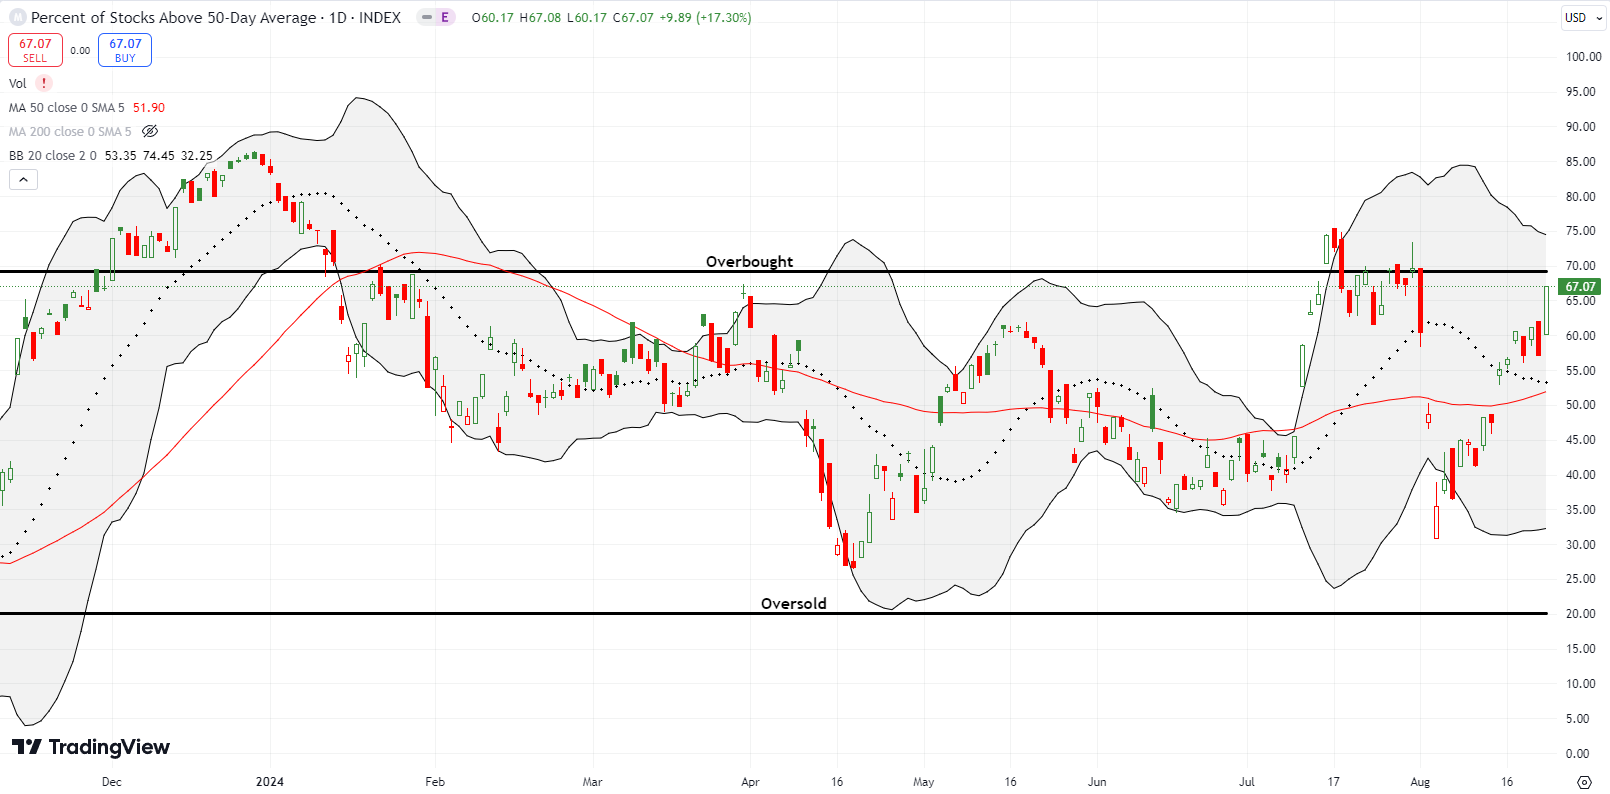
The trading action the day before Jackson Hole adds to my intrigue. Another classic topping pattern showed up in the form of a bearish engulfing pattern across all the major indices. Since the market has invalidated several topping patterns this year, I had to see follow-through selling before believing my eyes. Friday’s party of the doves stopped the bears in their tracks. Instead of a reversal of a lot of the recent gains, it seems the time has come for overbought trading. Market breadth closed the week directly below the overbought threshold.
The Stock Market Indices
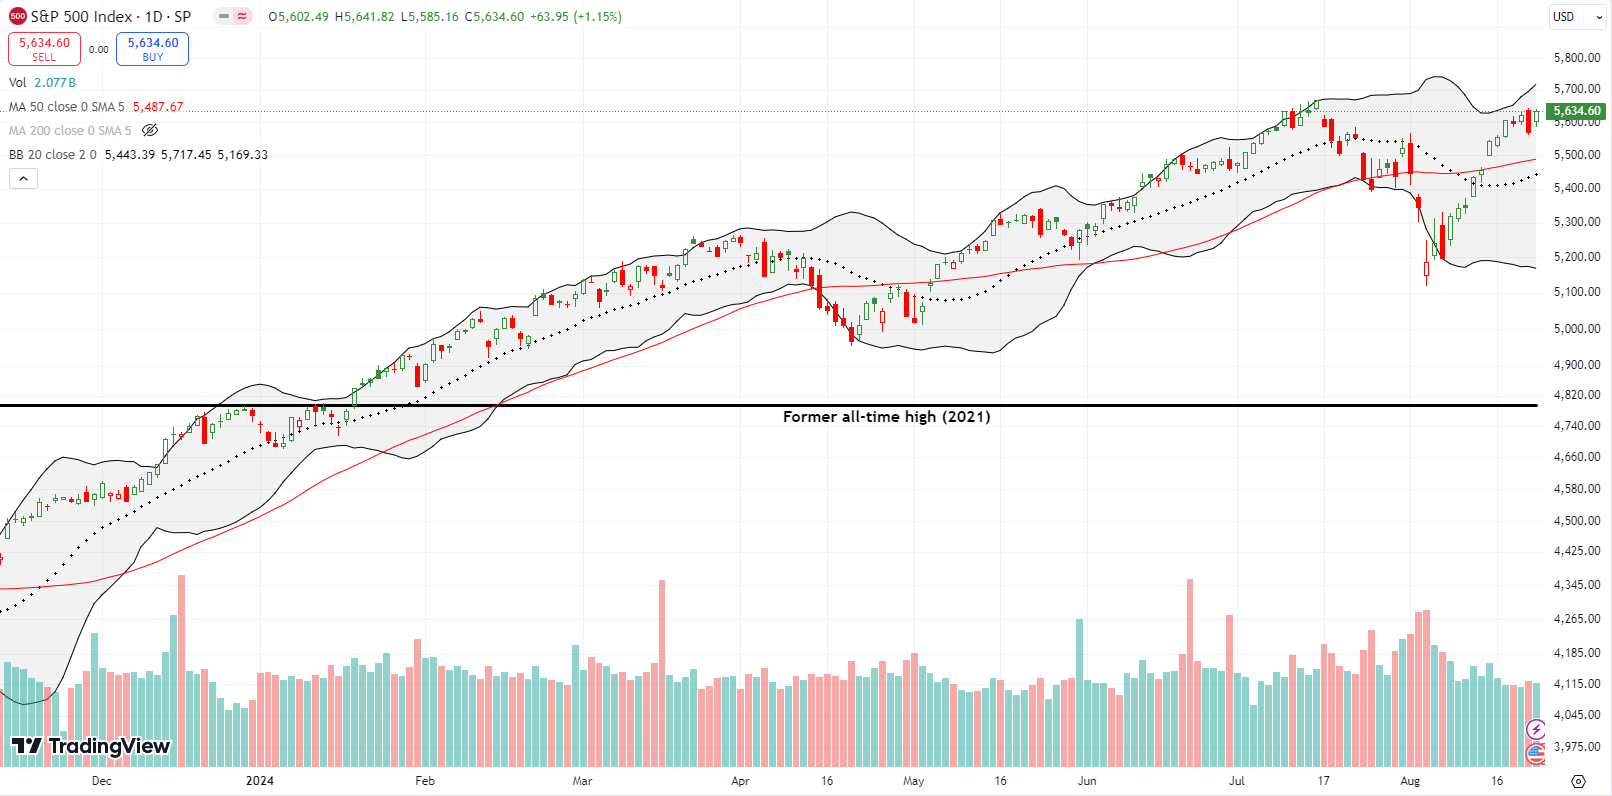
The S&P 500 ended the week at the edge of invalidating its bearish engulfing topping pattern. The index is also a nudge away from an all-time high. Such a moment will officially erase the memory of the angst from the beginning of the month. Already, the index is up 11 of the last 14 days since the August throes and low. The time has come for sellers to make a last stand before the bulls push the S&P 500 much higher from here.
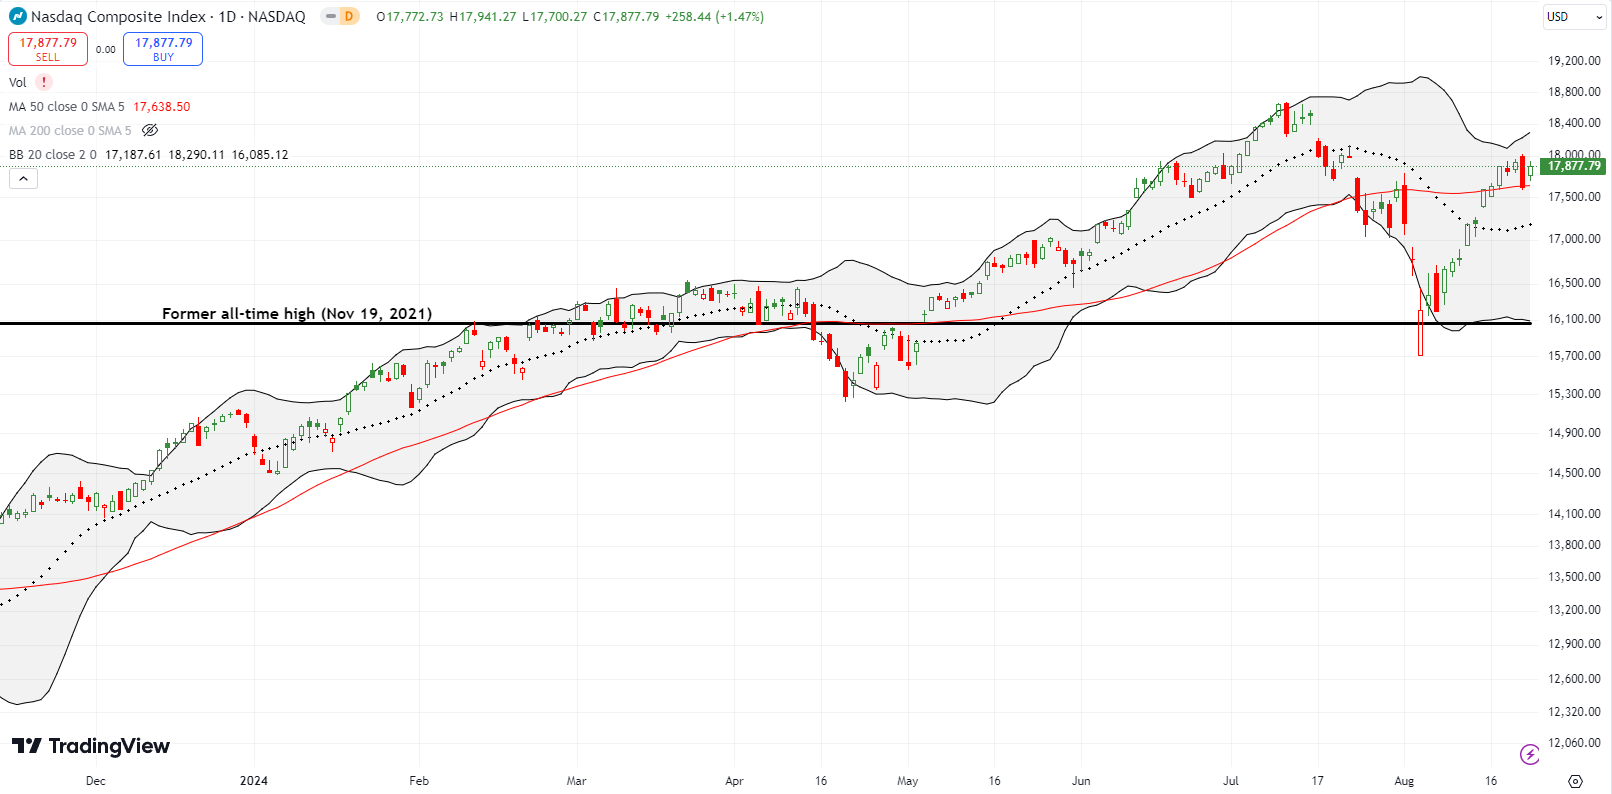
The NASDAQ (COMPQ) still has some room to go before retesting its all-time high. In the meantime, the tech laden index is fighting to hold its 50-day moving average (DMA) (the red line below) as support. Like the S&P 500, the NASDAQ has rallied nearly straight up since the August calamity.
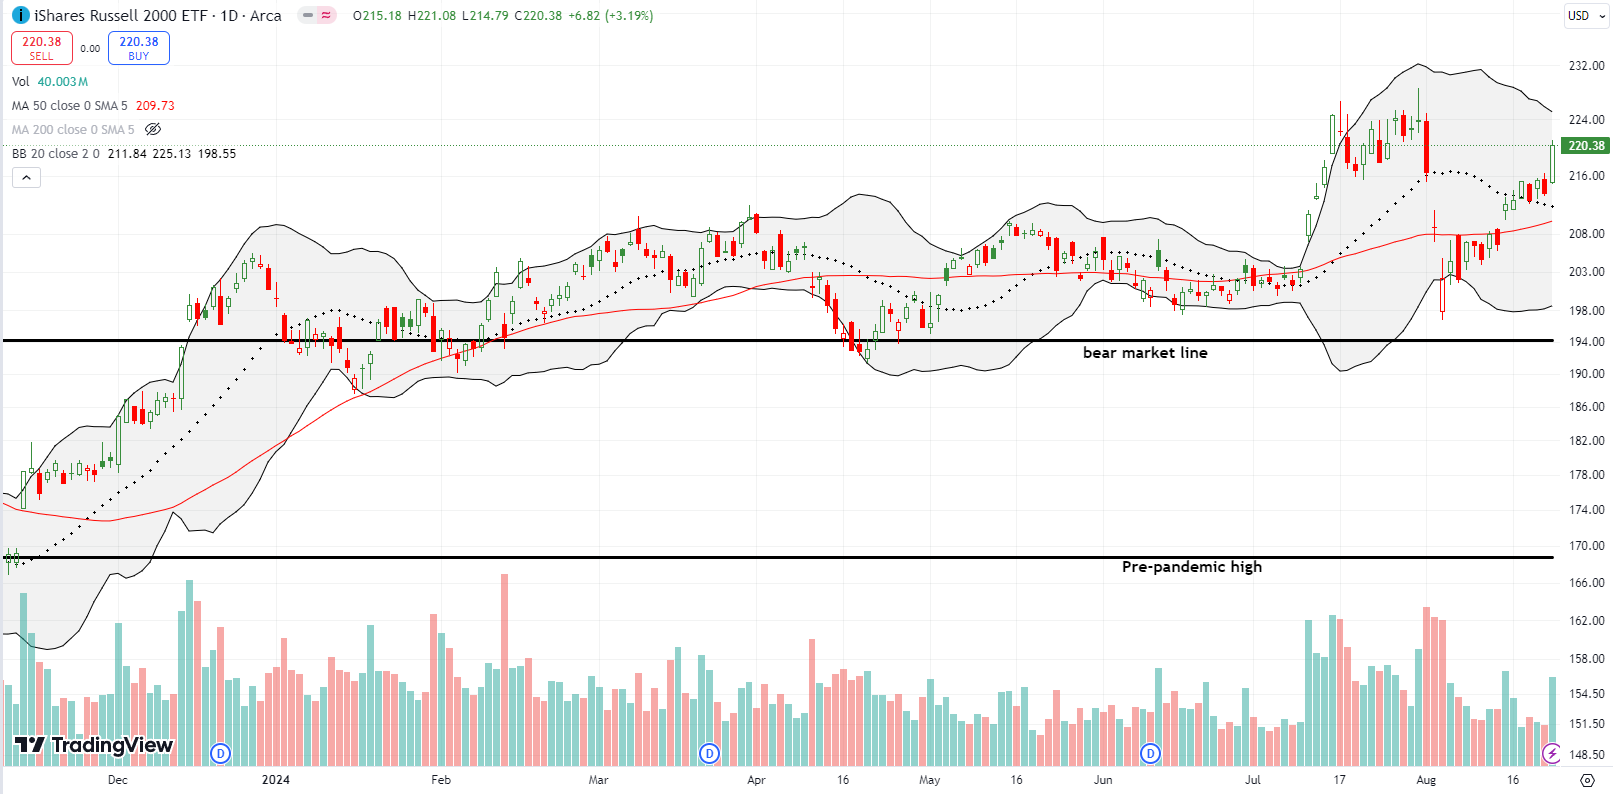
The iShares Russell 2000 ETF (IWM) is still trying to resume the strength from the summer’s brief yet powerful rotation. IWM took the “time has come” green light as license to jump 3.2%, IWM’s biggest day since July 16th when the ETF printed its closing high for the year. The ETF of small caps still has a little more work to do to invalidate the blow-off tops from July. I remain as bullish as before on IWM; I am holding shares and a call spread bought during the August calamity. I rolled the long side of the call spread to a higher strike. Last week I also flipped some shorter-term IWM calls. I hope to continue buying IWM dips.
The Short-Term Trading Call When The Time Has Come
- AT50 (MMFI) = 67.1% of stocks are trading above their respective 50-day moving averages
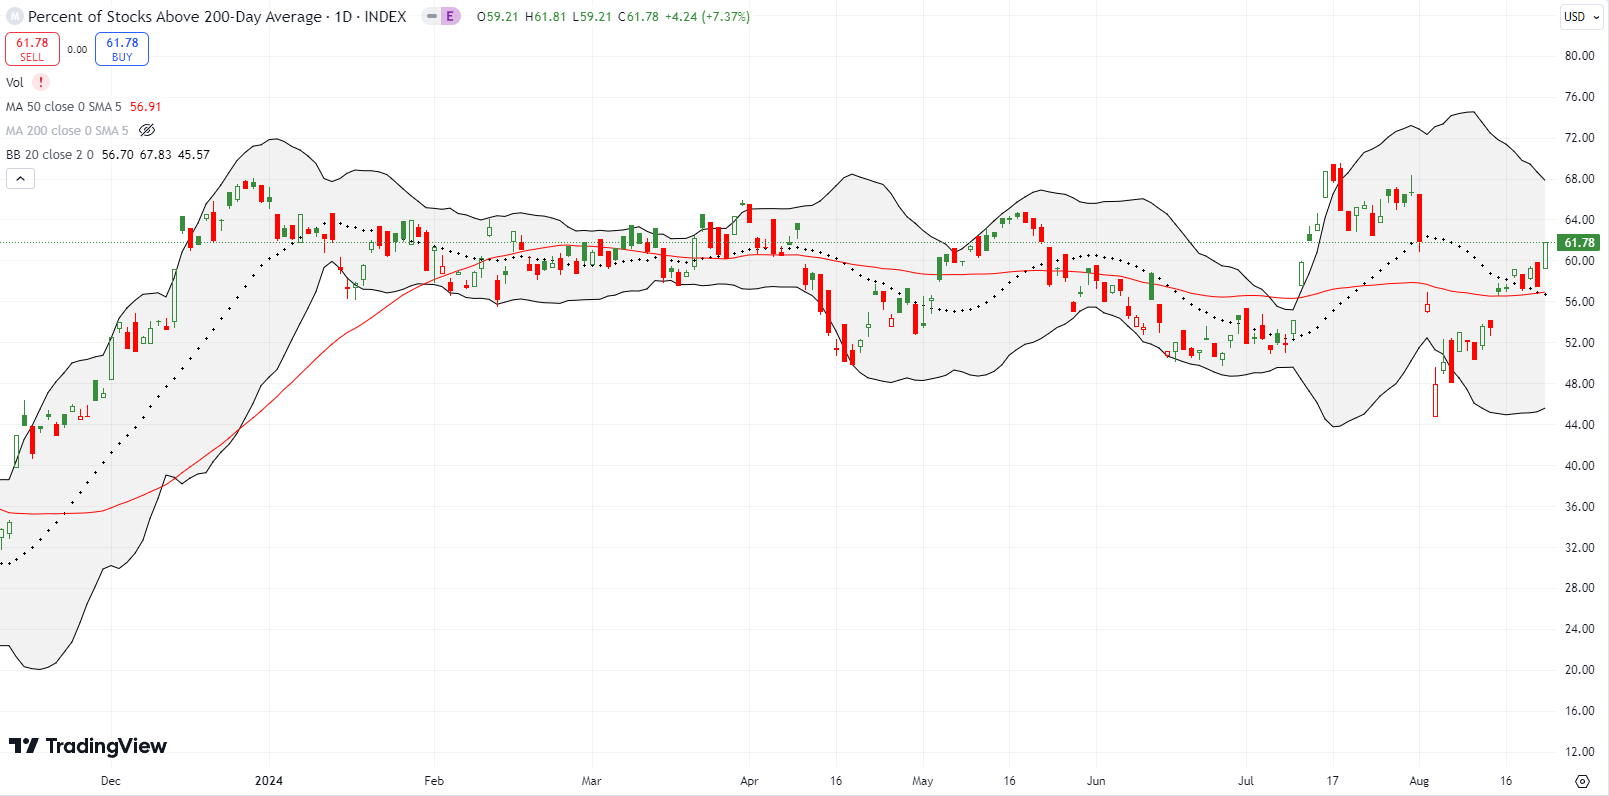
- AT200 (MMTH) = 61.8% of stocks are trading above their respective 200-day moving averages
- Short-term Trading Call: neutral
AT50 (MMFI), the percentage of stocks trading above their respective 50DMAs, closed the week at 67.1%, just a small push away from the overbought threshold. The time has come for a new overbought period as the dovishness from Fed Chair Jerome Powell finally gave the market what it has desired all year – a confirmation for a delivery date on rate cuts.
Of course, given September is the second of the stock market’s three most dangerous months, I will be on alert for flipping bearish on a confirmed rejection from the overbought threshold or a fall from overbought conditions. The AT50 trading rules have faced a number of challenges this year, but the lost opportunity of missing on trading rule wins far outweighs the risk of using discretion to completely ignore the rules. The presumed risk/reward of using options is most skewed toward reward from “unexpected” moves off market extremes.
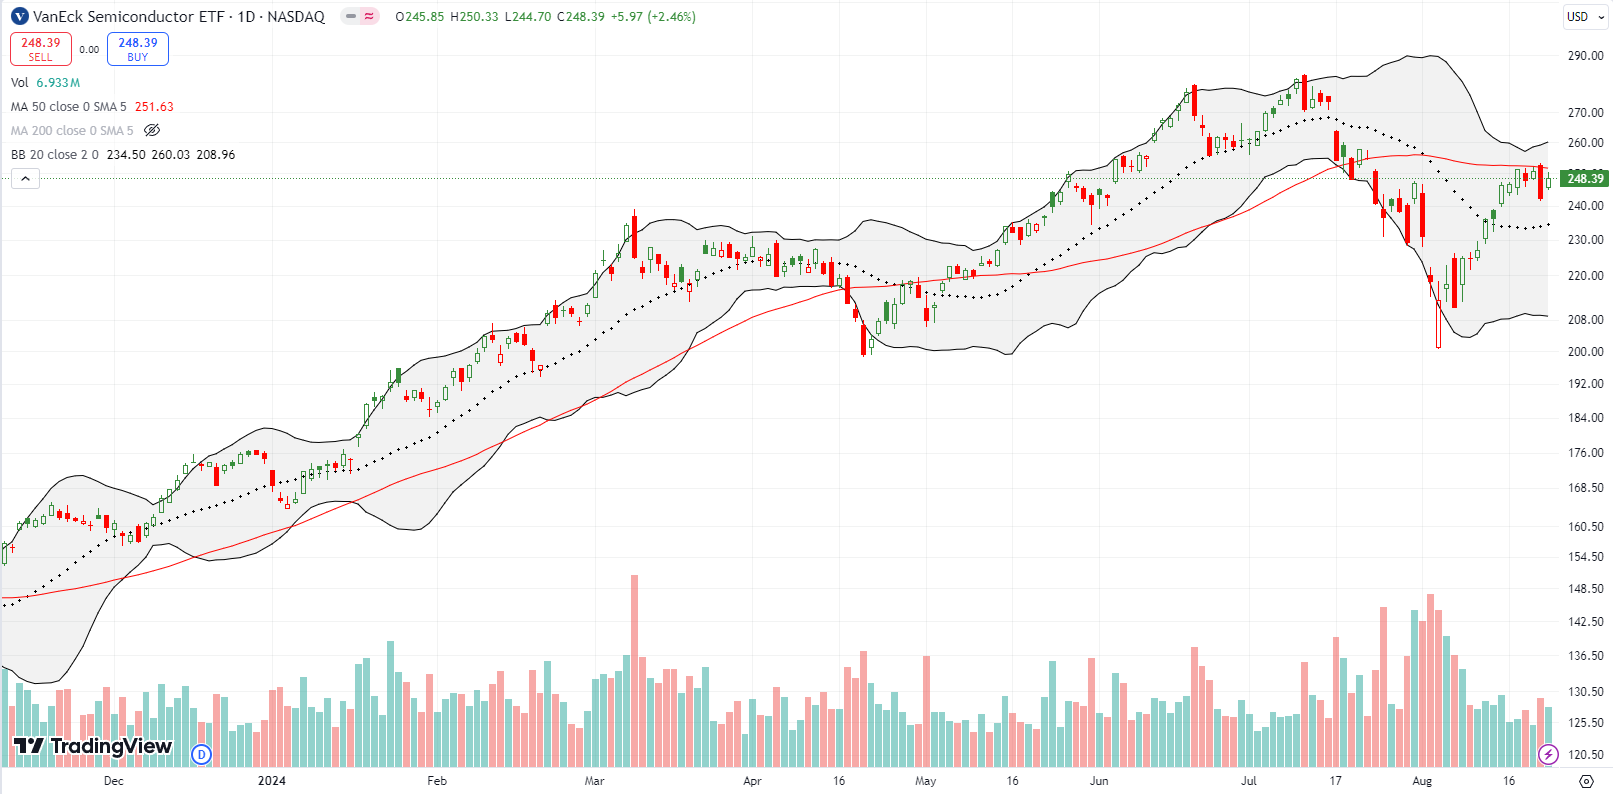
The VanEck Semiconductor ETF (SMH) is struggling at 50DMA resistance in the same way that the NASDAQ is fighting to hold support at its 50DMA. At around $240, I took profits on SMH shares I bought during the August calamity. I do not anticipate trading SMH again until after earnings from NVIDIA (NVDA) this week (after market August 28th).
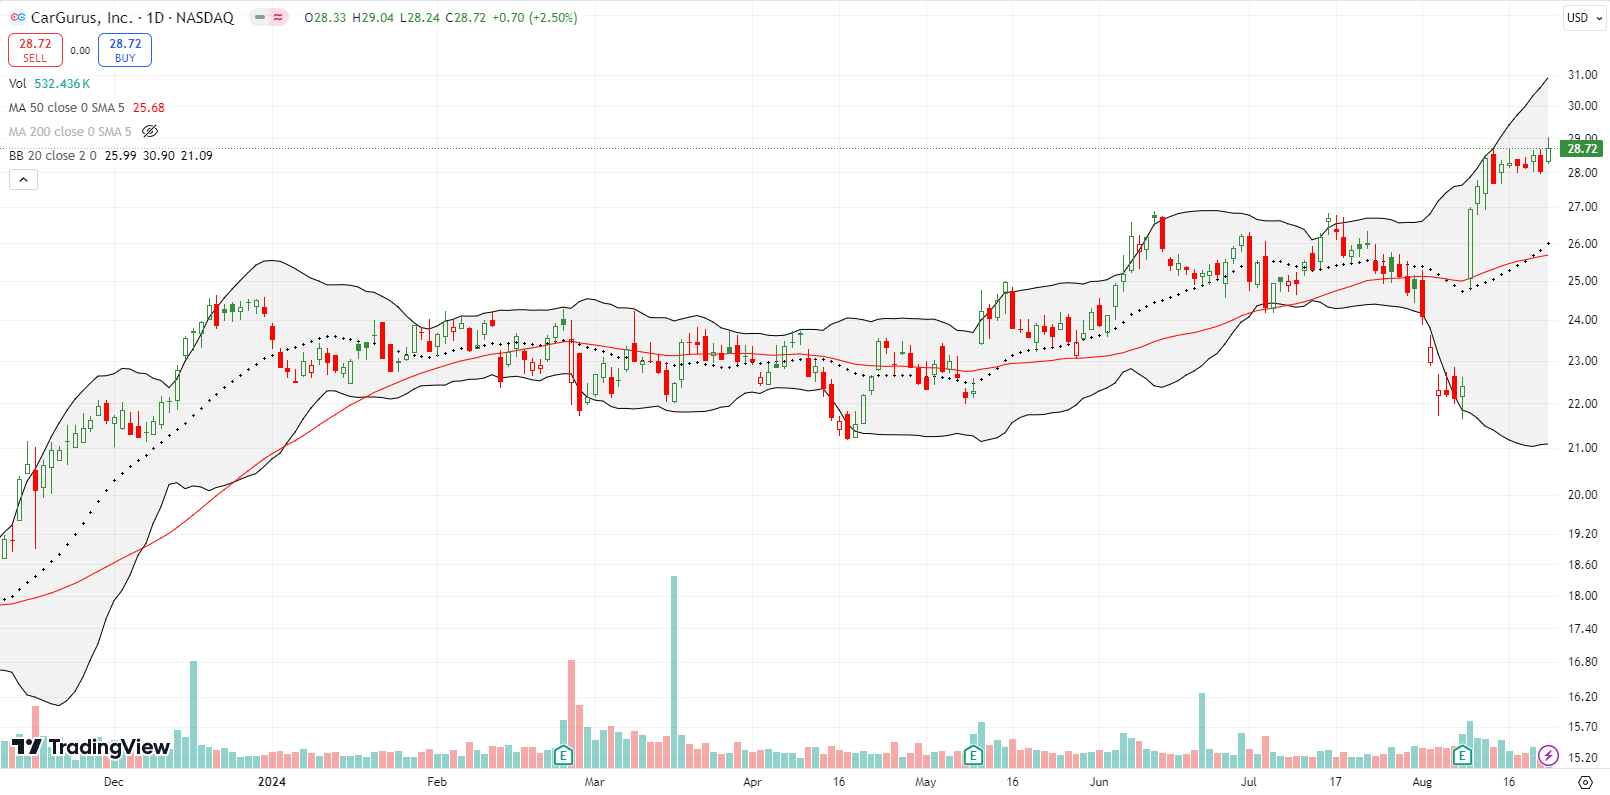
Online car seller CarGurus, Inc (CARG) looks like it will finally hold its breakout above last year’s high. A 20.3% post-earnings gain earlier in the month set a new high for the year. The stock has trickled upward since then. I like buying the stock here with a stop below the brief consolidation range, say as low as $27.
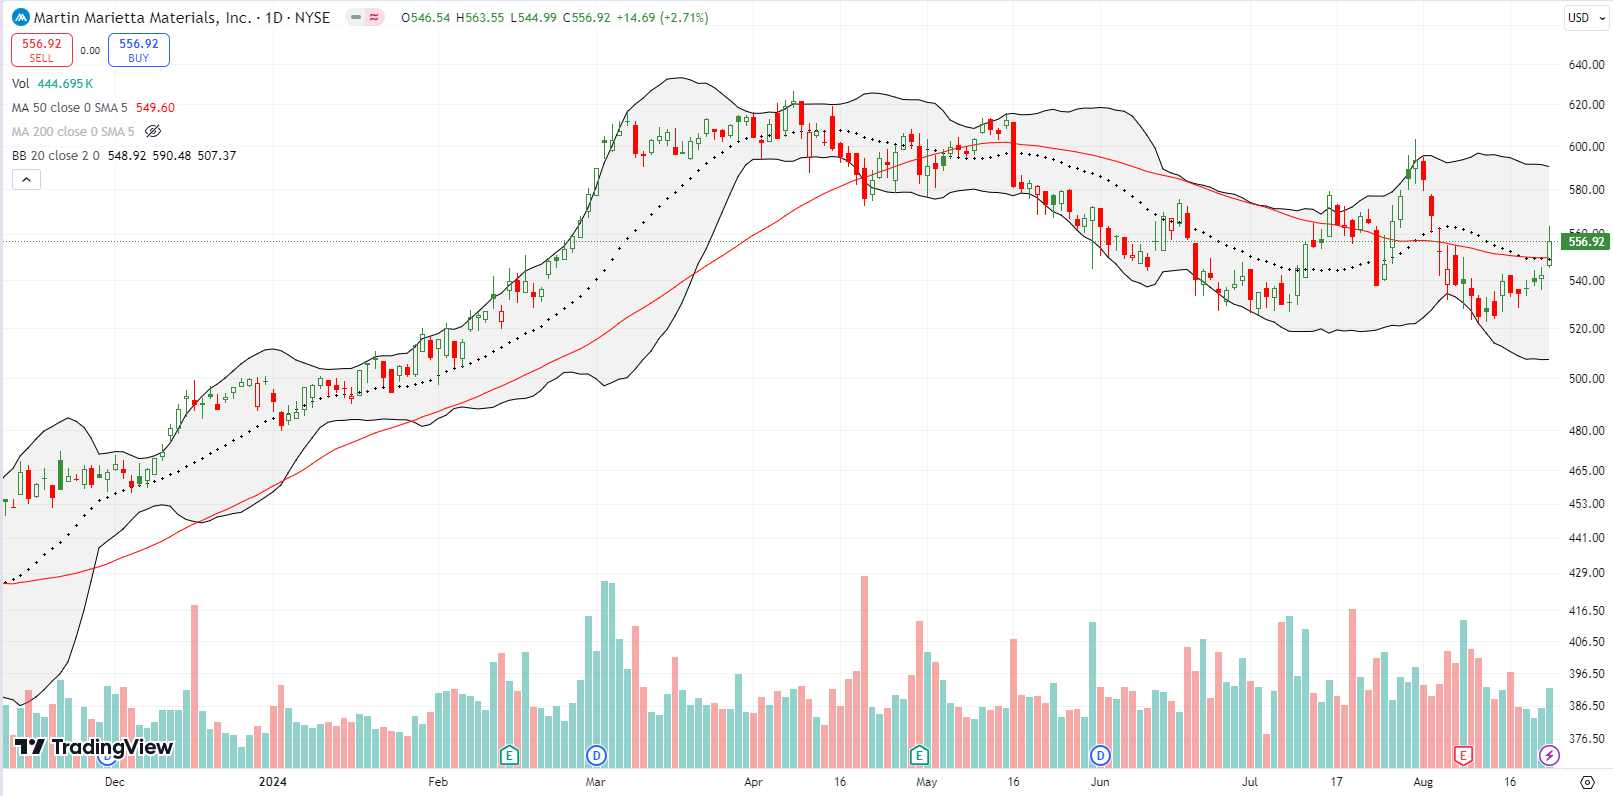
I last mentioned Martin Marietta Materials, Inc (MLM) almost three years ago as a play on “economic growth, inflation, and government spending on infrastructure.” MLM fell from there and languished in the 2022 bear market. MLM finally returned to those levels in June, 2023. In the meantime, I almost completely forgot about the stock. Now, MLM is around 25% higher, and I have no core position. Last week, MLM broke out above its downtrending 50DMA for the fourth time this year. Rather than wait for a higher high, I plan to buy a few shares as a “no regret” position and accumulate aggressively if the market delivers lower prices in the coming months. MLM is clearly a stock that gains traction for a few months at a time.
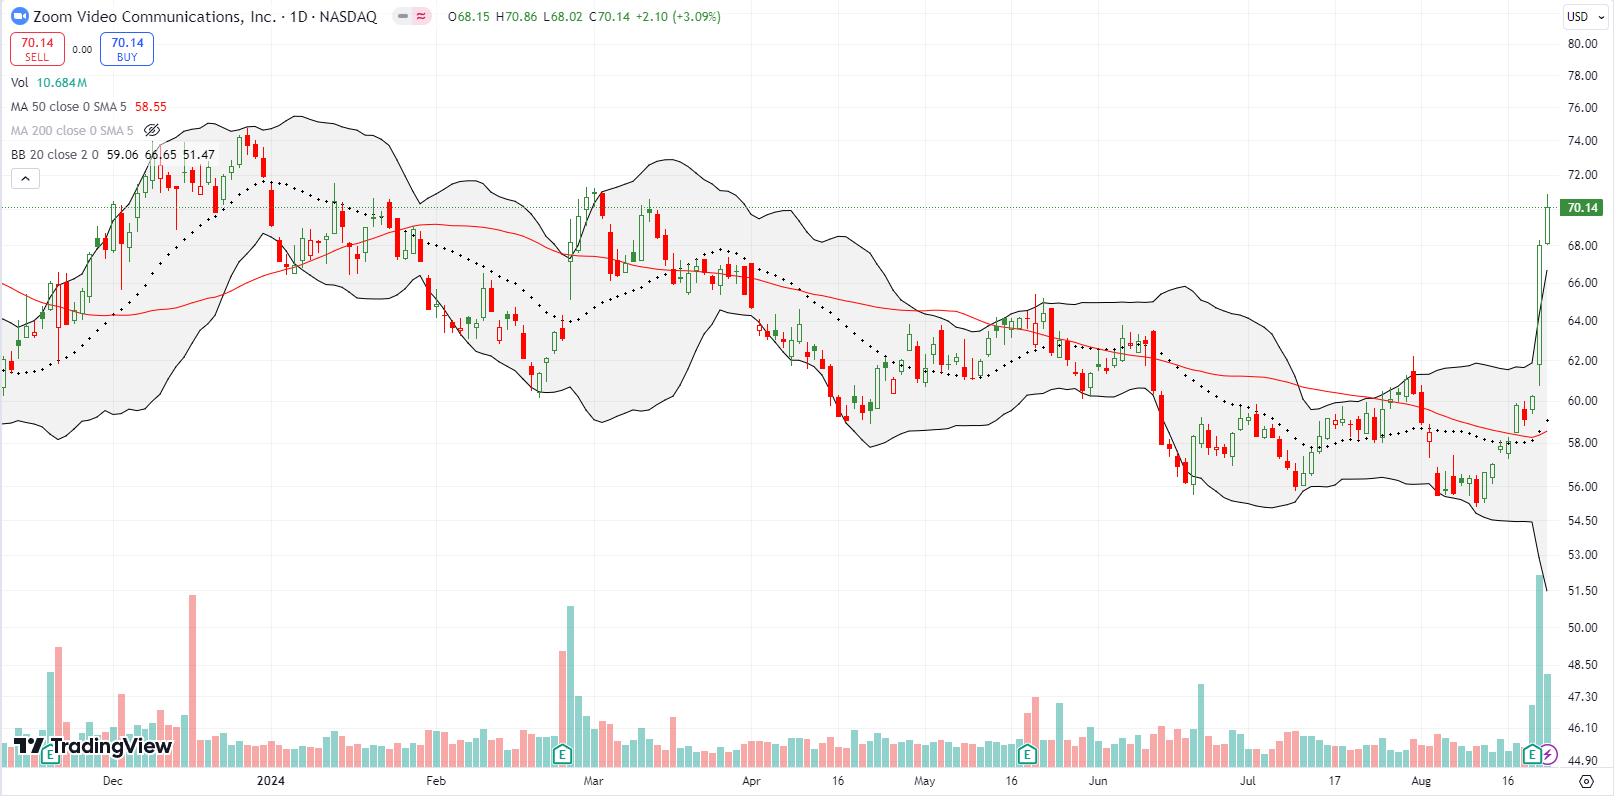
In mid-June, I had all but given up on Zoom Video Communications, Inc (ZM). I gave the video conferencing software company one more chance ahead of earnings. I bought a single call option with a $63 strike. ZM opened the day after earnings with a 3% gain. With implied volatility imploding, I rushed to take the few dollars of profit from the call option. At the same time, I wished I had bought shares instead of a call option given what I earlier assumed was minimal downside risk. At the close of trading for the day, I wished I had held the call option! The dust settled on a 13% gain for the day. Accordingly, I lamented the relatively large windfall that I let slip through my fingers.
Despite ZM’s stretch well above the upper Bollinger Band (BB), buyers pushed ZM up another 3% on Friday. I see sentiment finally turning, so I consider ZM an official buy on the dips. In the meantime, I established a “no regrets” position with a weekly calendar call position with a $70 strike.
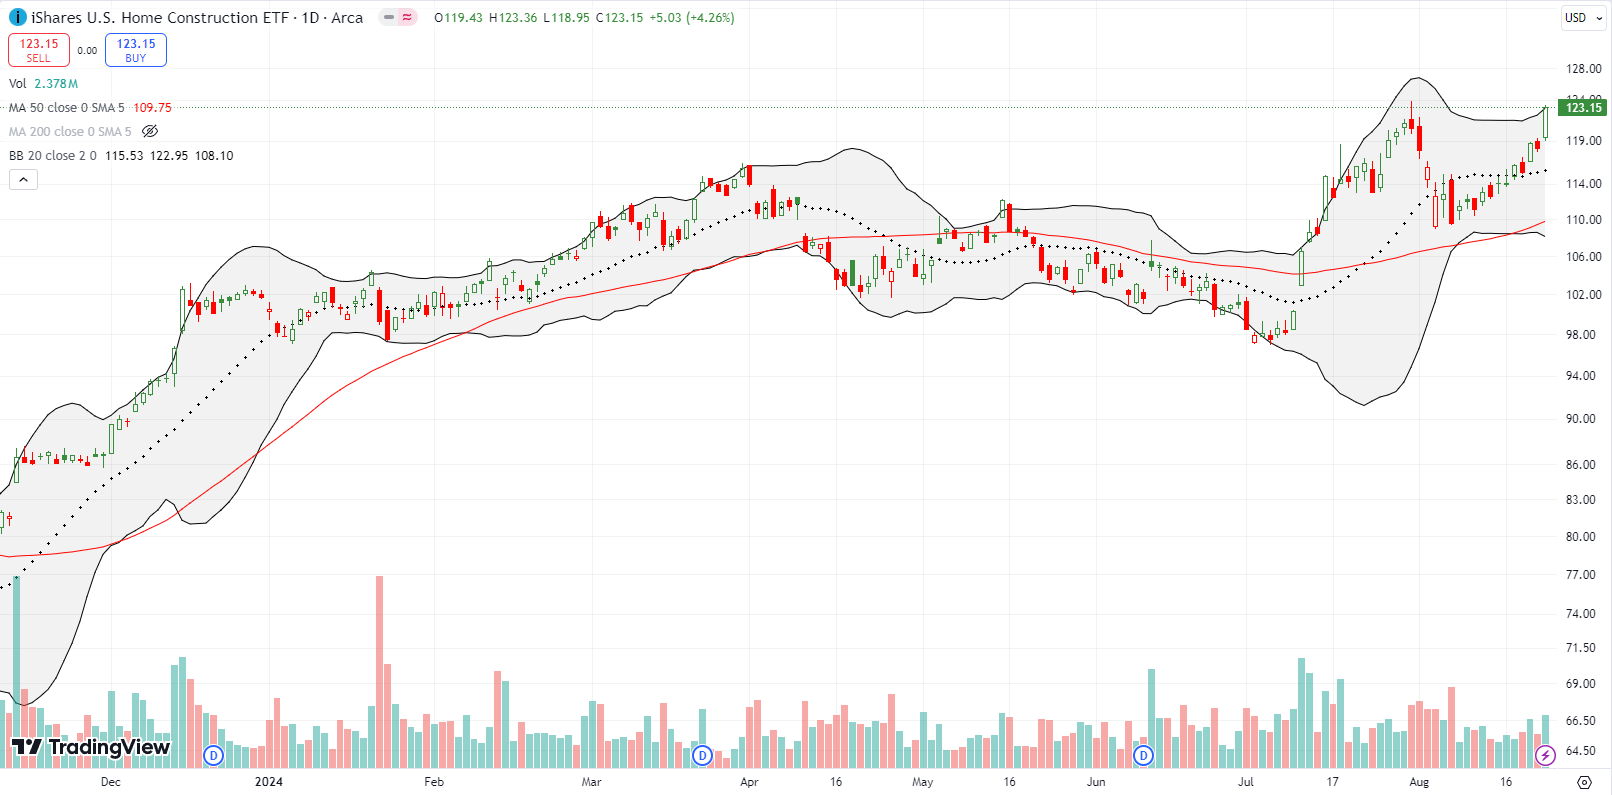
At the start of the week, online real-estate listing company Redfin Corporation (RDFN) soared 17.4% on no news (none that I could find anyway). Suddenly, it occurred to me that traders might rush into rate sensitive stocks going into Powell’s pronouncements at Jackson Hole. The next day, I bought shares in iShares U.S. Home Construction ETF (ITB) and watched the ETF crawl higher (options liquidity was surprisingly too low for me to buy calls without paying a high bid/ask premium). I dutifully took profits the day before Jackson Hole only to watch ITB soar 4.3% to a new all-time high. RDFN surged 18.9% to a 52-week high.
While Friday also brought news of a surge in new single-family home sales to a high for the year, I think the stock prices of home builders are running well ahead of economic reality. Still, the giddy anticipation of rate cuts makes sense for now. ITB is at the top of my shopping list on a September and especially an October pullback.
Be careful out there!
Footnotes
Subscribe for free to get email notifications of future posts!
“Above the 50” (AT50) uses the percentage of stocks trading above their respective 50-day moving averages (DMAs) to measure breadth in the stock market. Breadth defines the distribution of participation in a rally or sell-off. As a result, AT50 identifies extremes in market sentiment that are likely to reverse. Above the 50 is my alternative name for “MMFI” which is a symbol TradingView.com and other chart vendors use for this breadth indicator. Learn more about AT50 on my Market Breadth Resource Page. AT200, or MMTH, measures the percentage of stocks trading above their respective 200DMAs.
Active AT50 (MMFI) periods: Day #189 over 20%, Day #88 over 30%, Day #12 over 40%, Day #7 over 50%, Day #1 over 60% (overperiod ending 1 day under 50%), Day #27 under 70%
Source for charts unless otherwise noted: TradingView.com
Full disclosure: long SPY put spread and puts, long IWM shares, call spread; long MLM, long ITB
FOLLOW Dr. Duru’s commentary on financial markets via StockTwits, Twitter, and even Instagram!
*Charting notes: Stock prices are not adjusted for dividends. Candlestick charts use hollow bodies: open candles indicate a close higher than the open, filled candles indicate an open higher than the close.


