Stock Market Commentary
The S&P 500 (SPY) is up 3.0% since summer trading began the day after the Memorial Day weekend. If not for the poor market breadth, the rally would look like a repeat of last year’s summer of loving stocks (sorry sell in May and go away folks). Semiconductor stocks, particularly NVIDIA Corporation (NVDA), have attracted a large share of investor and trader interest. Last week, semiconductor setbacks helped bolster market breadth by stabilizing presumed money flows. However, it is too early to determine whether the concentrated enthusiasm in the market will finally cool off.
The trading going into Friday featured distortions from a triple witching expiration of stock options, stock index futures, and stock index options contracts as well as an important rebalancing of the SPDR Select Fund – Technology (XLK) that sent money to NVDA and drained Apple (AAPL). This coming week, the dust settles…or the fireworks take off all over again.
The Stock Market Indices
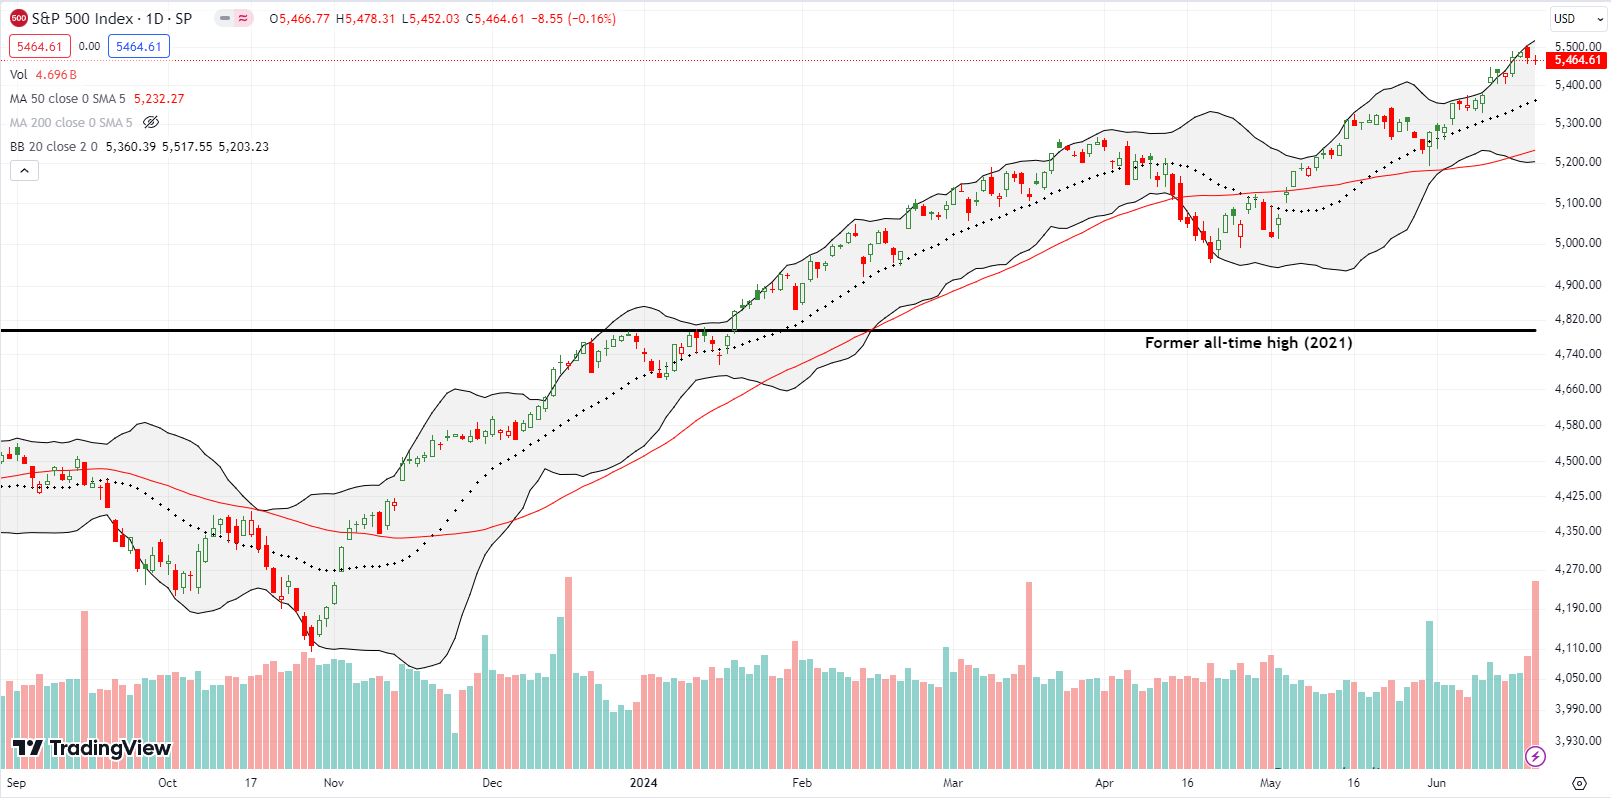
The S&P 500 (SPY) took a hit from the semiconductor setbacks as NVDA lost 3.5% on Thursday and lost another 3.2% on Friday. The impact on the index was much greater on Thursday in a likely sign that some of the money exiting NVDA found its way to other stocks (rotate!). The uptrend in the S&P 500 is very much intact, but I still suspect that the gap up from this month’s Fed day is still begging for a fill. Thus, I executed a fresh buy on a weekly SPY put. A gap fill would create a picture-perfect test of support at the 20-day moving average (DMA) (the dotted line).
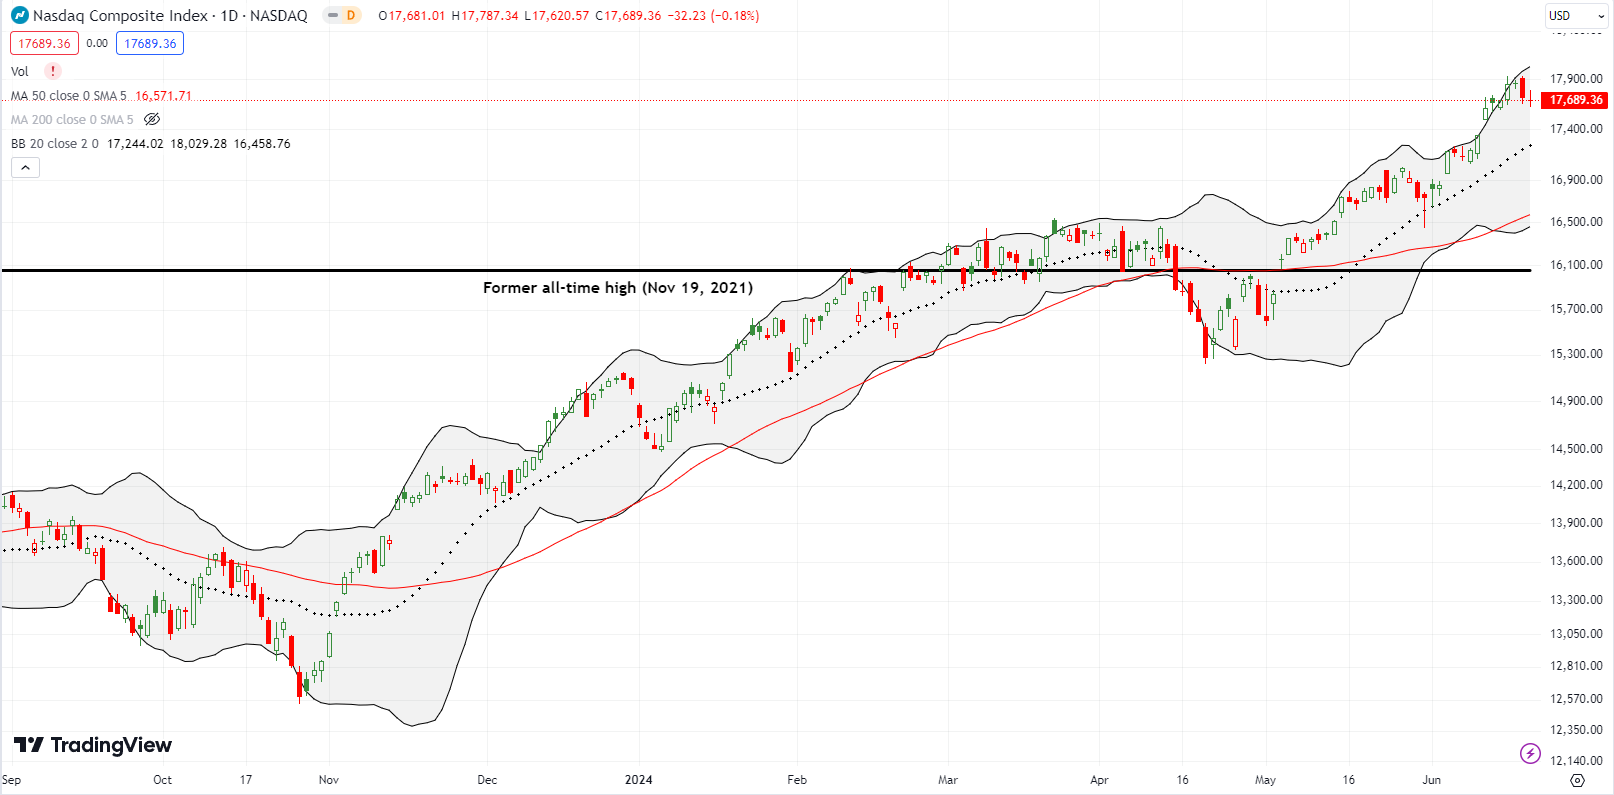
The NASDAQ (COMPQ) was hit similarly to the S&P 500. Also like the S&P 500, a fill of the gap up on Fed day would create a picture-perfect test of 20DMA support. If the NASDAQ begins an early recovery (likely thanks to a resurgent NVDA), I will pile into QQQ calls while leaving the SPY puts as a backstop (hedge).
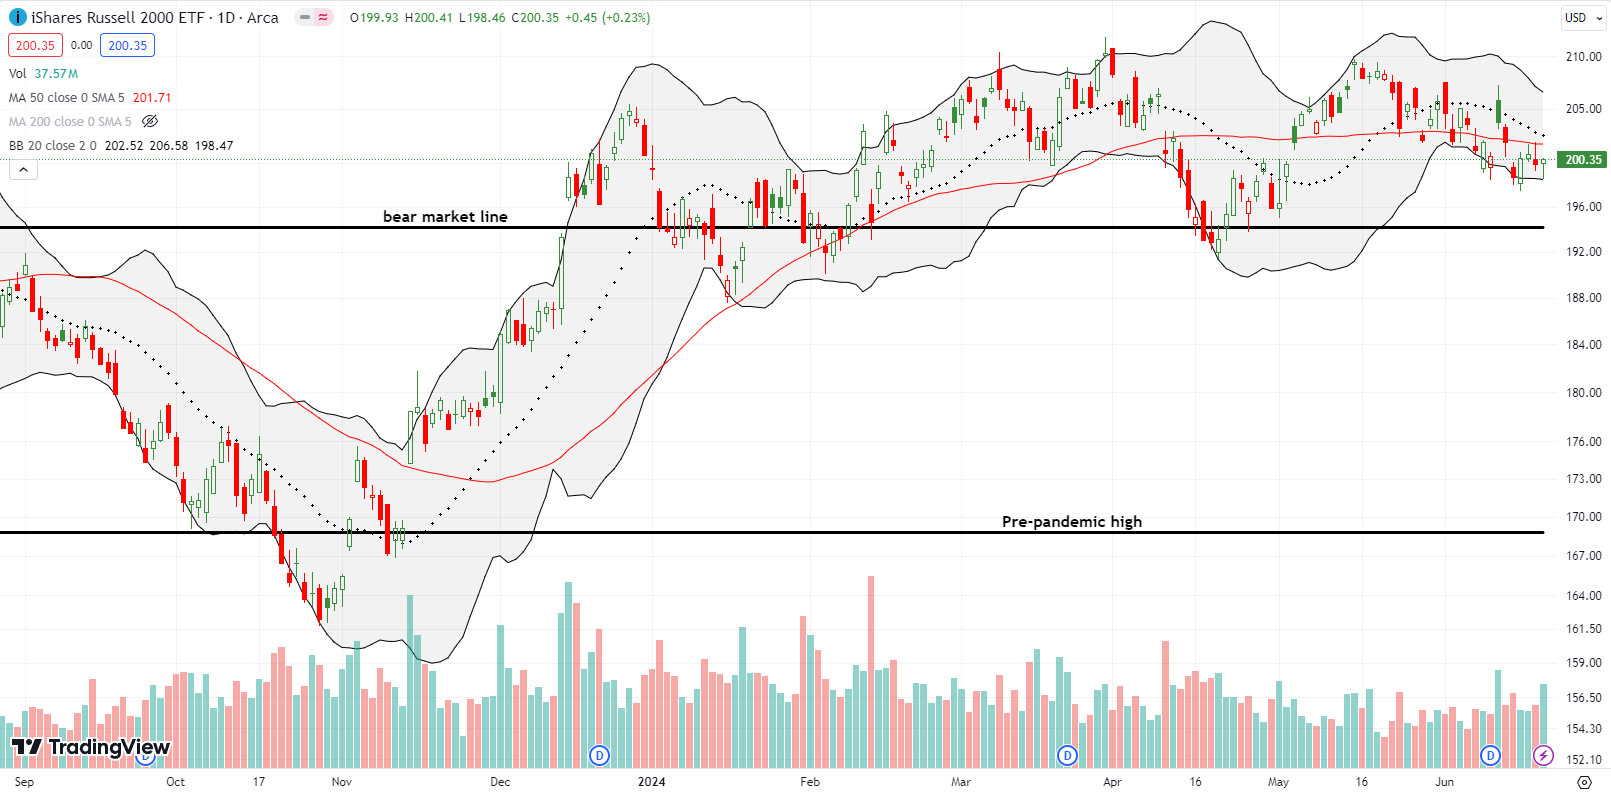
The iShares Russell 2000 ETF (IWM) did well to hold its own while the drama unfolded with semiconductor stocks. The ETF of small caps started the week with a gap down and a sharp rebound where I snatched a small profit from my IWM call options. IWM churned the rest of the week with resistance holding at the 50DMA (the red line). With a downtrending 20DMA converging with 50DMA resistance, IWM faces a significant test that could make or break market breadth in the coming week or so. I did not buy fresh IWM calls given I only do so on some kind of dip.
The Short-Term Trading Call With Semiconductor Setbacks
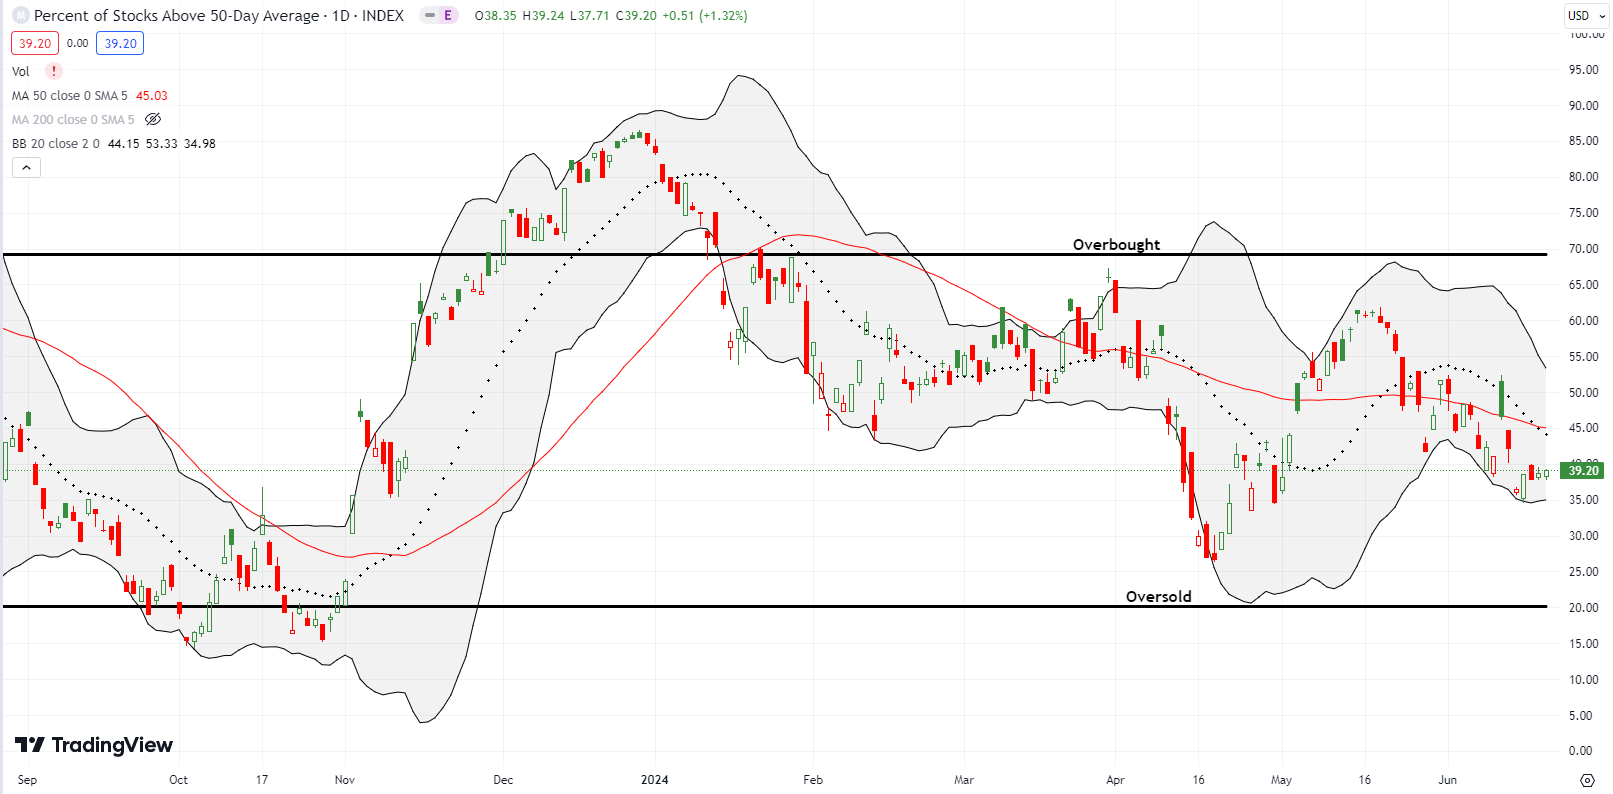
- AT50 (MMFI) = 39.2% of stocks are trading above their respective 50-day moving averages
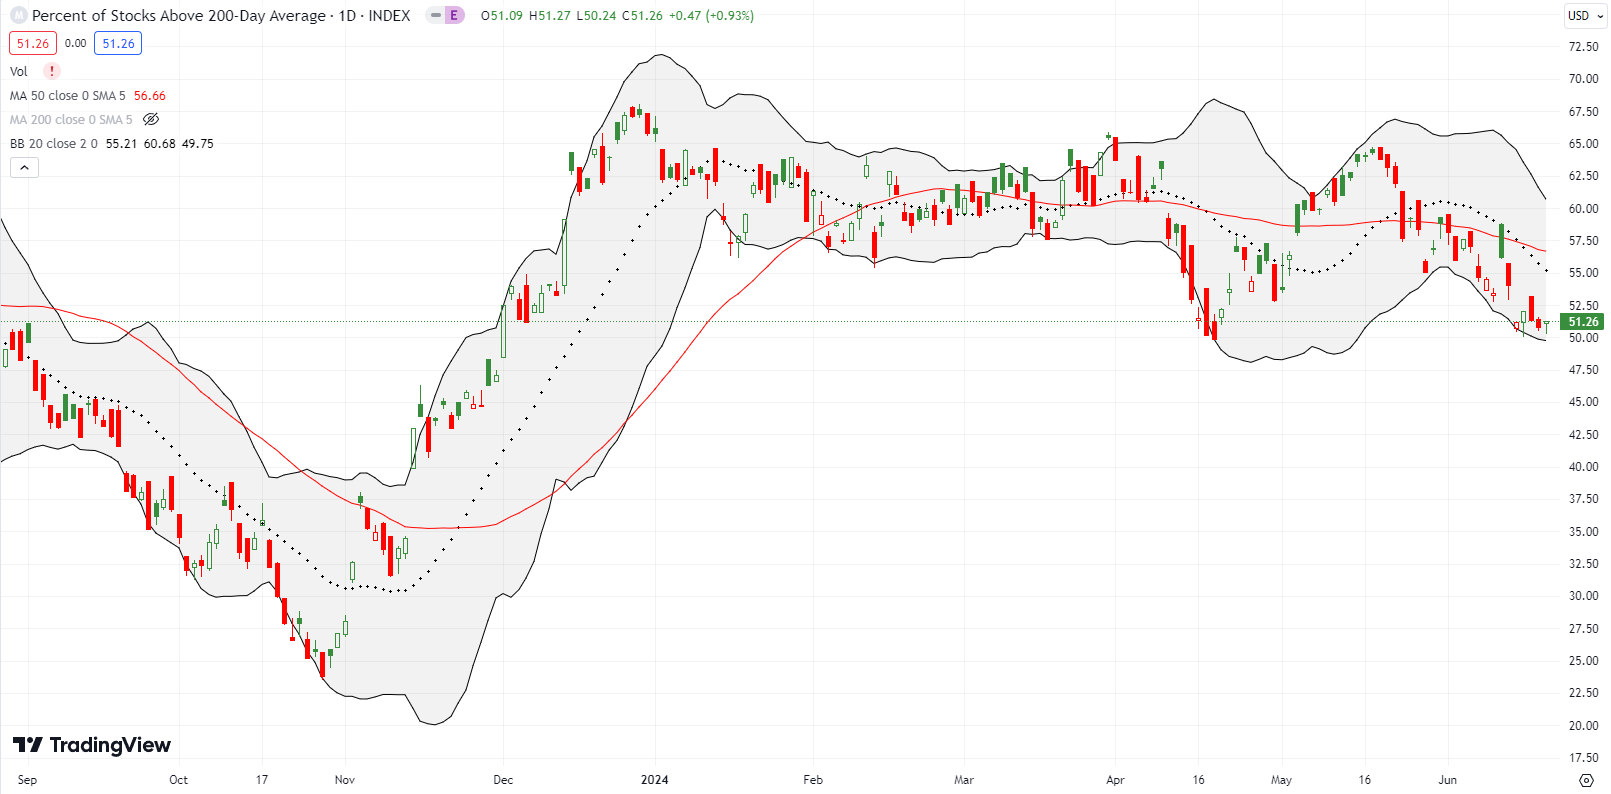
- AT200 (MMTH) = 51.3% of stocks are trading above their respective 200-day moving averages
- Short-term Trading Call: neutral
AT50 (MMFI), the percentage of stocks trading above their respective 50DMAs, started the week jumping off 2-month lows. My favorite technical indicator lost ground the next day as NVDA rebounded from a tiny setback. The midweek Juneteenth holiday and celebration inserted a break in the tug of war. Trading resumed with semiconductor setbacks while AT50 held its ground. This stability brought an uneasy end to the bearish divergence of the week before that was too strong to ignore. Still, market breadth looks poor relative to the lofty heights of the S&P 500 and the NASDAQ. Apparently, a lot of stock market watchers from CNBC to Twitter have taken note and the narratives abound. Thus, with so many noticing the poor market breadth, the contrarian in me says to expect the stock market to continue ignoring market breadth concerns.
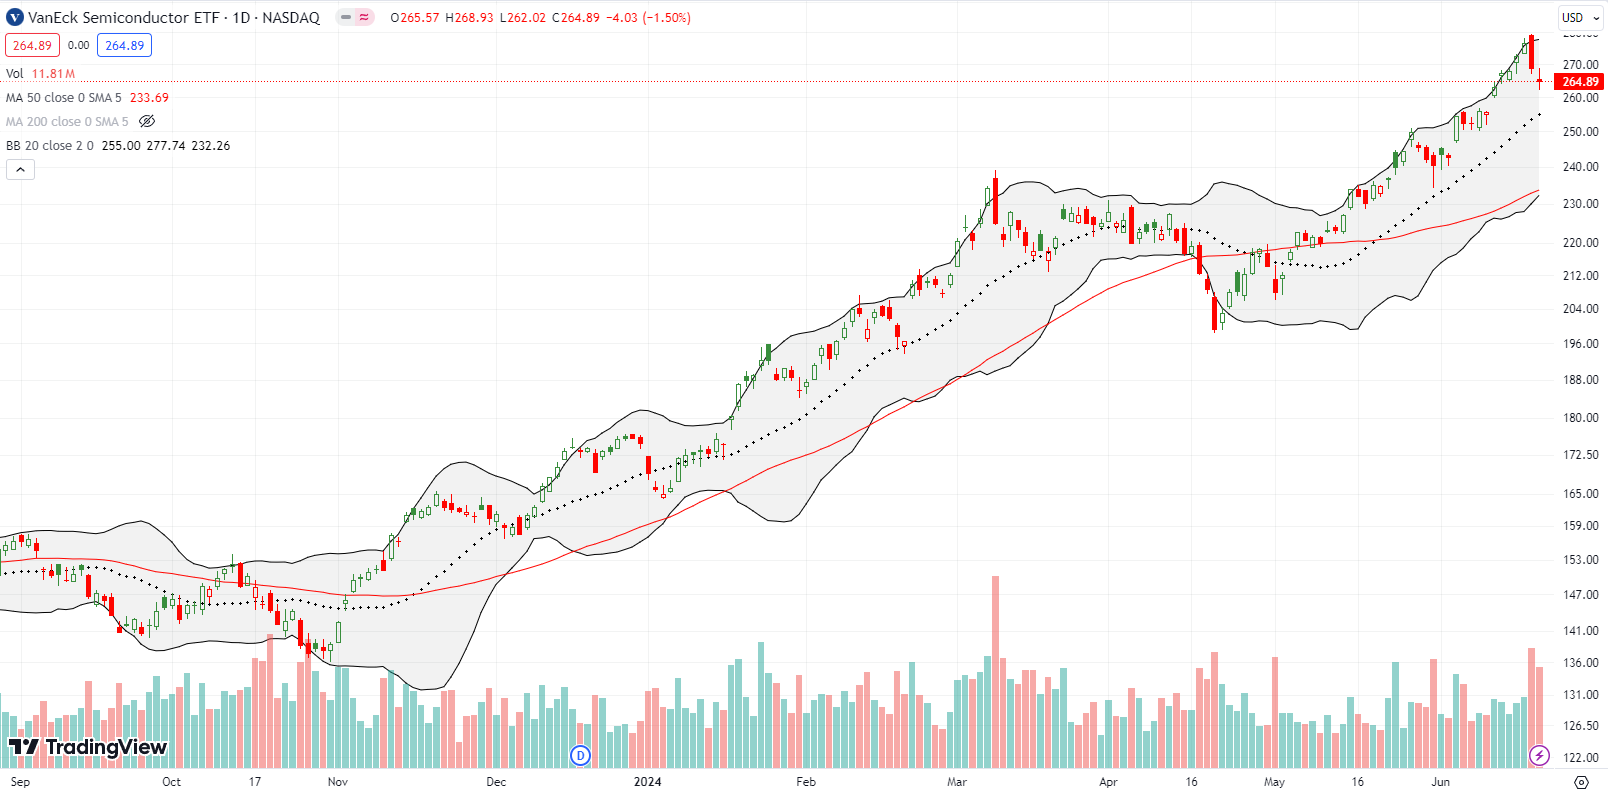
Instead of charting individual stocks to show the semiconductor setbacks, I use the VanEck Semiconductor ETF (SMH) to summarize the trading action. SMH lost 2.8% on Thursday and another 1.5% on Friday. I used the dip to buy new positions in an SMH call spread and an NVDA call spread and longshot weekly $150 call option. I was conflicted on these positions because SMH printed a bearish engulfing top on Thursday. Technically, Friday’s follow-on selling confirmed the top. Needless to say, I write these observations wondering whether I should have been quicker to recognize the opportunity to load up on put options instead of betting on a resumption of the relentless rise.
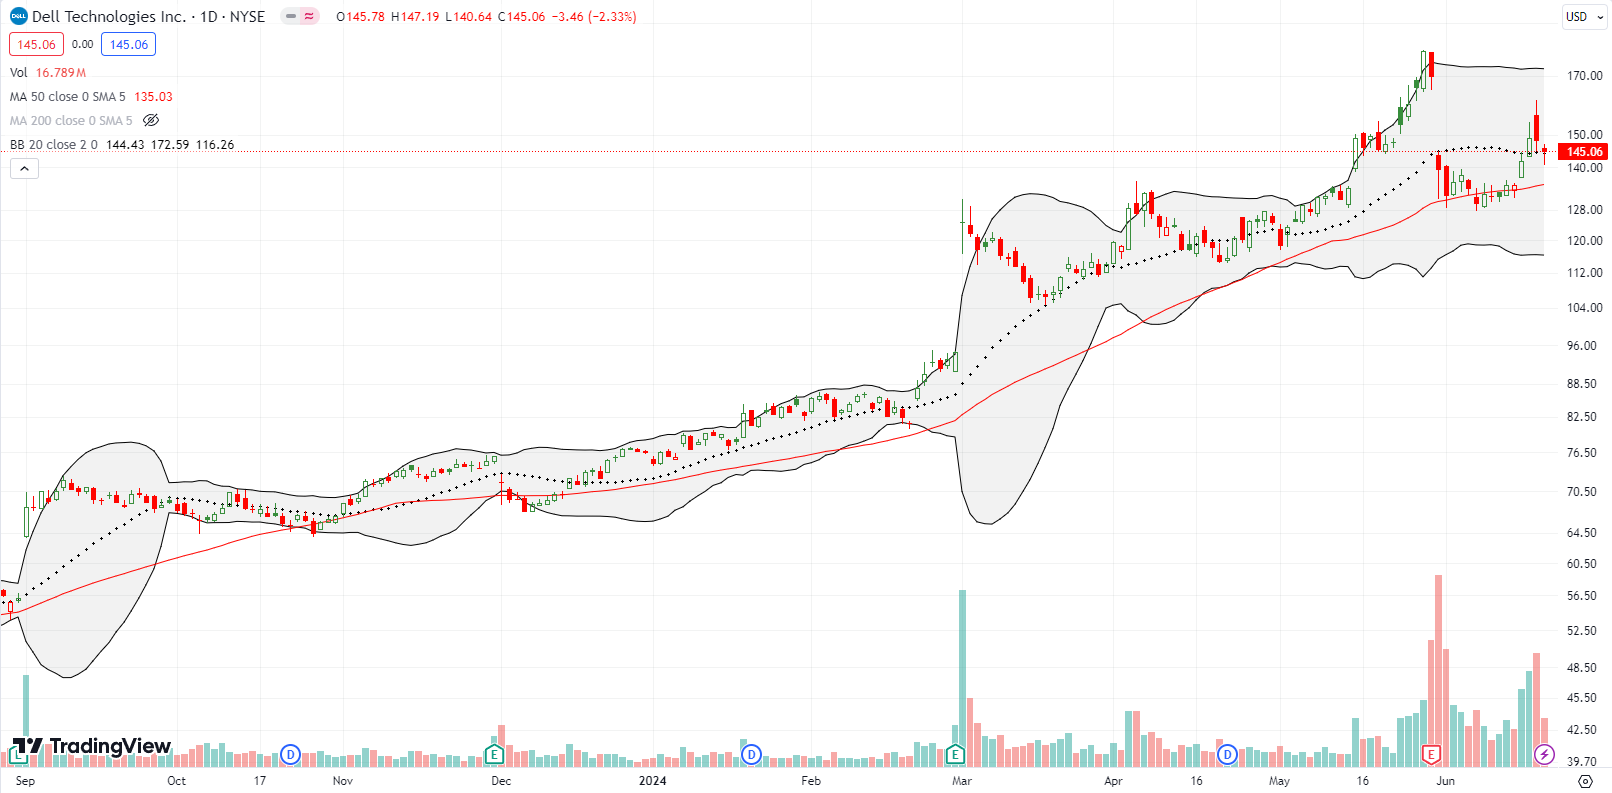
Dell Technologies, Inc (DELL) successfully tested 50DMA support after its massive 17.9% post-earnings gap down. As a part of my aggressive positioning in the (generative) AI trade, I bought shares and a July call spread on that test. When Dell announced its AI Factory with NVDA will support Elon Musk’s Grok, the stock soared and looked ready to finish closing the post-earnings gap down. Sellers migrated from the semiconductor setbacks and faded DELL. The stock ended the day with a 0.4% loss and ended the week sitting right on top of 20DMA support.
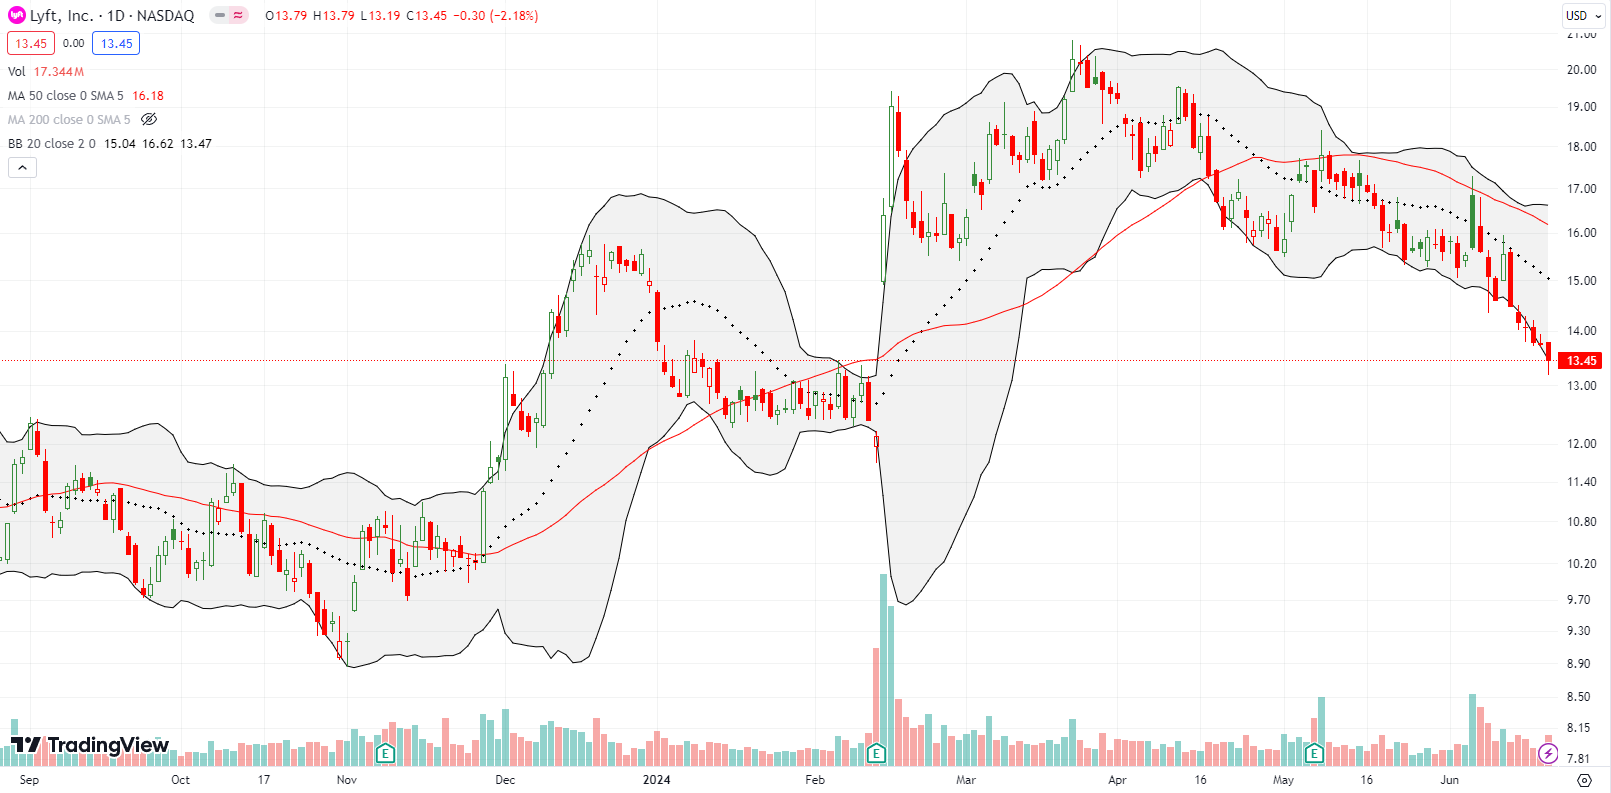
Lyft, Inc (LYFT) looked like it was turning a corner after the post-earnings surge in February and March’s follow-through to a near 2-year high. However, sellers have taken over since then with brief breaks for a 7.1% post-earnings pop in May and and a “gap and crap” for LYFT’s investor day on June 6th. Sellers jumped in right around 50DMA resistance and again at 20DMA resistance. The continued selling from there rings alarm bells for the next earnings event. LYFT finished the week nearly filling in the post-earnings gap up.
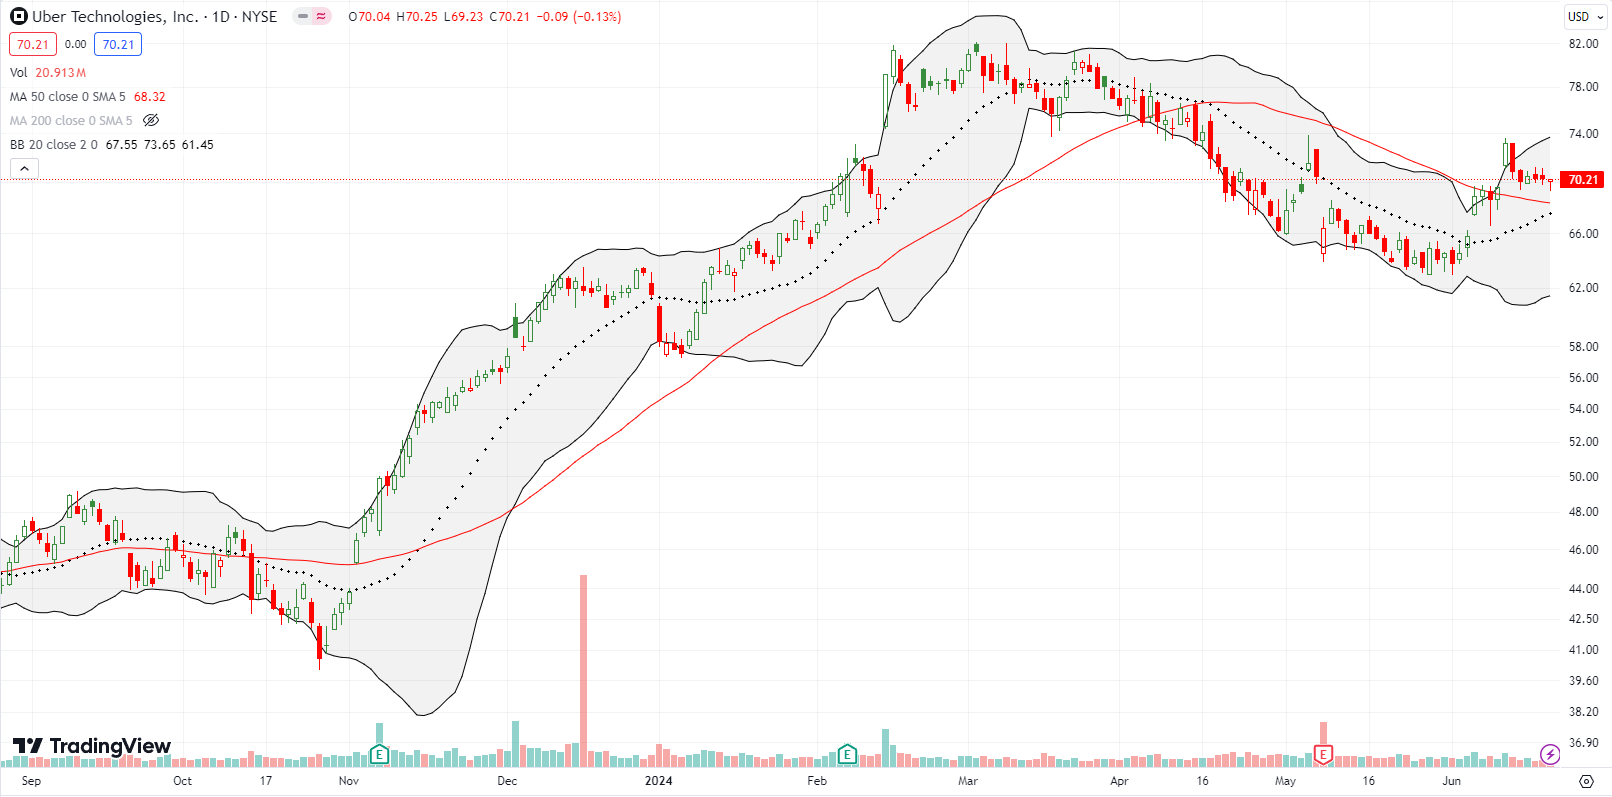
LYFT’s bigger competitor Uber Technologies (UBER) is fighting off the gravity tugging on LYFT. UBER confirmed a 50DMA breakout on June 12th with a 5.1% gain. Yet, the stock has failed to make progress from there. The converging 20DMA and 50DMA look ready to provide support, but I am guessing it will not hold. Accordingly, I bought a July $67.50 put option.
Netflix, Inc (NFLX) has “quietly” rallied while NVDA and other AI plays get all the attention. After a disastrous start to 2022, NFLX bottomed around $164. I wish I could say I was smart enough to hold throughout the subsequent 318% rally. NFLX closed the week right under its all-time high.
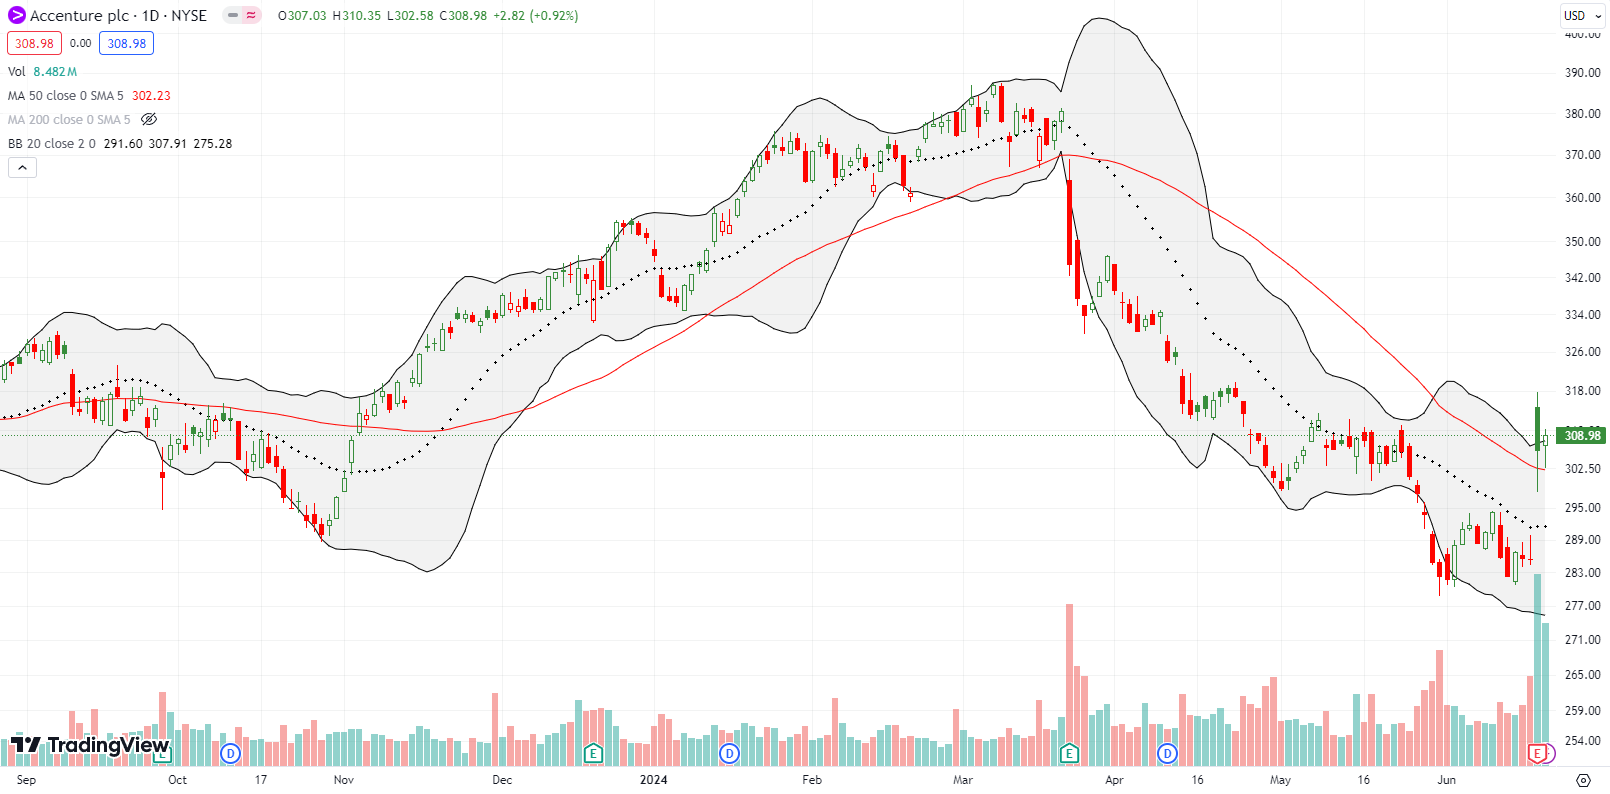
IT consulting company Accenture plc (ACN) surprised me with a 7% post-earnings pop and 50DMA breakout. A small gain the next day confirmed the breakout. I figured all the talk of tightening IT budgets would hit ACN hard. I assumed the sell-off since the last earnings was related to the squeeze on IT budgets. Apparently, ACN said the magic letters “AI” and buyers were off to the races. From the transcript of the earnings call:
“We also have leaned into the new area of growth, GenAI, which is comprised of smaller projects as our clients primarily are in experimentation mode, and this quarter we hit two important milestones. With over $900 million in new GenAI bookings this quarter, we now have $2 billion in GenAI sales year-to-date, and we have also achieved $500 million in revenue year-to-date. This compares to approximately $300 million in sales and roughly $100 million in revenue from GenAI in FY 2023. Leading in GenAI positions us to help our clients take the actions needed to reinvent and to benefit from GenAI, which frequently means large-scale transformations.”
With this kind of generative AI growth, ACN becomes my newest member of the generative AI trade. Welcome!
A week ago I laid out the case for a swing trade in Asana, Inc (ASAN). The stock never regained momentum, and I sold for small profits when ASAN suddenly jumped into 20DMA resistance. Sellers faded the stock hard from there until Friday’s reiteration of guidance and the announcement of a $150M stock buyback. ASAN hit all-time lows before the news, so clearly the company is eager to create stock-saving catalysts here. I will not chase this news and instead wait for the stock to print a new post-earnings closing high before considering getting back in.
A week ago I also made the case for PagerDuty, Inc (PD). PD delivered the expected results with the stock grinding higher to recover its post-earnings momentum. Unfortunately, I got impatient and took profits at 20DMA resistance. Two days later, PD surged above 50DMA resistance. The stock looks freshly bullish with a healthy consolidation just above 50DMA support.
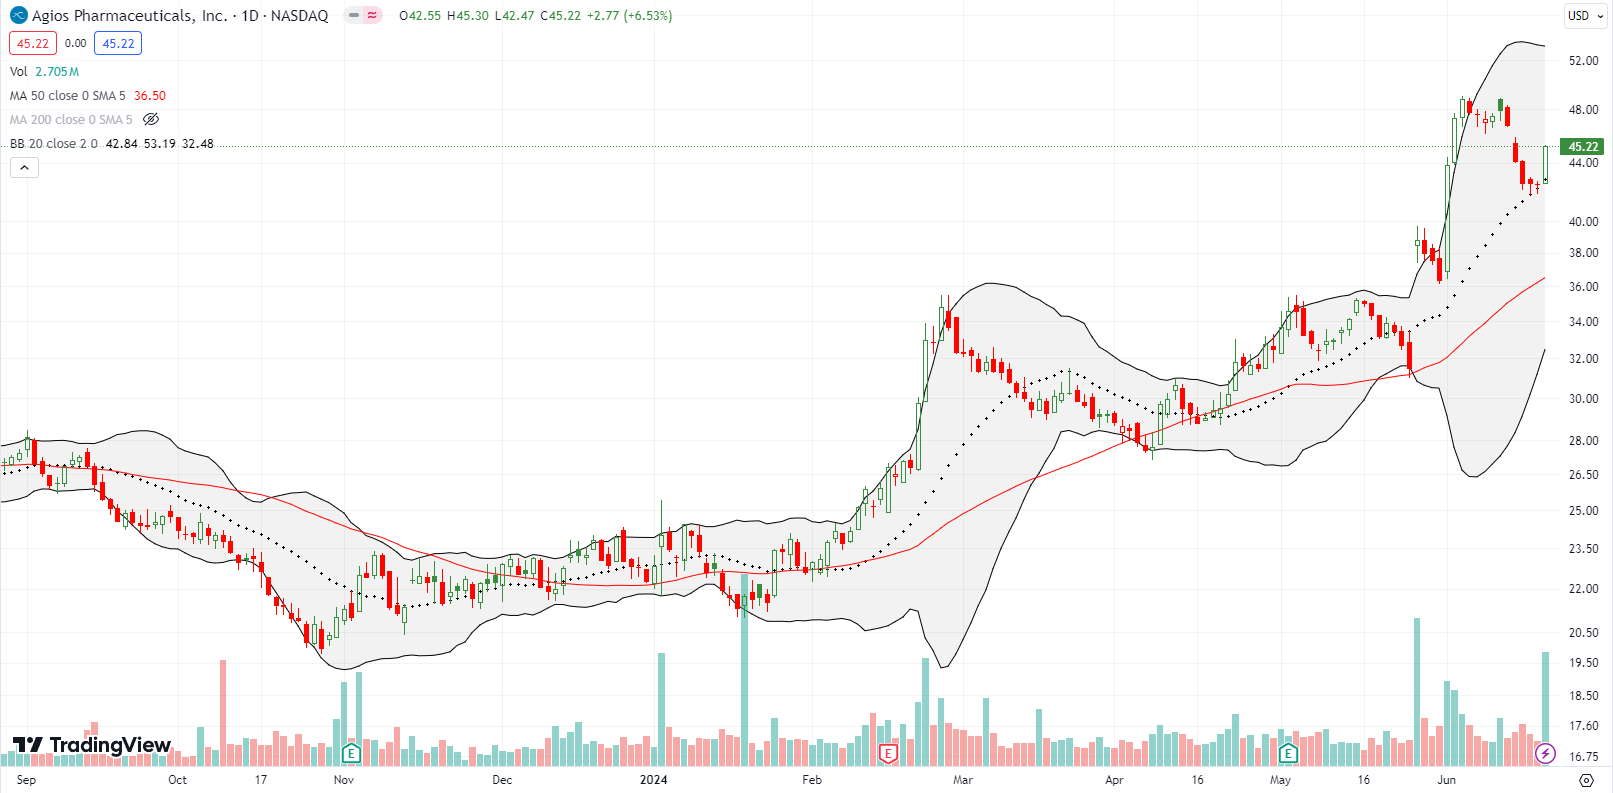
I got interested in Agios Pharmaceutical, Inc (AGIO) a while ago for its promising work in sickle cell disease and thalassemia. The stock went almost nowhere for two years. This year has been a much different story. The first change happened with the bullish response to February earnings. AGIO proceeded to survive two challenges at its 50DMA support. A surprise $905M sale of its 15% rights to Servier’s vorasidenib launched the stock 23.2% off 50DMA support. On June 3, the stock gained another 20.3% on positive results for a thalassemia drug trial. I added to my holding as the stock jumped off 20DMA support. AGIO last traded this high in late 2021. It is exactly the kind of stock I like as a distraction from semiconductor setbacks and mania.
Be careful out there!
Footnotes
Subscribe for free to get email notifications of future posts!
“Above the 50” (AT50) uses the percentage of stocks trading above their respective 50-day moving averages (DMAs) to measure breadth in the stock market. Breadth defines the distribution of participation in a rally or sell-off. As a result, AT50 identifies extremes in market sentiment that are likely to reverse. Above the 50 is my alternative name for “MMFI” which is a symbol TradingView.com and other chart vendors use for this breadth indicator. Learn more about AT50 on my Market Breadth Resource Page. AT200, or MMTH, measures the percentage of stocks trading above their respective 200DMAs.
Active AT50 (MMFI) periods: Day #145 over 20%, Day #44 over 30% (overperiod), Day #5 under 40% (underperiod), Day #14 under 50%, Day #23 under 60%, Day #112 under 70%
Source for charts unless otherwise noted: TradingView.com
Full disclosure: long SPY puts and put spread, long AAPL calls, long NVDA call spread and call, long DELL call spread and shares, long UBER put, long AGIO
FOLLOW Dr. Duru’s commentary on financial markets via StockTwits, Twitter, and even Instagram!
*Charting notes: Stock prices are not adjusted for dividends. Candlestick charts use hollow bodies: open candles indicate a close higher than the open, filled candles indicate an open higher than the close.

