
Stock Market Commentary
I looked to last week’s earnings from NVIDIA Corporation (NVDA) with great anticipation. The indices gathered momentum with all-time highs and seemed to point to a big moment for NVDA. NVDA did indeed have a big moment, but it helped precious few. In fact, NVDA’s gain looked like a net loss. Buyer’s exhaustion appeared in the form of pullbacks in all three indices that I watch closely. Market breadth also fell sharply and exposed the weakness that comes with narrowing participation in a rally. NVDA apparently sucked the oxygen out the room as it soared to new heights. The entire scene was surreal.
So did NVDA’s surge to all-time highs trigger stock market exhaustion? Yes and no. Thursday’s trading action definitely said “yes”. A big tech rebound on Friday supplied a fresh supply of fuel for the NASDAQ. However, since I use market breadth as a primary indicator of market health, I think the month is ending with overall market exhaustion. An on-going rally in big-cap tech could hide the weakness for a few more weeks…
The Stock Market Indices
The S&P 500 (SPY) experienced a rare week. The index essentially came to a dead stop. The flat week (+.03%) stood in stark contrast to the big surge for NVDA. In fact, exhaustion seemed to set in for the S&P 500 as it LOST 0.7% while NVDA surged 9.3%. The divergence felt and looked surreal. The small rebound on Friday made a slight dent in the bearish engulfing pattern formed by Thursday’s anti-NVDA move. My SPY call for the week dissolved, and my call spread for next week will likely suffer a similar fate. Those components of my anticipation of good tidings from NVDA fell apart.
")
The NASDAQ (COMPQ) experienced an even more dramatic divergence from NVDA. The tech laden index gapped up for a 1.2% gain only to lose 0.4% on the day. The move almost looked like a classic blow-off top, especially given NVDA’s relatively strong close. However, the NASDAQ managed to rebound on Friday with a healthy 1.1% gain and a new all-time closing high. With a 1.4% gain for the week, the NASDAQ looks poised to continue rallying. If you look closely at the chart below, you can see a subtle uptrend still intact. I am looking to get back into QQQ call options in the coming week to ride this slight upward before exhaustion descends upon tech as well. {May 28 correction: I actually already owned a weekly calendar call spread, so I am not looking to get into a new/additional position just yet}
")
The iShares Russell 2000 ETF (IWM) frequently looks like it is suffering from exhaustion. IWM greeted the NVDA news with a sharp loss of 1.6% that even tested support at the 50-day moving average (DMA) (the read line below). Buyers returned on Friday to defend support with a 1.1% gain. IWM even closed above its uptrending 20DMA (the dashed line below). Still, IWM failed at resistance from its high of the year and looks rangebound until proven otherwise. I go into the coming week with longshot IWM call options at the $209 strike.
")
The Short-Term Trading Call With An NVIDIA Post-Earnings Exhaustion
- AT50 (MMFI) = 51.3% of stocks are trading above their respective 50-day moving averages
- AT200 (MMTH) = 59.2% of stocks are trading above their respective 200-day moving averages
- Short-term Trading Call: cautiously bullish
AT50 (MMFI), the percentage of stocks trading above their respective 50DMAs, closed the week at 51.3%. My favorite technical indicator suffered a dramatic pullback in the wake of NVDA’s big day. AT50 fell 8 percentage points and closed below 50% on Thursday in a clear sign of exhaustion for market breadth. The small rebound on Friday did nothing to change the tenor of the exhaustion. Moreover, AT200 (MMTH), the percentage of stocks trading above their respective 200DMAs, suffered an important setback. This indicator of the longer-term health of market breadth tested and failed resistance from the highs of the year. It closed the week right in the middle of the overall trading range that has dominated trading in 2024.
On balance, the exhaustion in market breadth should prepare me to get bearish. Yet, AT50 did not get close enough to the overbought threshold for me to get bearish on the fade. I am left with keeping my short-term trading call at cautiously bullish by default. The NASDAQ’s strong rebound on Friday helps stave off the bearish case for now. Still, I am VERY wary….especially with the volatility index, the VIX, fighting to hold the recent lows as a bottom.
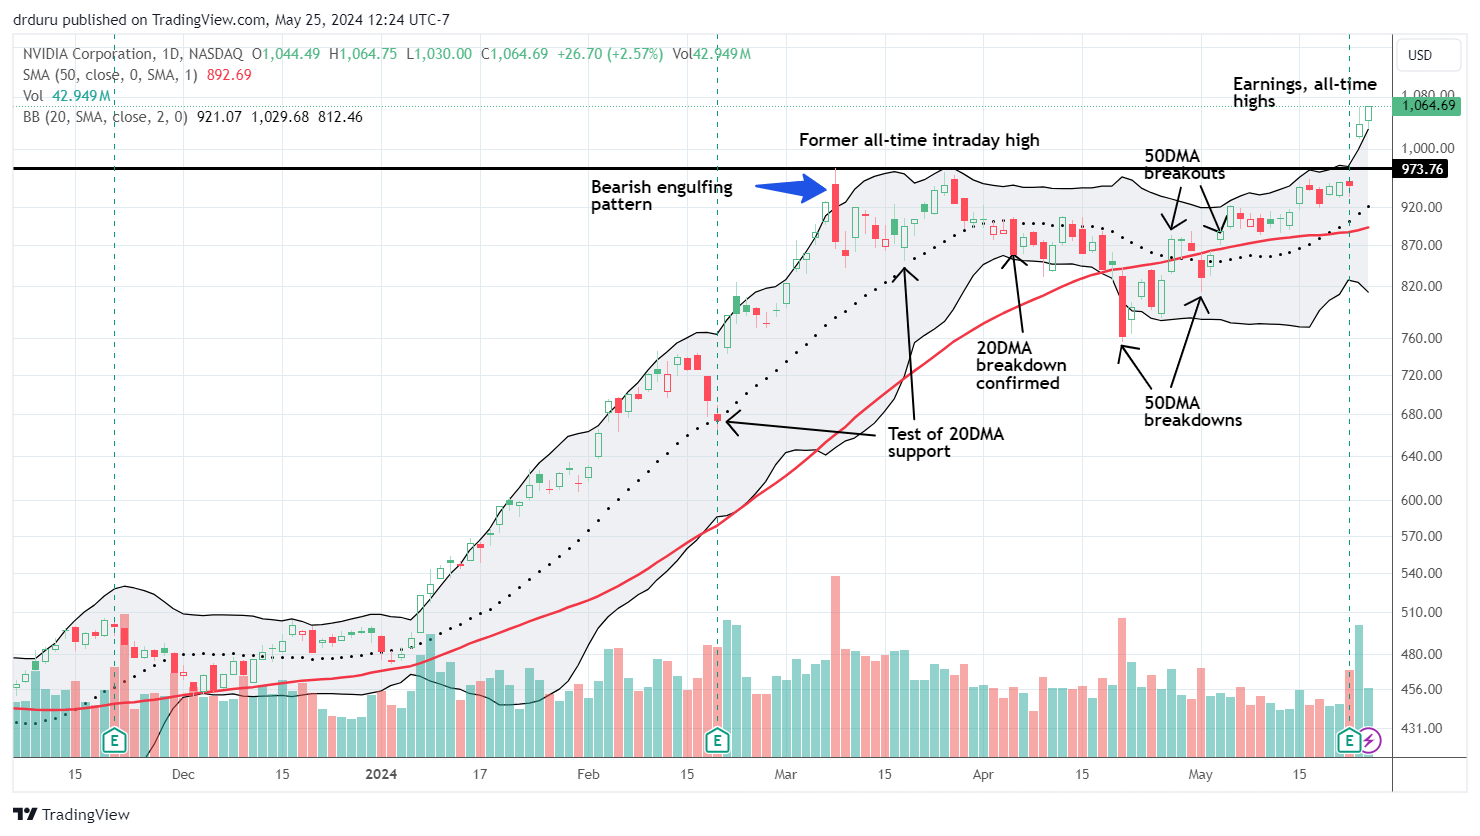
NVIDIA Corporation (NVDA) was the star of the week that I expected. However, the star failed to shine across the stock market. NVDA’s gains almost seemed to drain money away from other stocks. If not for the NASDAQ’s rebound on Friday, I would have concluded the market suffered a major and topping bout of exhaustion. While I benefited from a low risk options pre-earnings options setup on NVDA along with an SMH call spread, I could barely enjoy the wins because of hits elsewhere.
Anyway, the chart below shows the technical clinic that is NVDA. The post-earnings breakout is definitive, bullish, and brought a 2-month topping pattern to conclusive end. (Technicians will see the bullish flag left behind by the breakout). The company solidified this breakout by announcing a 10:1 stock split that helps to prop up sentiment even though it means nothing except making it easier for retail traders to speculate in NVDA options.
No exhaustion for e.l.f. Beauty, Inc (ELF). The stock surged 18.7% post-earnings the same day NVDA enjoyed a buyers’ celebration. The buying continued on Friday and confirmed the 50DMA breakout. ELF is bullish again.
")
The Cheesecake Factory Incorporated (CAKE) broke down into exhaustion after a sharp 5-day post-earnings ascension. I bought into the pullback a little early. I am now looking into adding call options based on what looks like a successful test of uptrending 20DMA support.
")
The Cramer bottom for Starbucks (SBUX) worked out much faster than I could have expected. I rode the rebound until Thursday’s pullback. The stock still looks good with the 20DMA breakout, but I decided not to press my luck or get greedy. Ultimately, SBUX has to face down a tough test with its declining 50DMA resistance.
")
McDonalds Corporation (MCD) has suffered from exhaustion since its last high in January. On Thursday, MCD lost 3.0% and closed at a new low for the year. The fast food restaurant is scrambling to win back lower income consumers who are apparently increasingly rejecting inflation at restaurants. However, MCD’s solution, a reported $5 value meal, will only last a month. Moreover, competitors like Wendy’s are stepping up to the challenge of a price war. These kind of market dynamics point toward lower and lower margins…and stock prices.
")
Target Corporation (TGT) is also struggling with inflation-weary consumers. Ahead of earnings, the company announced price cuts on 5000 items, mostly in grocery and staples. The news actually presaged a poorly received earnings report. TGT gapped down and lost 8% after reporting earnings. Given margin pressures, I doubt the current rebound will last much longer. Gains from March earnings are now gone. I will not be surprised to see TGT lose much of its gains from November earnings.
")
Walmart, Inc (WMT) contrasts with TGT. WMT surged 7% post-earnings to an all-time high and has continued to rally ever since. WMT is perhaps best positioned to navigate inflationary cost inputs. If its big win against Target presages anything, I foresee WMT eating yet more business from smaller retailers who cannot afford to absorb inflationary pressures like Walmart can.
")
So far, so good with my rebound play on Sprout Social, Inc (SPT). Per the trading strategy explained in “Anatomy of A Bottom: Do Not Argue With Sellers – Celebrate With Buyers“, I jumped into the stock after the first day of buying strength. The stock now faces a critical test at sharply downtrending 20DMA resistance. I am looking for an all-clear from a close above the intraday post-earnings high set on the day the stock gapped down for a 40% post-earnings loss. (I do not know why SPT suddenly surged one day the previous week).
")
iRobot Corporation (IRBT) suffered mightily after Amazon.com’s (AMZN) proposed acquisition of the company failed anti-trust scrutiny. I guess the Department of Justice prefers to see the company to go bankrupt. Or maybe IRBT might just figure things out. The stock confirmed a 50DMA breakout on a 21.0% post-earnings surge. The company also announced a new CEO, news which gave the stock a turbo boost of fresh optimism. IRBT is now cooling off and staring down a test of the 50DMA as support. I am a buyer on a successful test.
")
")
")
Be careful out there!
Footnotes
Subscribe for free to get email notifications of future posts!
“Above the 50” (AT50) uses the percentage of stocks trading above their respective 50-day moving averages (DMAs) to measure breadth in the stock market. Breadth defines the distribution of participation in a rally or sell-off. As a result, AT50 identifies extremes in market sentiment that are likely to reverse. Above the 50 is my alternative name for “MMFI” which is a symbol TradingView.com and other chart vendors use for this breadth indicator. Learn more about AT50 on my Market Breadth Resource Page. AT200, or MMTH, measures the percentage of stocks trading above their respective 200DMAs.
Active AT50 (MMFI) periods: Day #122 over 20%, Day #21 over 30%, Day #12 over 40%, Day #10 over 50%, Day #3 over 60% (overperiod), Day #89 under 70% (underperiod)
Source for charts unless otherwise noted: TradingView.com
Full disclosure: long IWM calls, long SPY call spread, long SPT, long CAKE calls, long QQQ calendar call spread
FOLLOW Dr. Duru’s commentary on financial markets via StockTwits, Twitter, and even Instagram!
*Charting notes: Stock prices are not adjusted for dividends. Candlestick charts use hollow bodies: open candles indicate a close higher than the open, filled candles indicate an open higher than the close.