Stock Market Commentary
Right after the stock market tempted me to flip from bearish to neutral, January’s CPI (consumer price index) turned brought the bears rushing back to the scene. Inflation’s fizzle turned to sizzle, and the technical picture of the stock market almost flipped on its head. The charts say it all – the post-CPI wake created a “be ready” kind of day in the stock market.
The Stock Market Indices
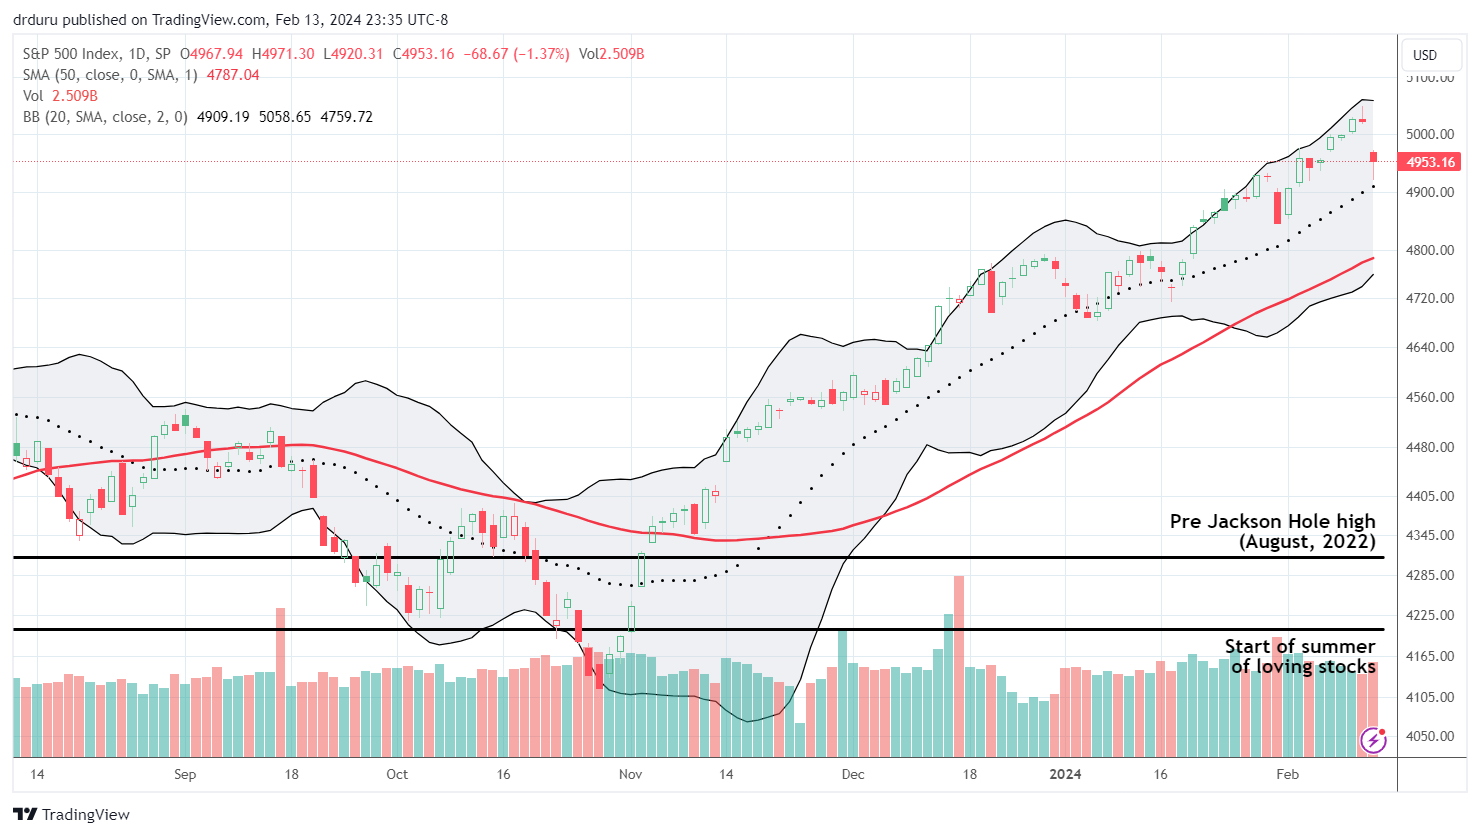
The S&P 500 (SPY) from afar looks just fine. The uptrend in place since the November 50DMA breakout remains intact. Yet, the day’s 1.4% loss on a gap down felt jarring. The jolt took the edge of some growing complacency. The index survived the day by bouncing almost perfectly off support at its 20-day moving average (DMA).
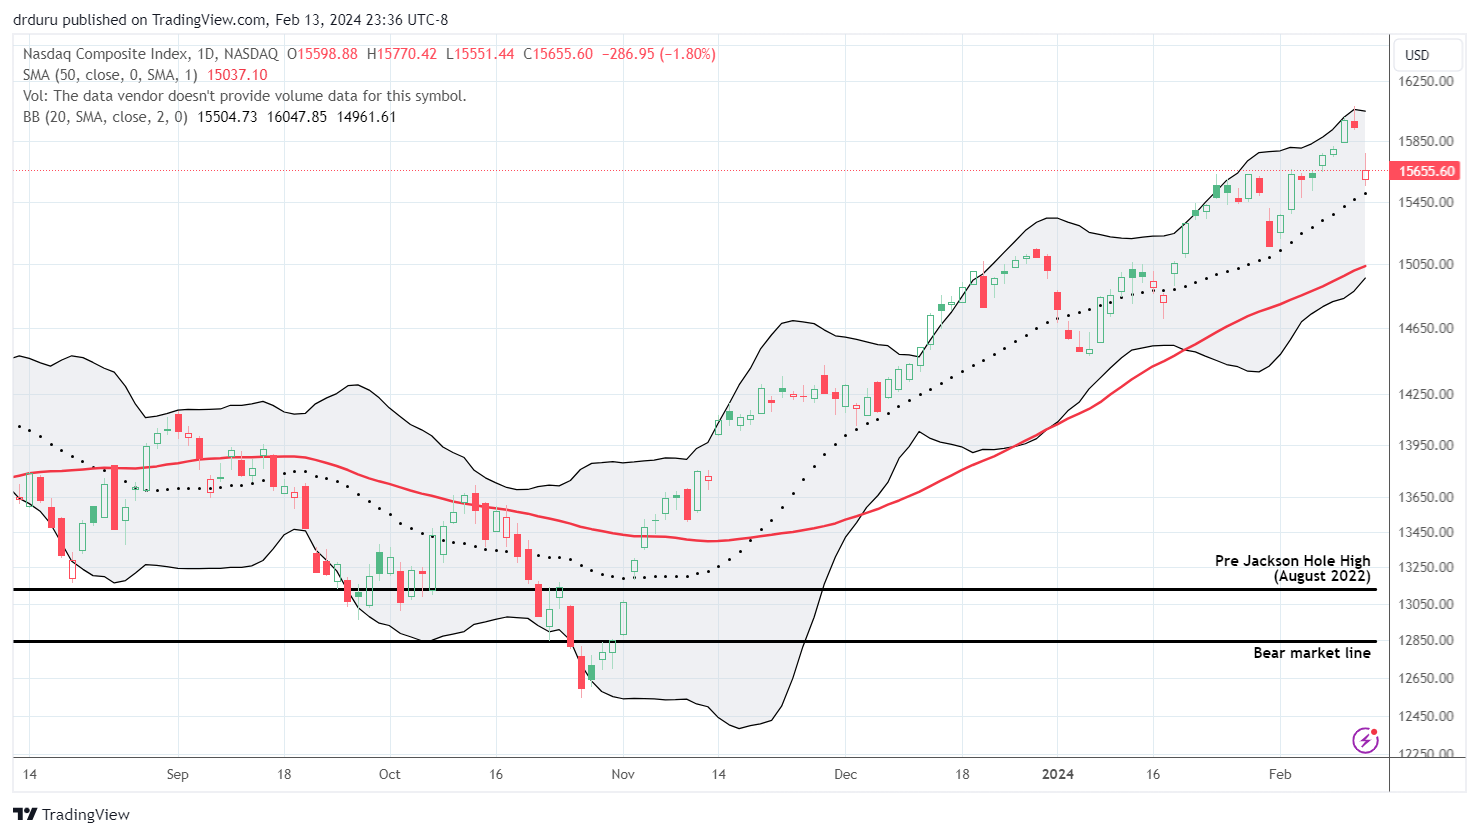
The NASDAQ (COMPQ) also survived a test of 20DMA support. The move was not quite as convincing as the S&P 500’s rebound, but the tech-laden index escaped the day with its uptrend intact.
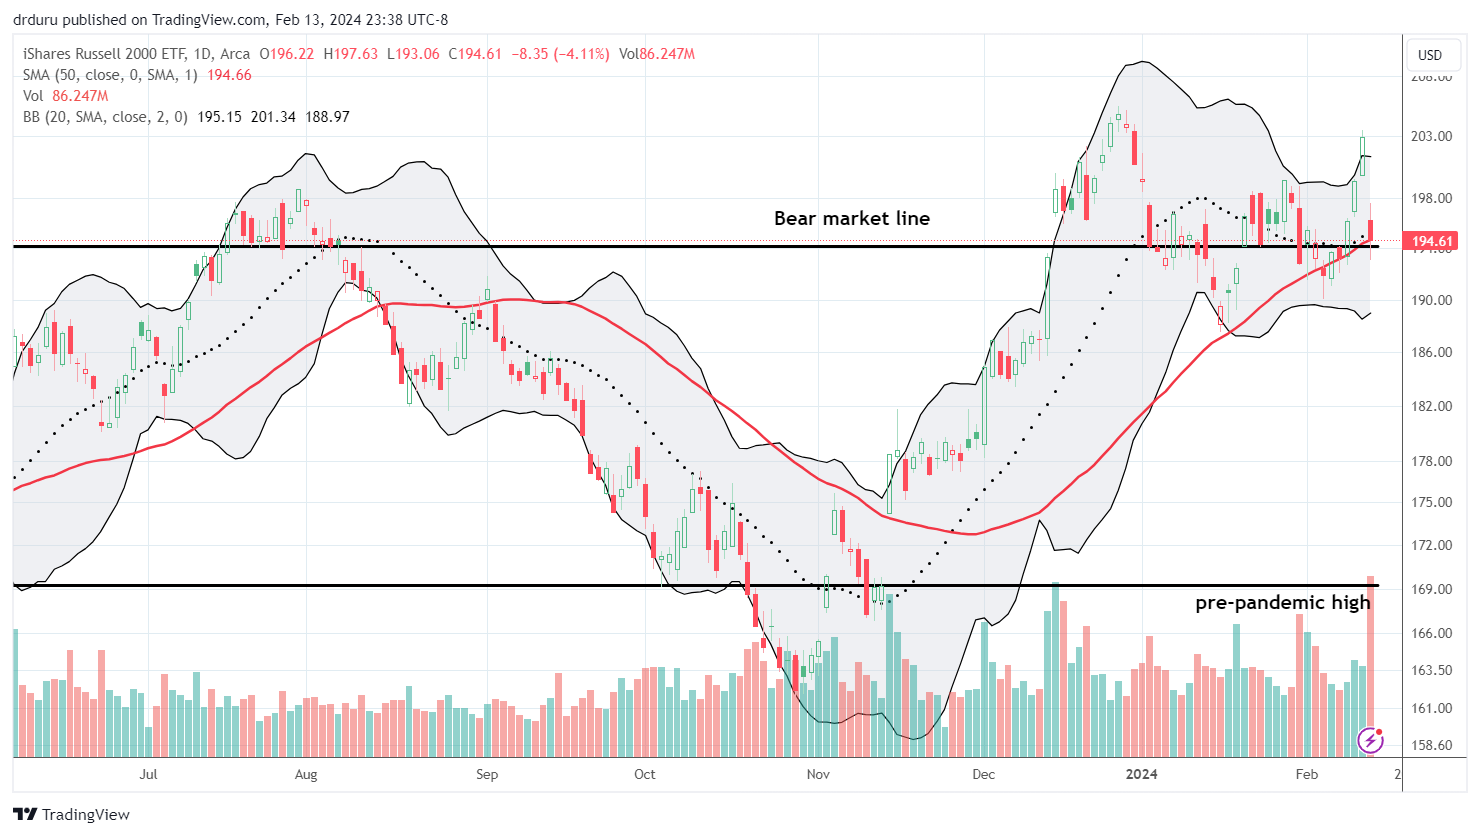
The iShares Russell 2000 ETF (IWM) was the big story of the day. The ETF of small cap stocks gapped down and lost a whopping 4.1%. The technical traders took mercy on the sudden reversal and defended support at the converged bear market line and 50DMA (the red line). I was ready with a long IWM put but I took the steam out of one of my “be ready” trades by starting a transition to the bullish side with a calendar call spread at the $204 strike. I will likely close out the put in Wednesday’s trading. IWM’s mini-implosion reminds us of its hyper-sensitivity to expectations over monetary policy.
The Short-Term Trading Call to Be Ready
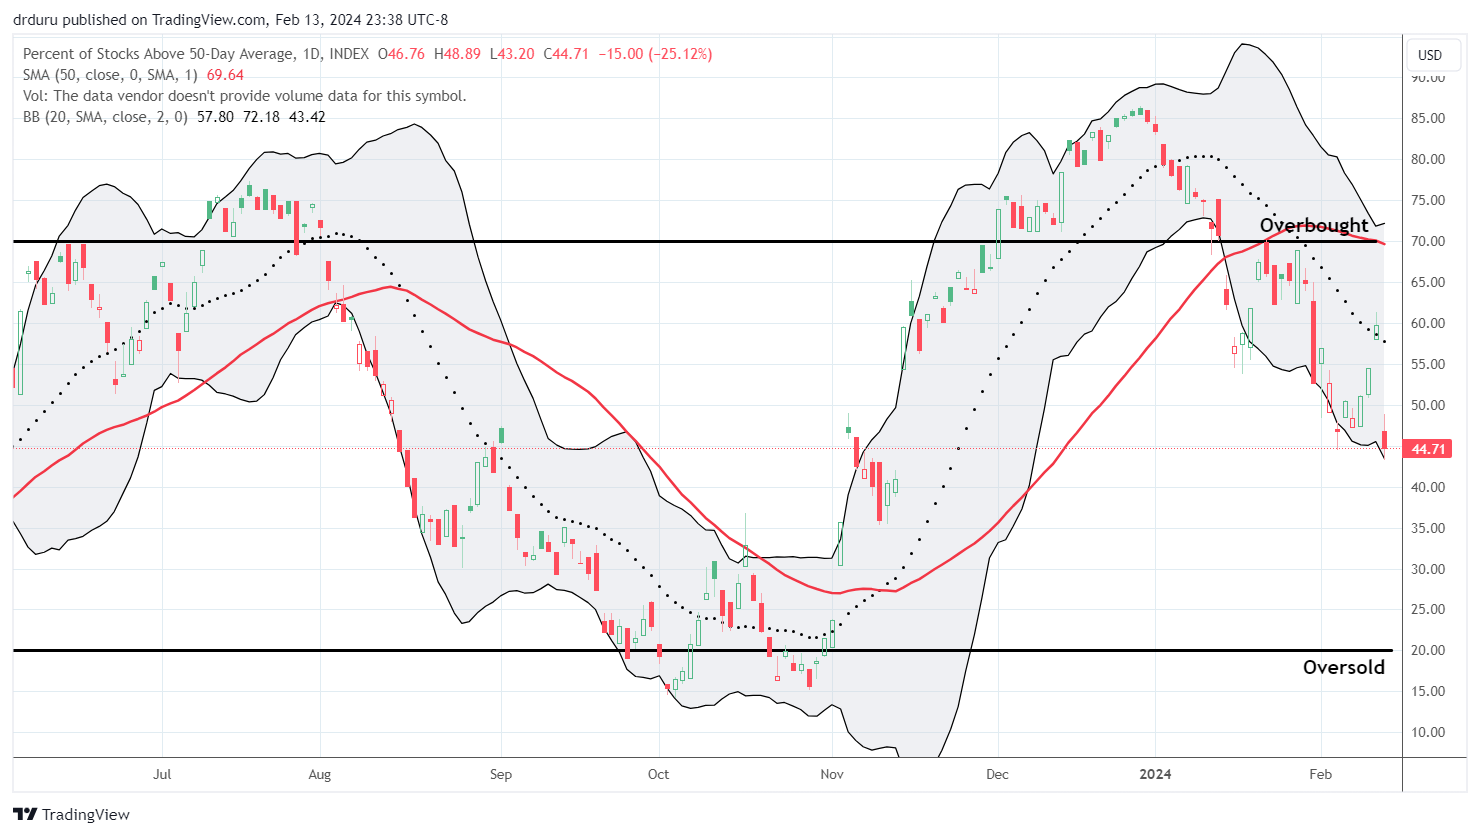
- AT50 (MMFI) = 44.7% of stocks are trading above their respective 50-day moving averages
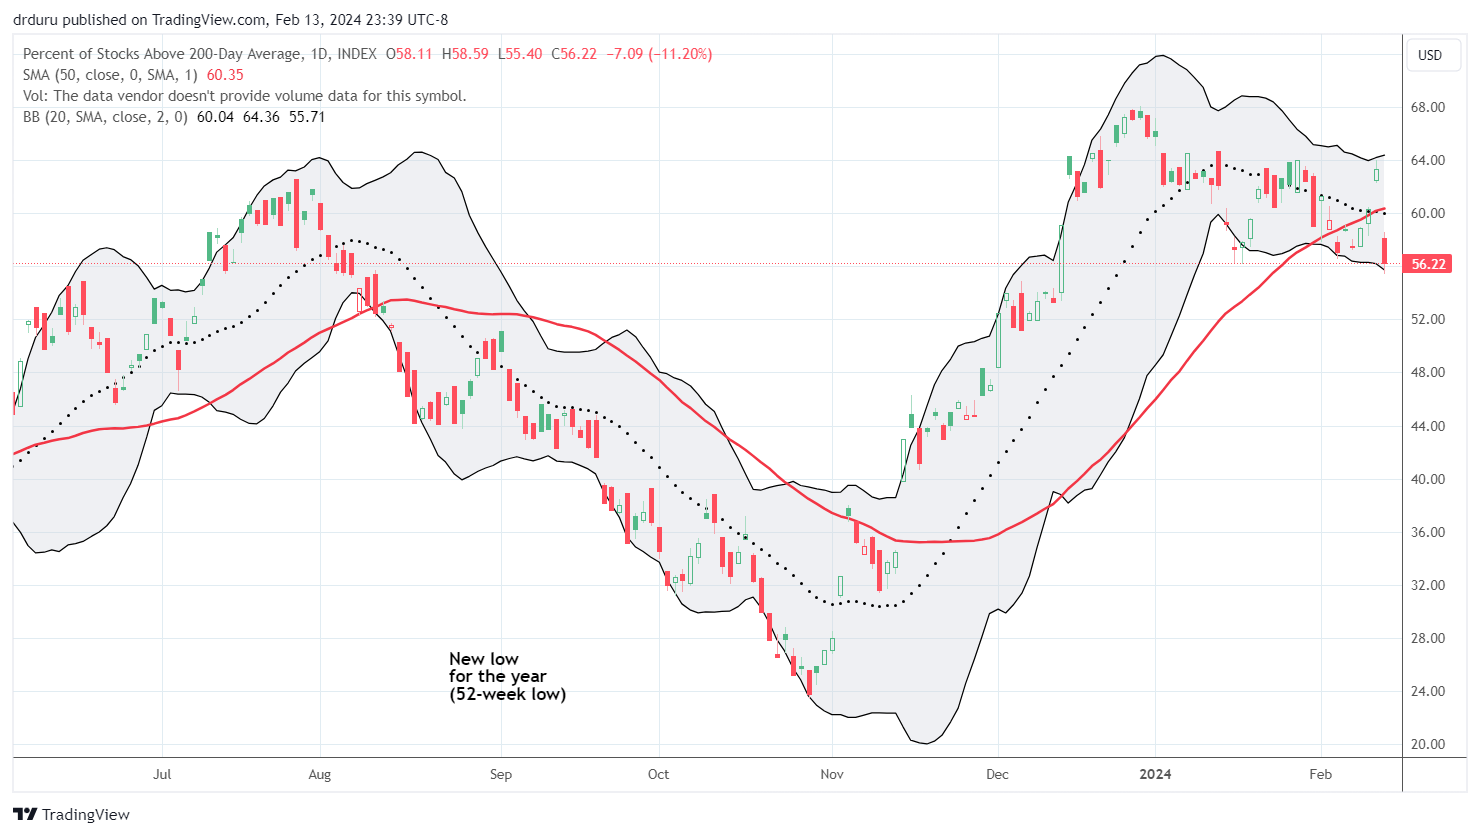
- AT200 (MMTH) = 56.2% of stocks are trading above their respective 200-day moving averages
- Short-term Trading Call: bearish
AT50 (MMFI), the percentage of stocks trading above their respective 50DMAs, plunged to a 3-month low and closed at 44.7%. My favorite technical indicator fell from 60.0% and preserved an overall downtrend from its end of year peak in 2023. AT50 faltered at the edge of ending the downtrend and threatening a resumption of overbought trading. It instead plunged right back into a confirmation of the bearish market breadth signals in place since it fell from overbought trading last month. This instant transformation was a reminder of what it means to be ready!
AT200 (MMTH), the percentage of stocks trading above their respective 200DMAs, also plunged. This indicator of the longer-term health of market breadth closed at a 2-month low. AT200 is slowly boiling a “be ready” warning flag.
In the following video, I go through a quick review of some key stock charts. I still see a mix of bullish and bearish truths, but, of course, the bearish action continues to catch the bulk of my attention.
Be careful out there!
Footnotes
Subscribe for free to get email notifications of future posts!
“Above the 50” (AT50) uses the percentage of stocks trading above their respective 50-day moving averages (DMAs) to measure breadth in the stock market. Breadth defines the distribution of participation in a rally or sell-off. As a result, AT50 identifies extremes in market sentiment that are likely to reverse. Above the 50 is my alternative name for “MMFI” which is a symbol TradingView.com and other chart vendors use for this breadth indicator. Learn more about AT50 on my Market Breadth Resource Page. AT200, or MMTH, measures the percentage of stocks trading above their respective 200DMAs.
Active AT50 (MMFI) periods: Day #54 over 20%, Day #52 over 30%, Day #50 over 40% (overperiod), Day #1 under 50% (underperiod ending 3 days over 50%), Day #10 under 60%, Day #21 under 70%
Source for charts unless otherwise noted: TradingView.com
Full disclosure: long ARKK, long IWM put, long HSY, long QLYS, long BILL shares and call option
FOLLOW Dr. Duru’s commentary on financial markets via StockTwits, Twitter, and even Instagram!
*Charting notes: Stock prices are not adjusted for dividends. Candlestick charts use hollow bodies: open candles indicate a close higher than the open, filled candles indicate an open higher than the close.


