Stock Market Commentary
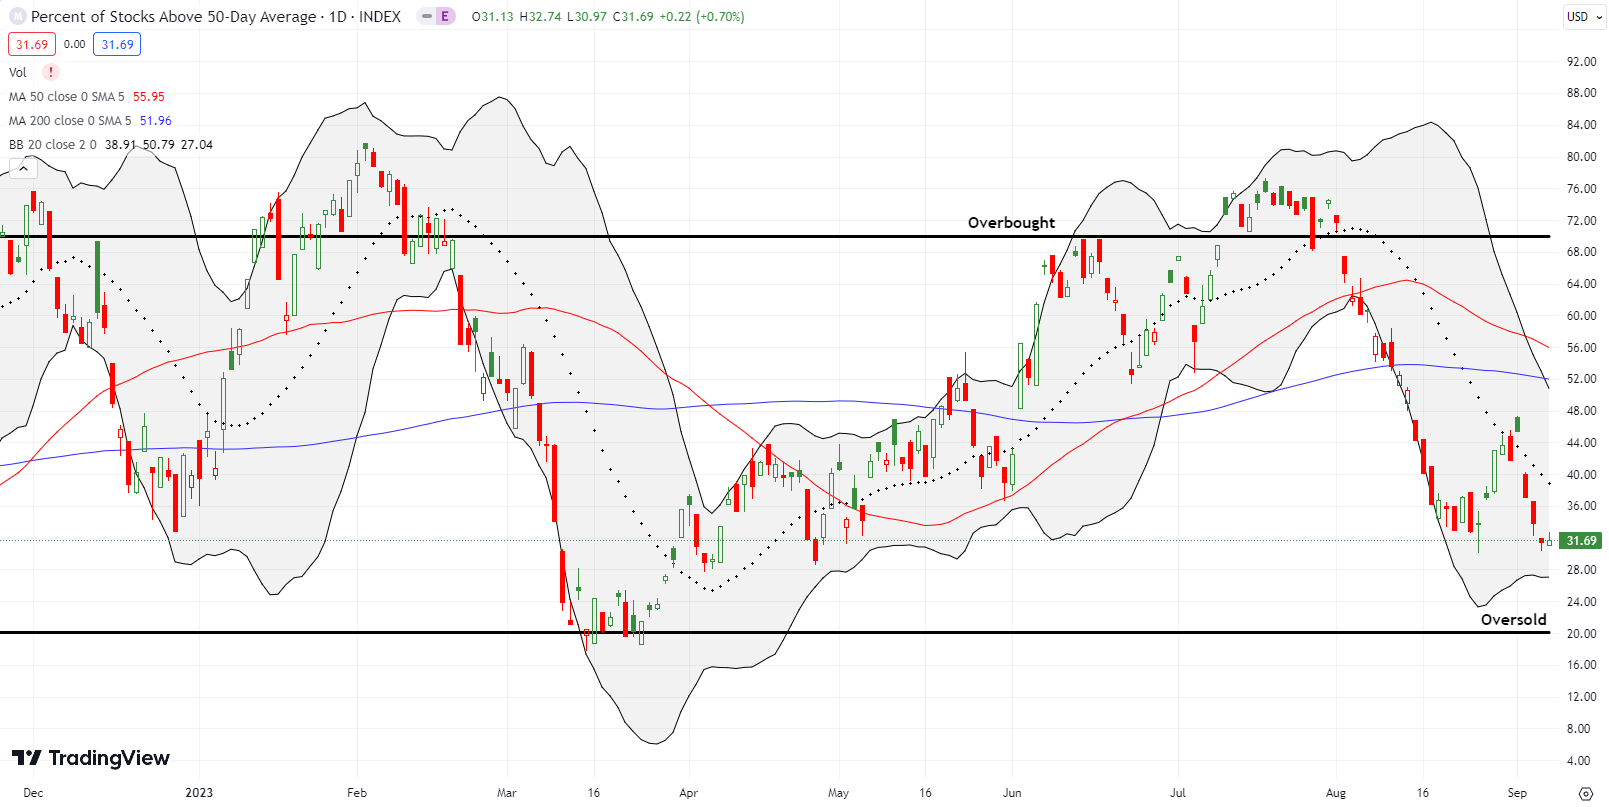
The stock market got a case of the uglies last week. The end of summer trading transitioned right into a swift drawdown for the stock market’s second of the three most dangerous months of the year. The fresh breakdowns in the major indices accompanied new lows for market breadth. Suddenly, what I thought was a bottom for market breadth last month looks like a speedbump on the way to oversold trading. Interestingly, this new low is happening with major indices still above their lows from last month. This is a type of bearish divergence that has me considering the prospects for oversold trading.
Last week’s plunge in market breadth also caught the attention of TraderMike at swingtradebot. On the big breakdown day of the week, he noted: “Breadth is poor, as measured by the ‘% of Stocks Above Their 50-Day Moving Averages’. That indicator is also interesting because it’s near its August low while the indices are well above their August lows. I’m not sure what to make of that but I do know that, IMHO, to have a healthy rally that indicator need to be making higher highs and higher lows. At best it’s going sideways now & on the verge of making a lower low.” Two trading days later, the small caps are near testing their August lows and market breadth is staring down imminent oversold conditions.
The Stock Market Indices
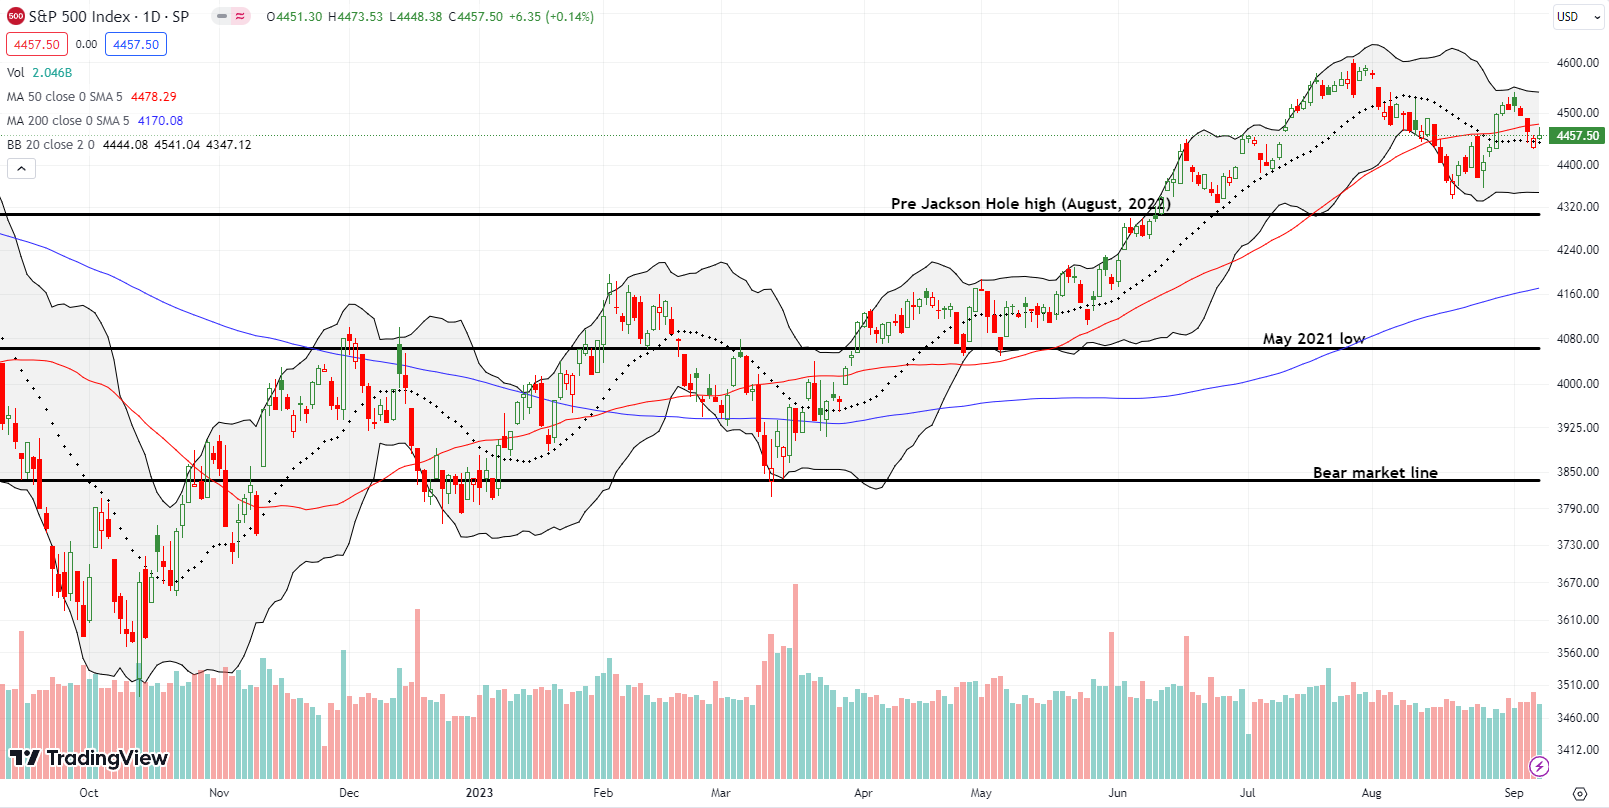
The S&P 500 (SPY) suffered a fresh breakdown below its 50-day moving average (DMA) (the red line in the chart). The index ended the week down 1.1% for the month. This drawdown is the S&P 500’s median maximum drawdown for September. Support at the 20DMA (the dashed line) saved the week from further losses. However, I fully expect this support to give way by the time of the Federal Reserve’s next pronouncements on monetary policy on September 20.
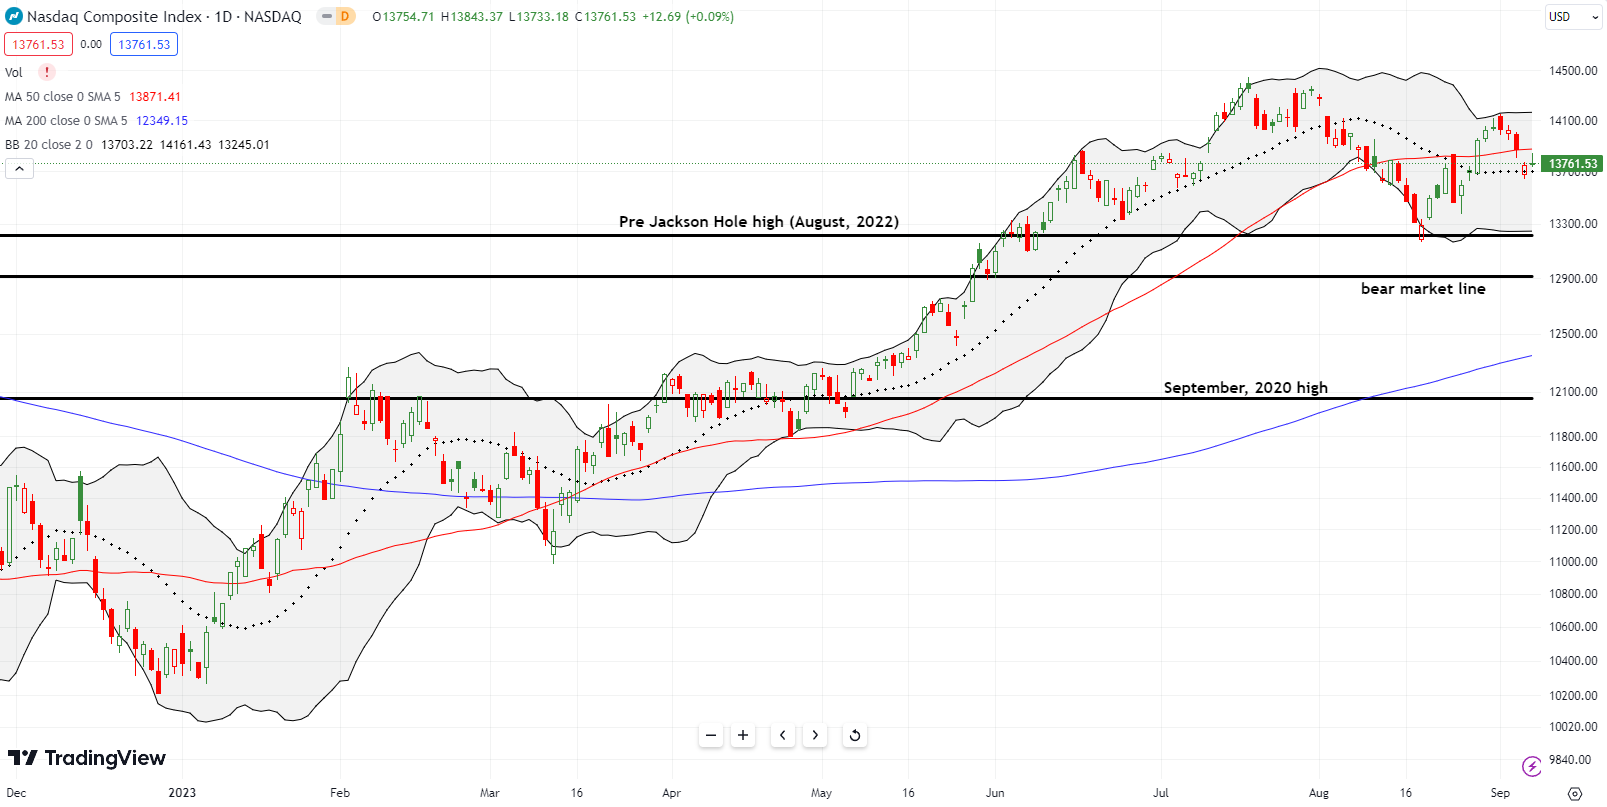
The NASDAQ (COMPQ) continues to mimic the S&P 500 (or the other way around!). One small difference occurred on Wednesday’s breakdown day. Apple (AAPL) sliced through its 50DMA support with a 3.6% loss on news that the Chinese Communist Party (CCP) had banned iPhones for government workers. (The news also spoiled AAPL’s giddy march higher toward its September 12th product release event). The NASDAQ somehow only lost 1.1% and held 50DMA support for the day. The next day’s 0.9% loss held 20DMA support. Like the S&P 500, notice the risk of a lower high from the end of September’s rebound. The stakes are high for holding the August lows as support right at the pre Jackson Hole high from 2022. Otherwise, a new downtrend will be underway that will look to test the bear market line and even 200DMA support (the bluish line).
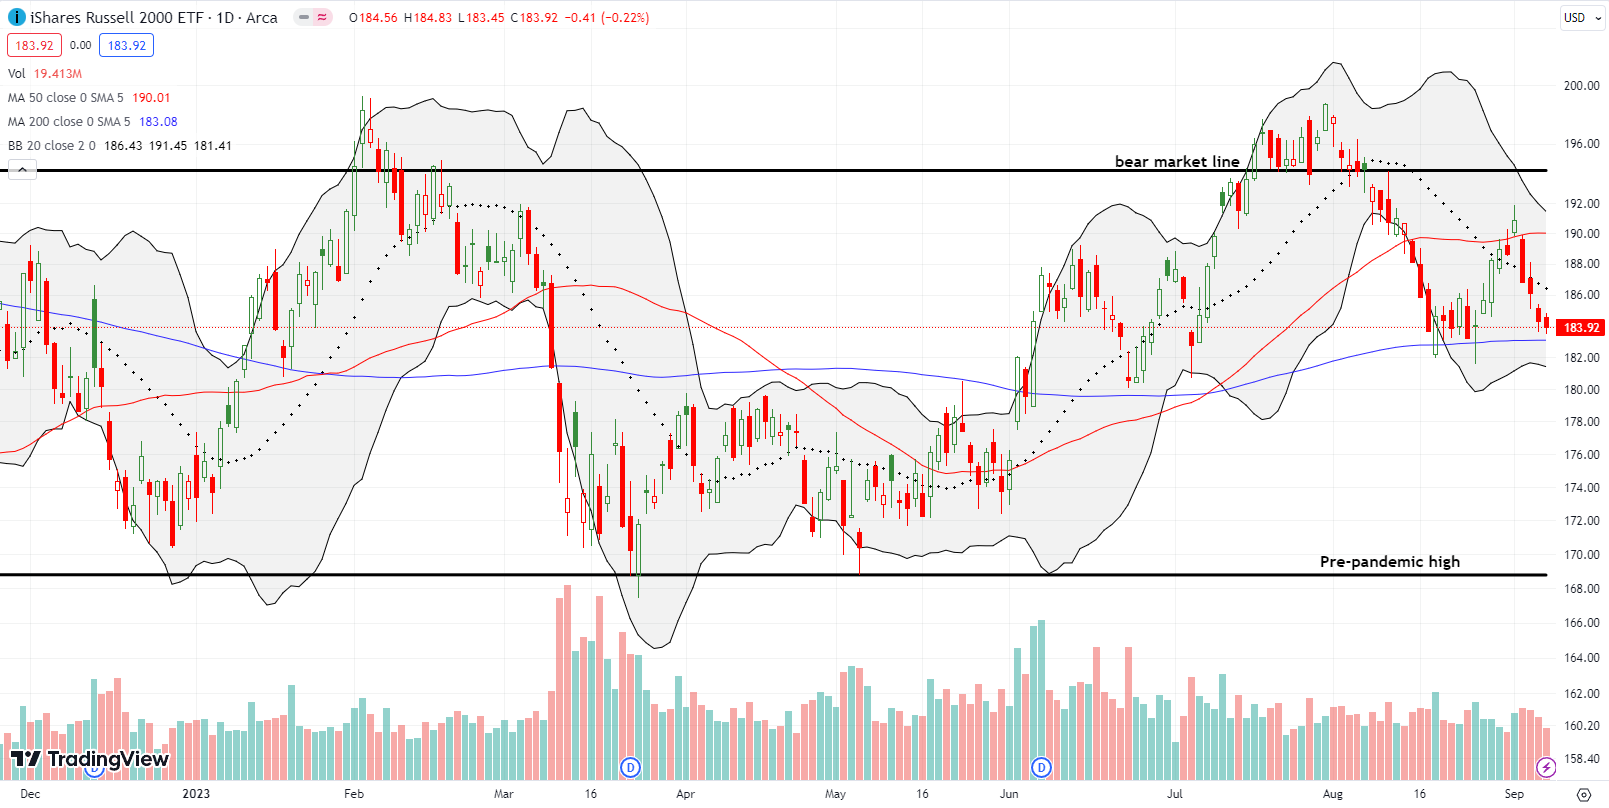
The iShares Russell 2000 ETF (IWM) underperformed for the week as buyers failed to show up at any point. IWM lost ground on each day of the week. Now the ETF of small caps is already testing the lows from August and looking to test its 200DMA support as a part of the technical drama.
The Short-Term Trading Call with A Bearish Divergence
- AT50 (MMFI) = 31.7% of stocks are trading above their respective 50-day moving averages (day #3 overbought)
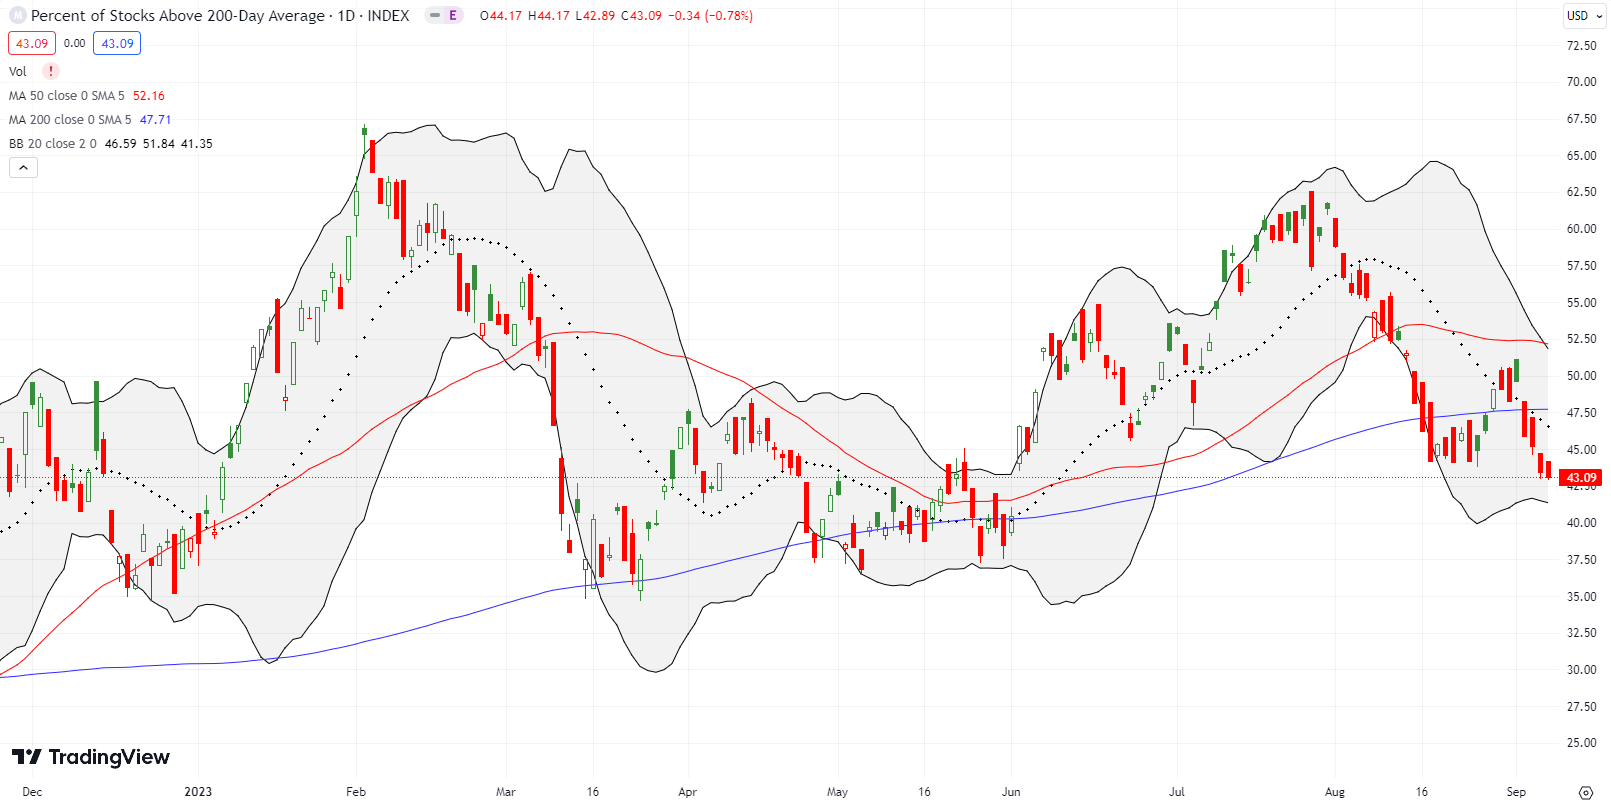
- AT200 (MMTH) = 43.1% of stocks are trading above their respective 200-day moving averages
- Short-term Trading Call: neutral
AT50 (MMFI), the percentage of stocks trading above their respective 50DMAs, plunged to 31.7%. My favorite technical indicator was last at these levels in late April as the market recovered from March’s regional bank failures. These new lows have me anticipating eventual oversold trading conditions. The space for the decline comes from the S&P 500 and the NASDAQ continuing to trade comfortably above their August lows. The good news for this bearish divergence is that a test of the August lows for the S&P 500 and the NASDAQ should come with oversold conditions that will make buying those lows even easier than it was to buy last month. Also note that a retest of those lows would take the S&P 500 just beyond its average maximum drawdown for September.
AT200 (MMTH), the percentage of stocks trading above their respective 200DMAs, looks even more precarious than AT50. The longer-term market breadth indicator has closed two days in a row below the August lows and was last at these levels three months ago. This deterioration adds further emphasis to the current bearish divergence between market breadth and the major indices.
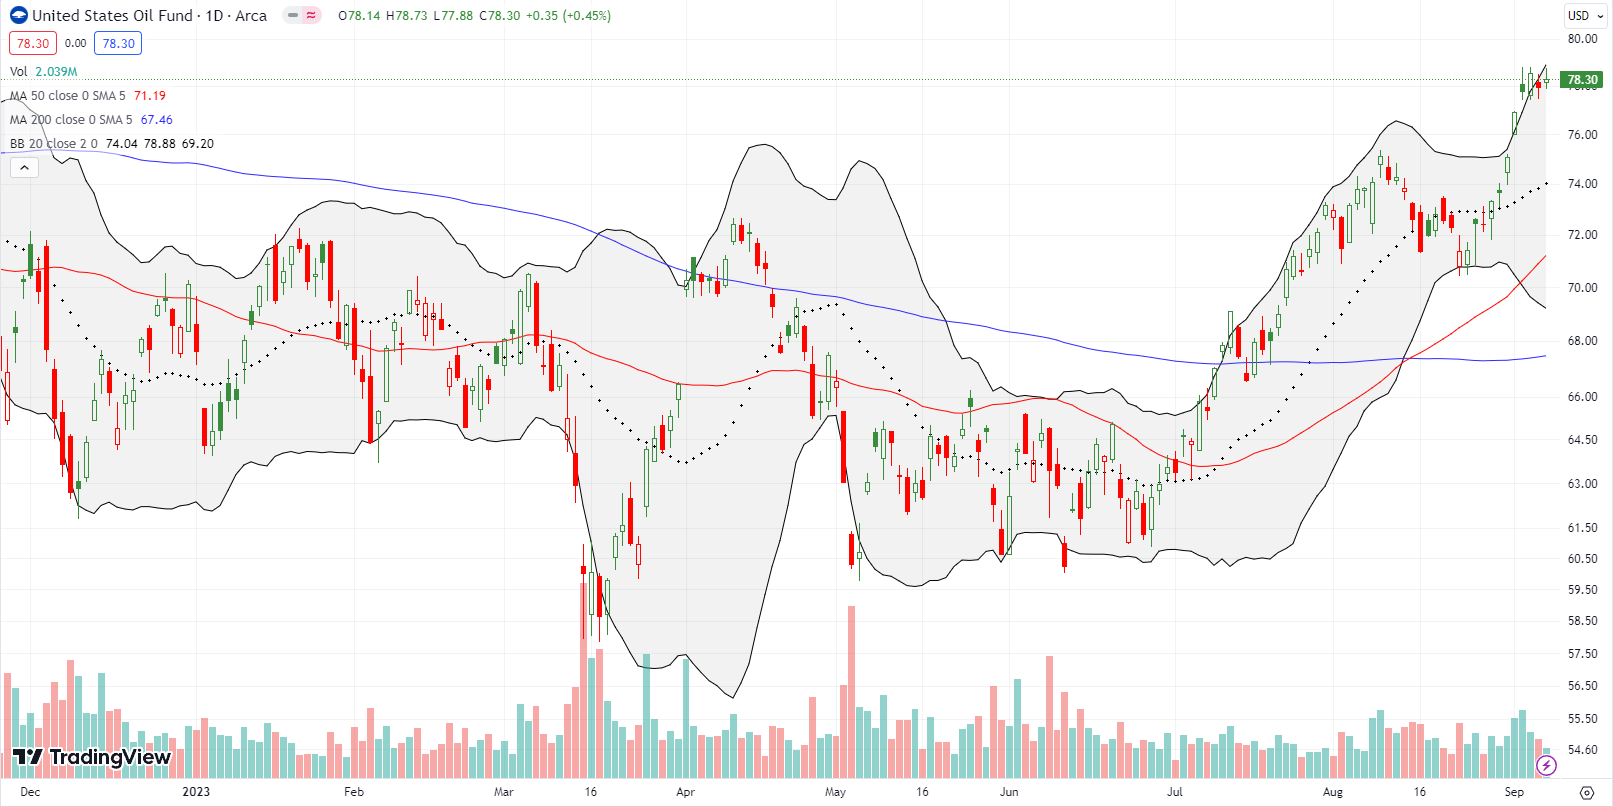
The United States Oil ETF (USO) continues to rally and now trades at a 52-week high. The relentless rise in oil prices has largely gone ignored by the stock market. Yet at some point, oil has to matter given student loan payments are due to restart soon after a 3 1/2 year hiatus. Consumer spending is bound to compress, especially with overall prices in the economy remaining elevated. I have missed a lot of oil move given a residual trade that has me rolling USO call options with a short USO position. At this point, I “just” need USO to pullback to 50DMA support to give my patience a small reward.
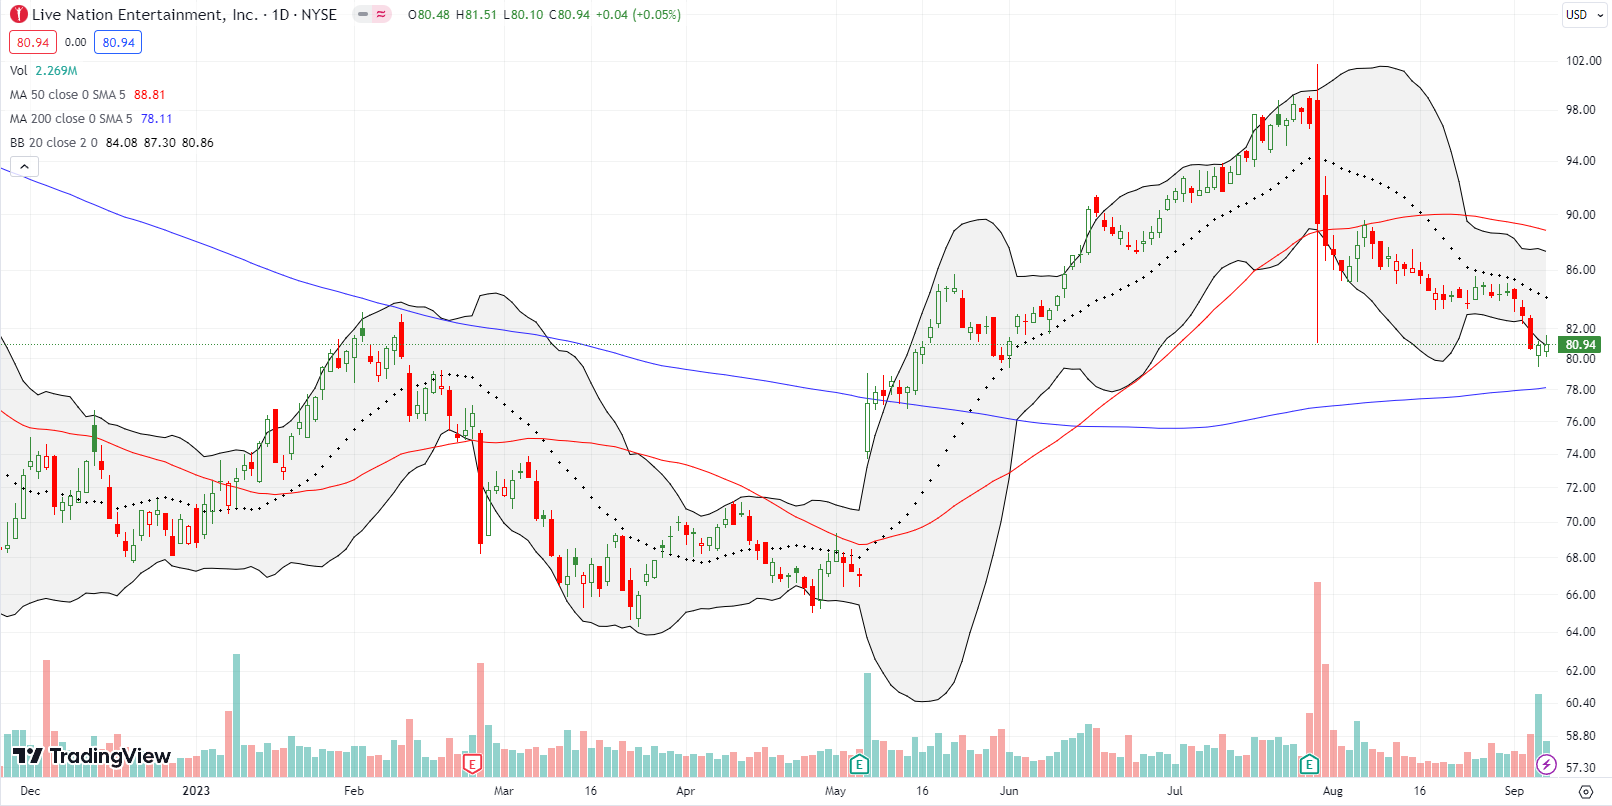
Over a month ago, I described a delicately hedged trade in Live Nation Entertainment, Inc (LYV). The setup worked out as well as I could expect with a profitable sale of the long side of the former put calendar spread last week. LYV has benefited from a lot of big headline concerts over the summer. However, I think of this buzz as peak entertainment with the given consumer headwinds. Of course, the actor’s strike will usher in a drought of original content next year and perhaps live entertainment will benefit in the vacuum.
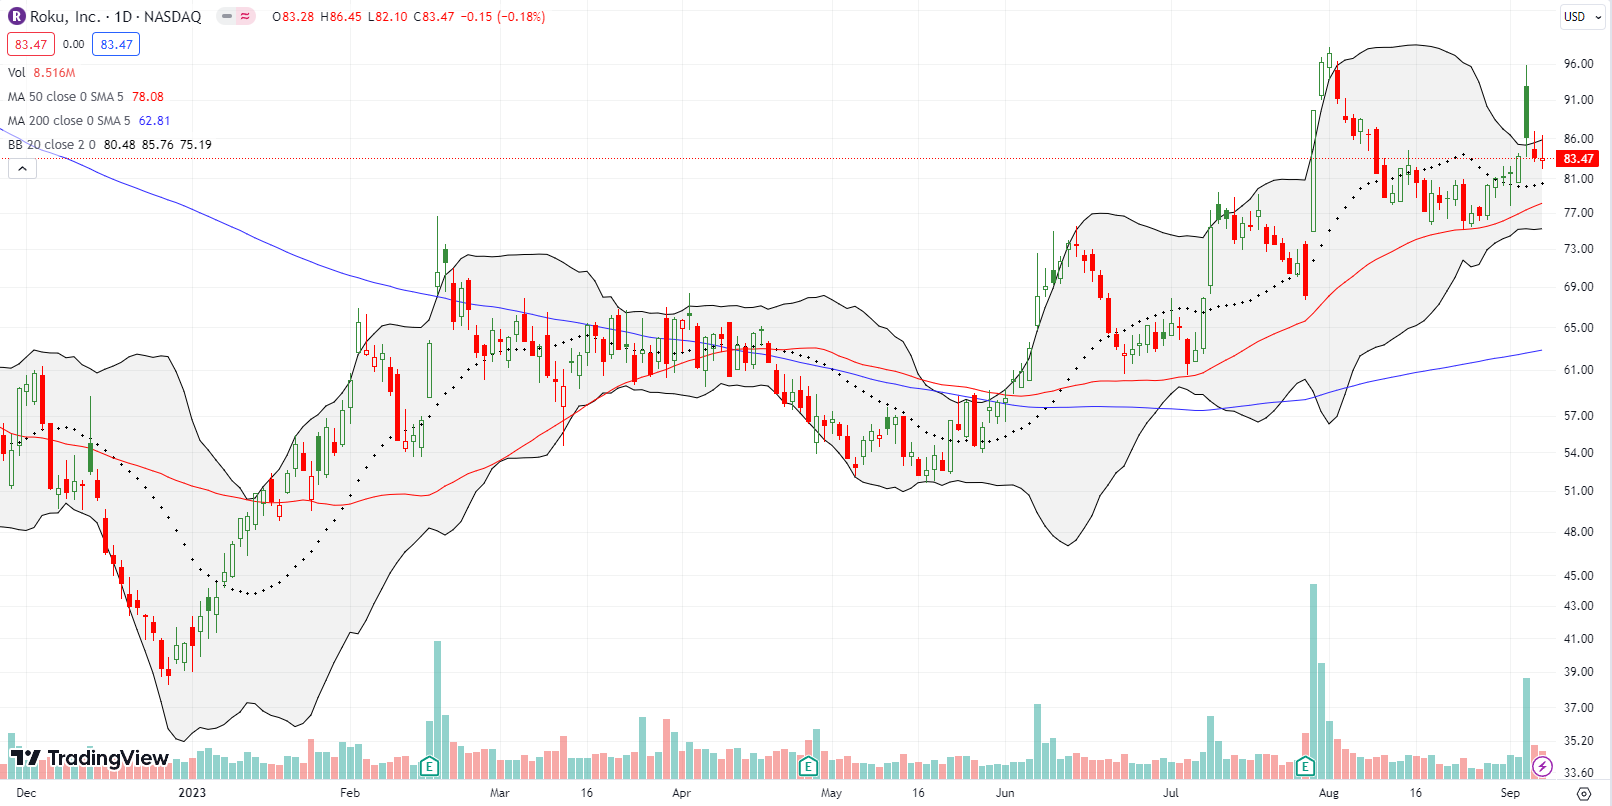
Roku, Inc (ROKU) rallied at one point to a 14.5% gain in response to an 8K filing announcing a 10% layoff and corporate restructuring to reduce costs. Wall Street loves layoffs given the prospect of preserving more profits for shareholders (or at least in this case, lower losses for shareholders). Yet, the news also came on breakdown Wednesday, and sellers jumped at the pop to resistance from the post-earnings high August 1st. Moreover, four insiders filed with the SEC to sell shares, hardly a show of confidence in the restructuring. Having said all that, ROKU printed a bullish technical signal in the form of a “calm after the storm.” Thus, I am looking to buy the stock at the first sign of buying interest without a breach of Friday’s intraday low.
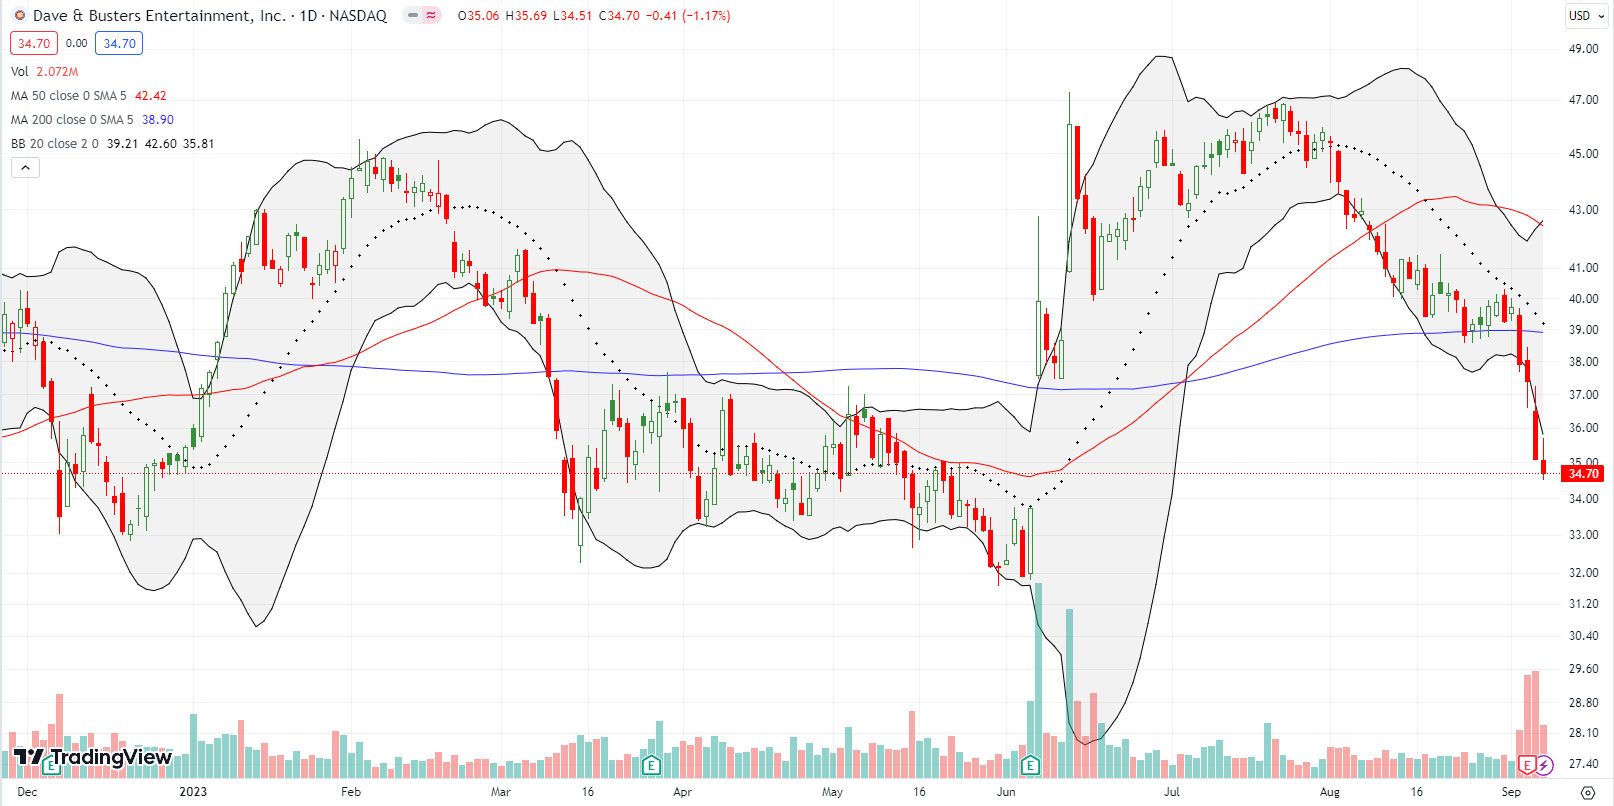
Dave & Busters Entertainment, Inc (PLAY) went into earnings last week with a 200DMA breakdown. The selling continued after earnings. With the post-earnings gap up from June just about filled, I decided to recharge my covered call trade that I first wrote about in January in response to insider buying.
Be careful out there!
Footnotes
Subscribe for free to get email notifications of future posts!
“Above the 50” (AT50) uses the percentage of stocks trading above their respective 50-day moving averages (DMAs) to measure breadth in the stock market. Breadth defines the distribution of participation in a rally or sell-off. As a result, AT50 identifies extremes in market sentiment that are likely to reverse. Above the 50 is my alternative name for “MMFI” which is a symbol TradingView.com and other chart vendors use for this breadth indicator. Learn more about AT50 on my Market Breadth Resource Page. AT200, or MMTH, measures the percentage of stocks trading above their respective 200DMAs.
Active AT50 (MMFI) periods: Day #83 over 20%, Day #57 over 30%, Day #4 under 40%, Day #18 under 50%, Day #23 under 60%, Day #26 under 70%
Source for charts unless otherwise noted: TradingView.com
Full disclosure: long covered call PLAY, long IWM call, long OSU call and short shares
FOLLOW Dr. Duru’s commentary on financial markets via StockTwits, Twitter, and even Instagram!
*Charting notes: Stock prices are not adjusted for dividends. Candlestick charts use hollow bodies: open candles indicate a close higher than the open, filled candles indicate an open higher than the close.


