Stock Market Commentary
The bulls win big. The summer of loving stocks continued with the bulls overcoming a major hurdle: the overbought threshold for market breadth. After two failed attempts in the last month, the third attempt became the charm. The charm received a strong endorsement from fresh breakouts by the S&P 500 and the NASDAQ. While an agreeable inflation reading for June was the headline catalyst for the day’s buying, the market has clearly long forgotten about the inflation threat. The rally to-date essentially put inflation in the rear view mirror….and a recession too far over the horizon to cause worry.
The Stock Market Indices
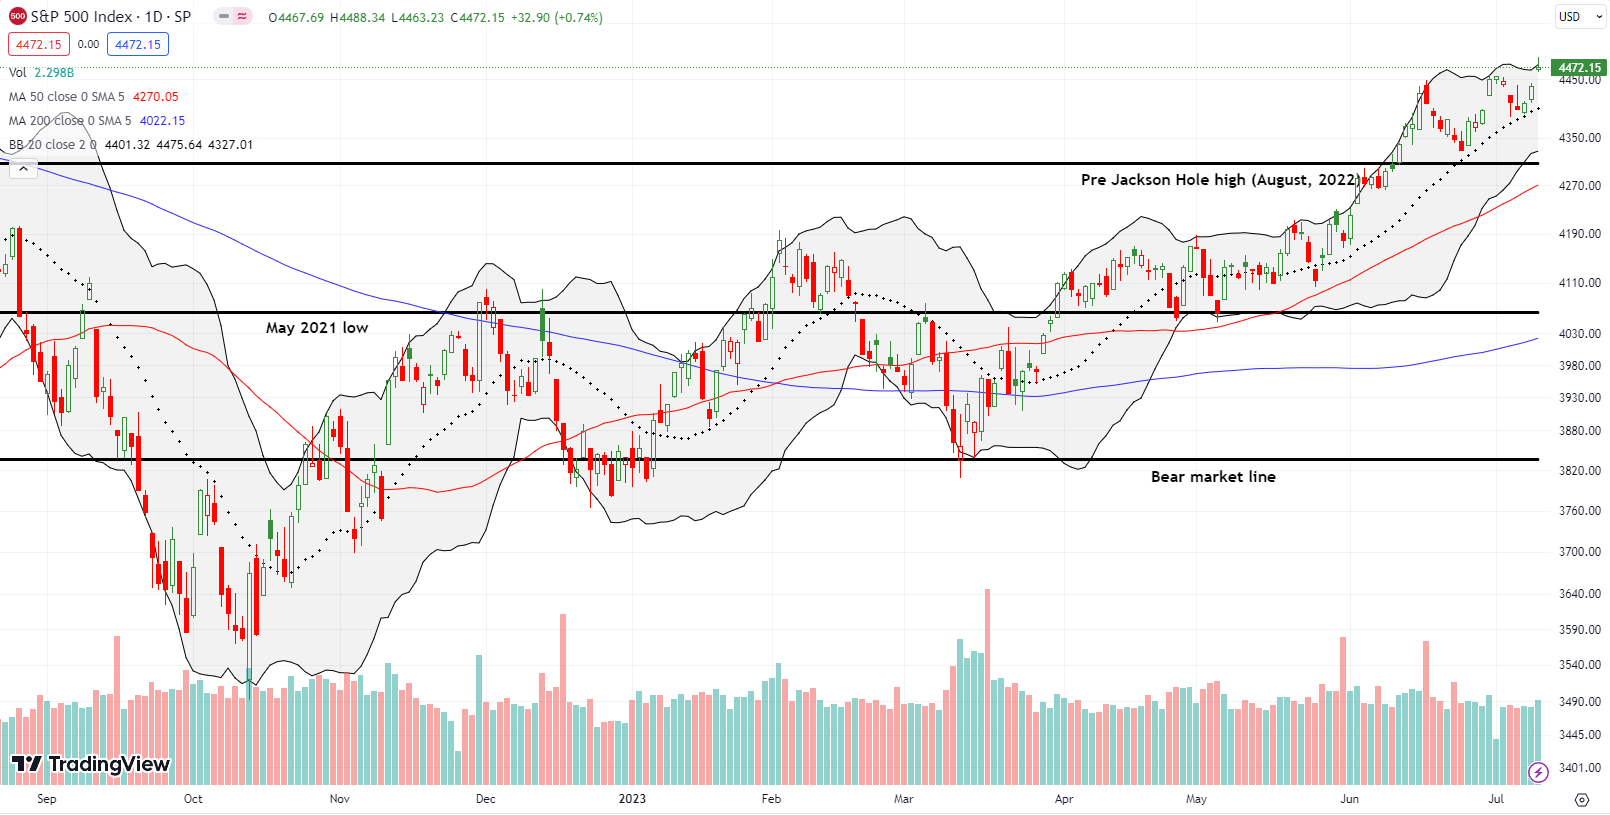
The S&P 500 (SPY) converted a messy test of support at its 20-day moving average (DMA) (the dotted line below) into a bullish rebound. The index gained 0.7% and closed at a fresh 15-month high. A fade from the intraday high was a slight blemish on otherwise poetic trading action.
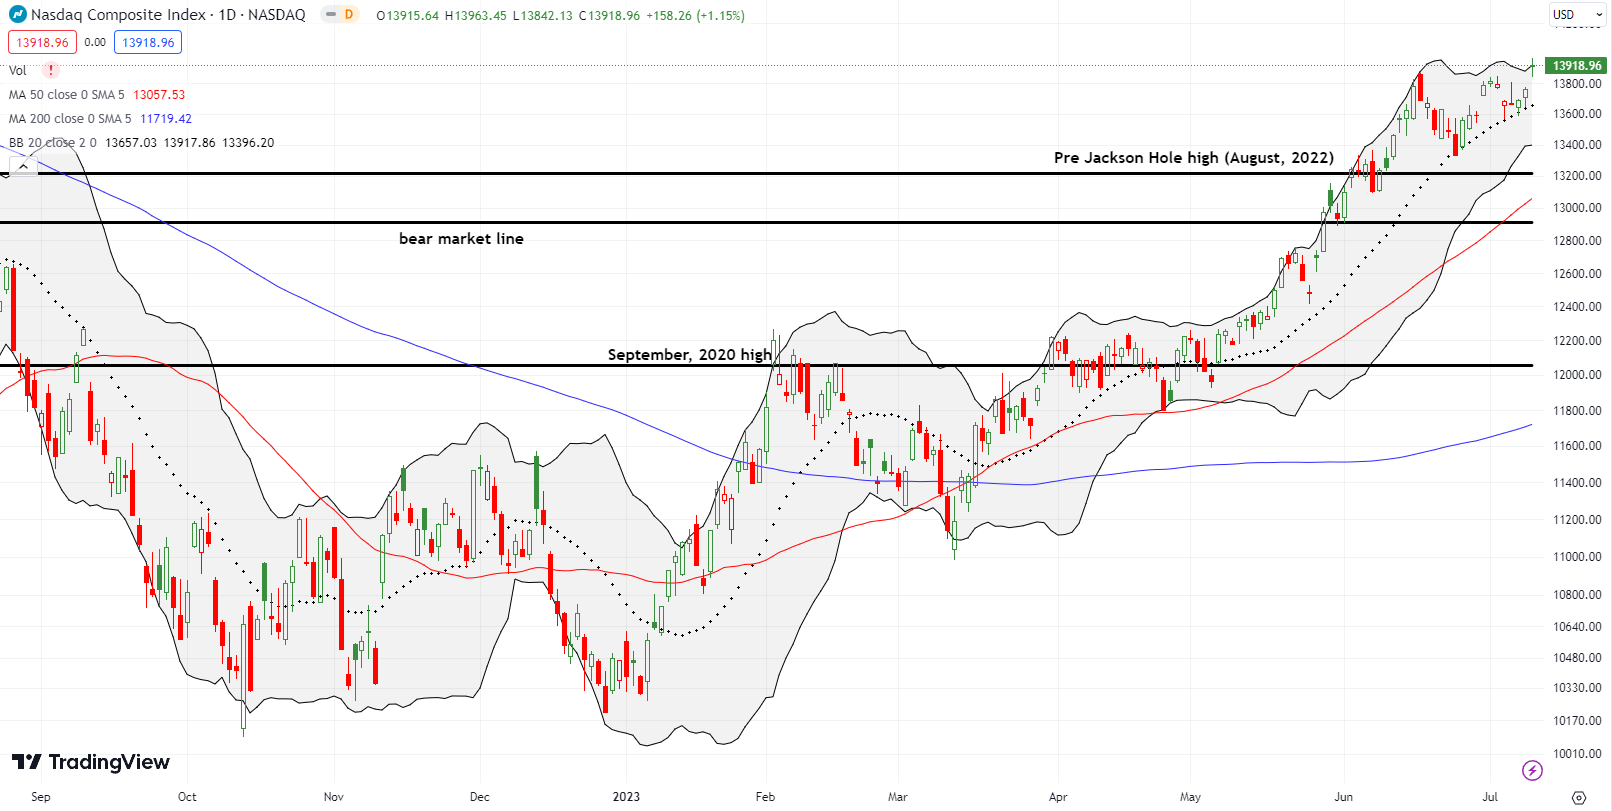
The NASDAQ (COMPQ) had a much more picturesque test of 20DMA support. The tech laden index “lightly” tapped 20DMA support three out of the last 4 days before today’s gap up and 1.2% gain. The NASDAQ closed at a 15-month high.
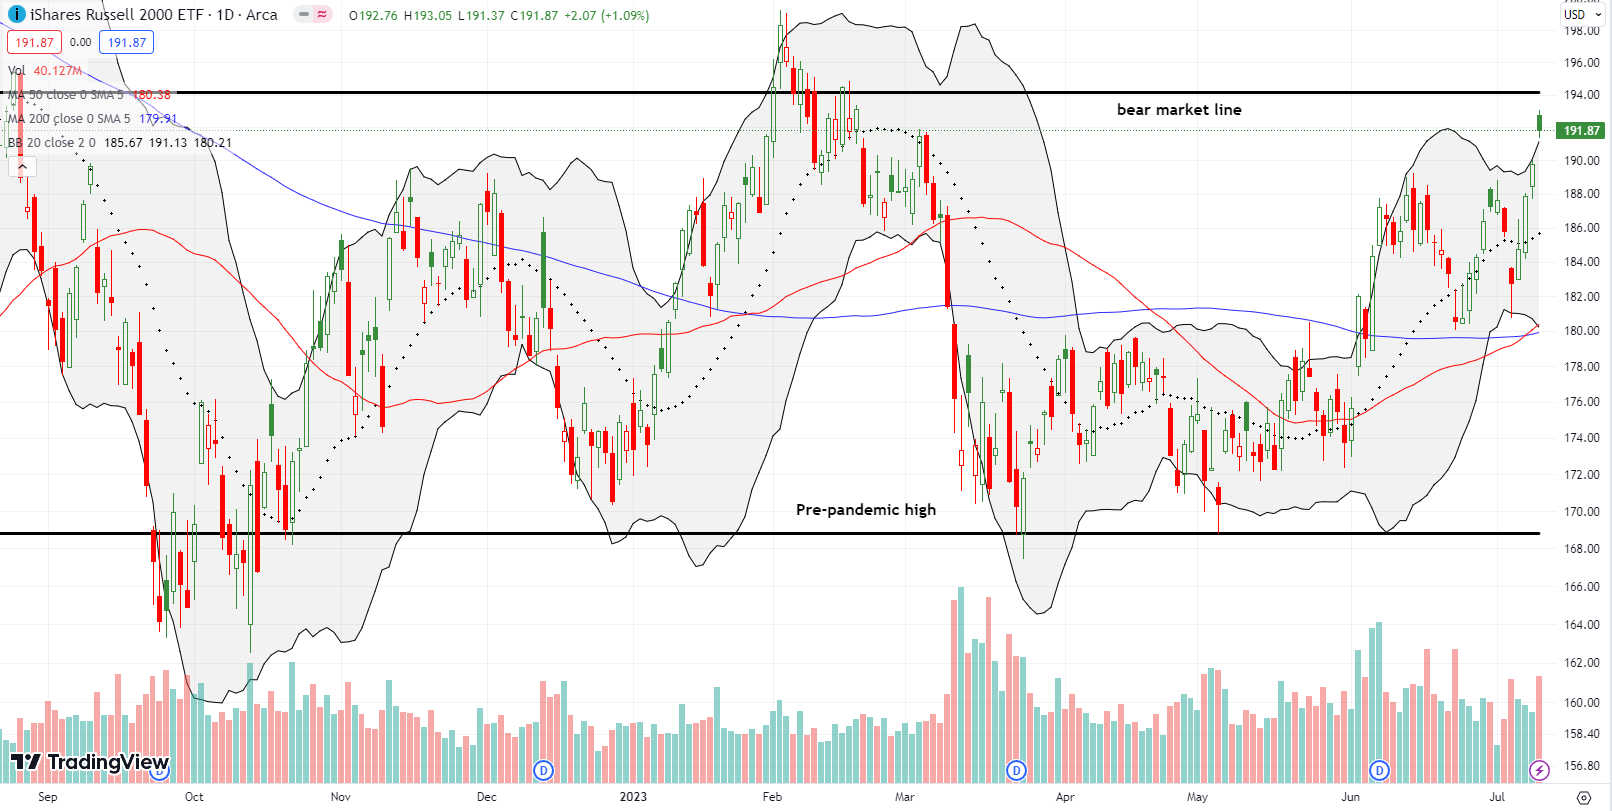
The iShares Russell 2000 ETF (IWM) surprised me and left me longing for my last call spread position! Starting with Tuesday’s breakout, the ETF of small caps sliced right through presumed resistance from the highs of June. IWM gained 1.1% on the day and closed above its upper Bollinger Band (BB). The buying pressure is clearly strong, but now IWM is stretched to the upside.
The Short-Term Trading Call As Bulls Win Big
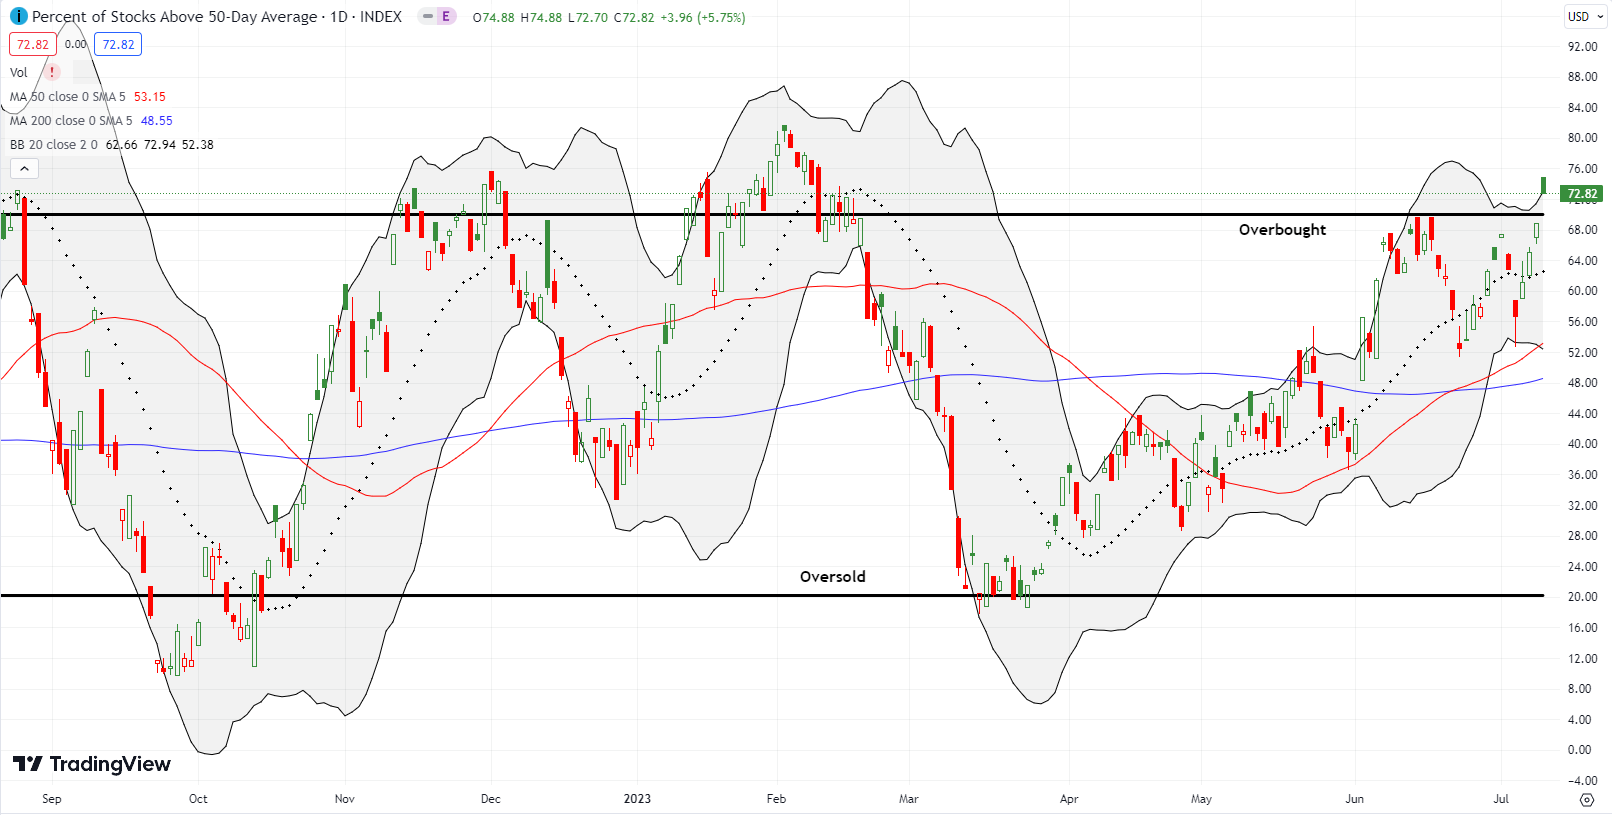
- AT50 (MMFI) = 72.8% of stocks are trading above their respective 50-day moving averages (day #1 overbought)
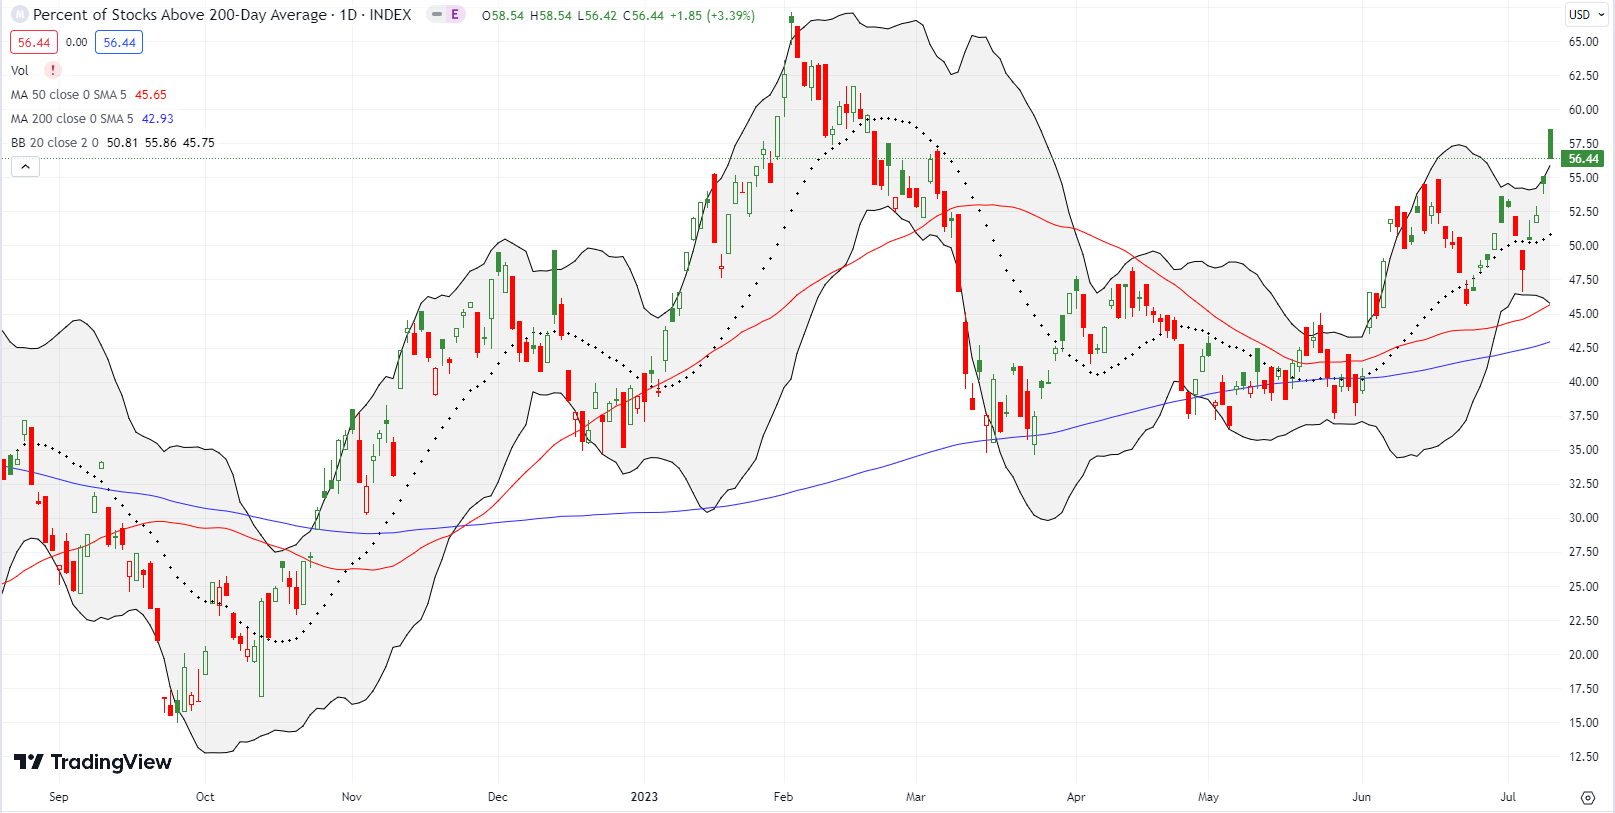
- AT200 (MMTH) = 56.4% of stocks are trading above their respective 200-day moving averages
- Short-term Trading Call: cautiously bullish
AT50 (MMFI), the percentage of stocks trading above their respective 50DMAs, achieved overbought status with a close above the 70% threshold. The bulls win big with this move given the potentially bearish implications of the last two failures at the overbought threshold.
I went into this breakout neutral. Typically, I would stay neutral here because flipping to bullish during overbought trading risks a rush to flip the trading call. However, the S&P 500 complemented the AT50 breakout with its own breakouts. I interpret that move as a bullish one. Moreover, I keep seeing a proliferation of bullish charts in swingtradebot.com. Thus, I am sticking my neck out here and upgrading the short-term trading call back to cautiously bullish.
It is crucial to clarify that reaching an overbought status should not be misconstrued as a bearish indicator. On the contrary, failures to cross the threshold or exits from overbought conditions are the situations that typically merit a bearish outlook. These occurrences often signal potential buying power exhaustion and waning market enthusiasm. By contrast, maintaining overbought trading conditions can serve as a confirmation of robust buying strength.
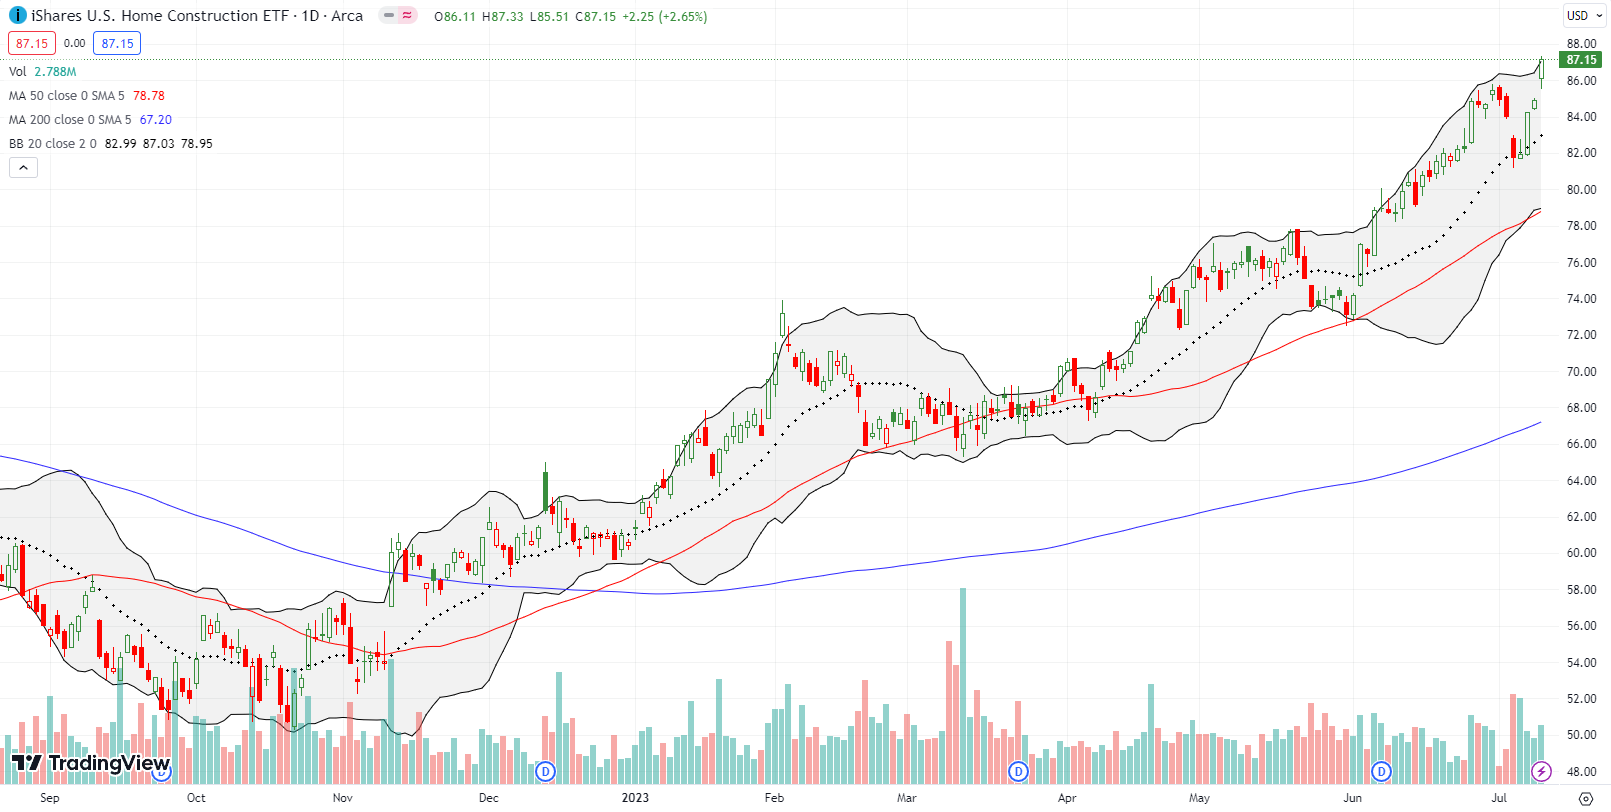
Home builders have added serious weight to the market’s bullish tone. Their stocks and financial performances have surprised over and over. At this point, this rate-sensitive sector might as well be FEEDING off Fed rate hikes. There is almost nothing more bullish than the persistent rally for iShares US Home Construction ETF (ITB) in the face of an increasingly hawkish Federal Reserve and stubborn pundit expectations (and hopes) for a recession (for the last 18 months or so!). Don’t look now, but ITB closed the day at an ALL-TIME high! I cannot imagine a more bullish signal from a sector under current economic conditions.
See my last Housing Market Review or my Seeking Alpha post “Why The Fed’s Call For A Housing Bottom Means Hawkish For Longer” for more background.
Be careful out there!
Footnotes
Subscribe for free to get email notifications of future posts!
“Above the 50” (AT50) uses the percentage of stocks trading above their respective 50-day moving averages (DMAs) to measure breadth in the stock market. Breadth defines the distribution of participation in a rally or sell-off. As a result, AT50 identifies extremes in market sentiment that are likely to reverse. Above the 50 is my alternative name for “MMFI” which is a symbol TradingView.com and other chart vendors use for this breadth indicator. Learn more about AT50 on my Market Breadth Resource Page. AT200, or MMTH, measures the percentage of stocks trading above their respective 200DMAs.
Active AT50 (MMFI) periods: Day #72 over 20%, Day #46 over 30%, Day #43 over 40%, Day #29 over 50%, Day #4 over 60%, Day #1 over 70% (first overbought day ending 94 days under 70%)
Source for charts unless otherwise noted: TradingView.com
Full disclosure: long ITB
FOLLOW Dr. Duru’s commentary on financial markets via StockTwits, Twitter, and even Instagram!
*Charting notes: Stock prices are not adjusted for dividends. Candlestick charts use hollow bodies: open candles indicate a close higher than the open, filled candles indicate an open higher than the close.


1 thought on “Bulls Win Big: Overbought Conditions Return – The Market Breadth”