Stock Market Commentary:
The stock market threw a big fakeout, the biggest I have seen in a long time. Just yesterday, a synchronized failure at key resistance levels from the major indices combined with a drop from overbought conditions to convince me to get (cautiously) bearish on the stock market. The read on July CPI (consumer price index) had other ideas. “Consensus” expected 8.7% and the inflation gods delivered a “surprise” of 8.5% (core was 5.9%). That was enough for the the stock market to resume its bullish behavior with a jump back into overbought trading conditions. Moreover, two of the three major indices punched through the key resistance that just looked solid. Needless to say, I did not expect that such a minor surprise could generate such a major response. The peak inflation narrative has already been strong since the readout on the May and June CPIs. So the market’s celebration makes little sense in that context. However, I do not want to join the incredulous bears with the market refueling its engines so convincingly.
The Stock Market Indices
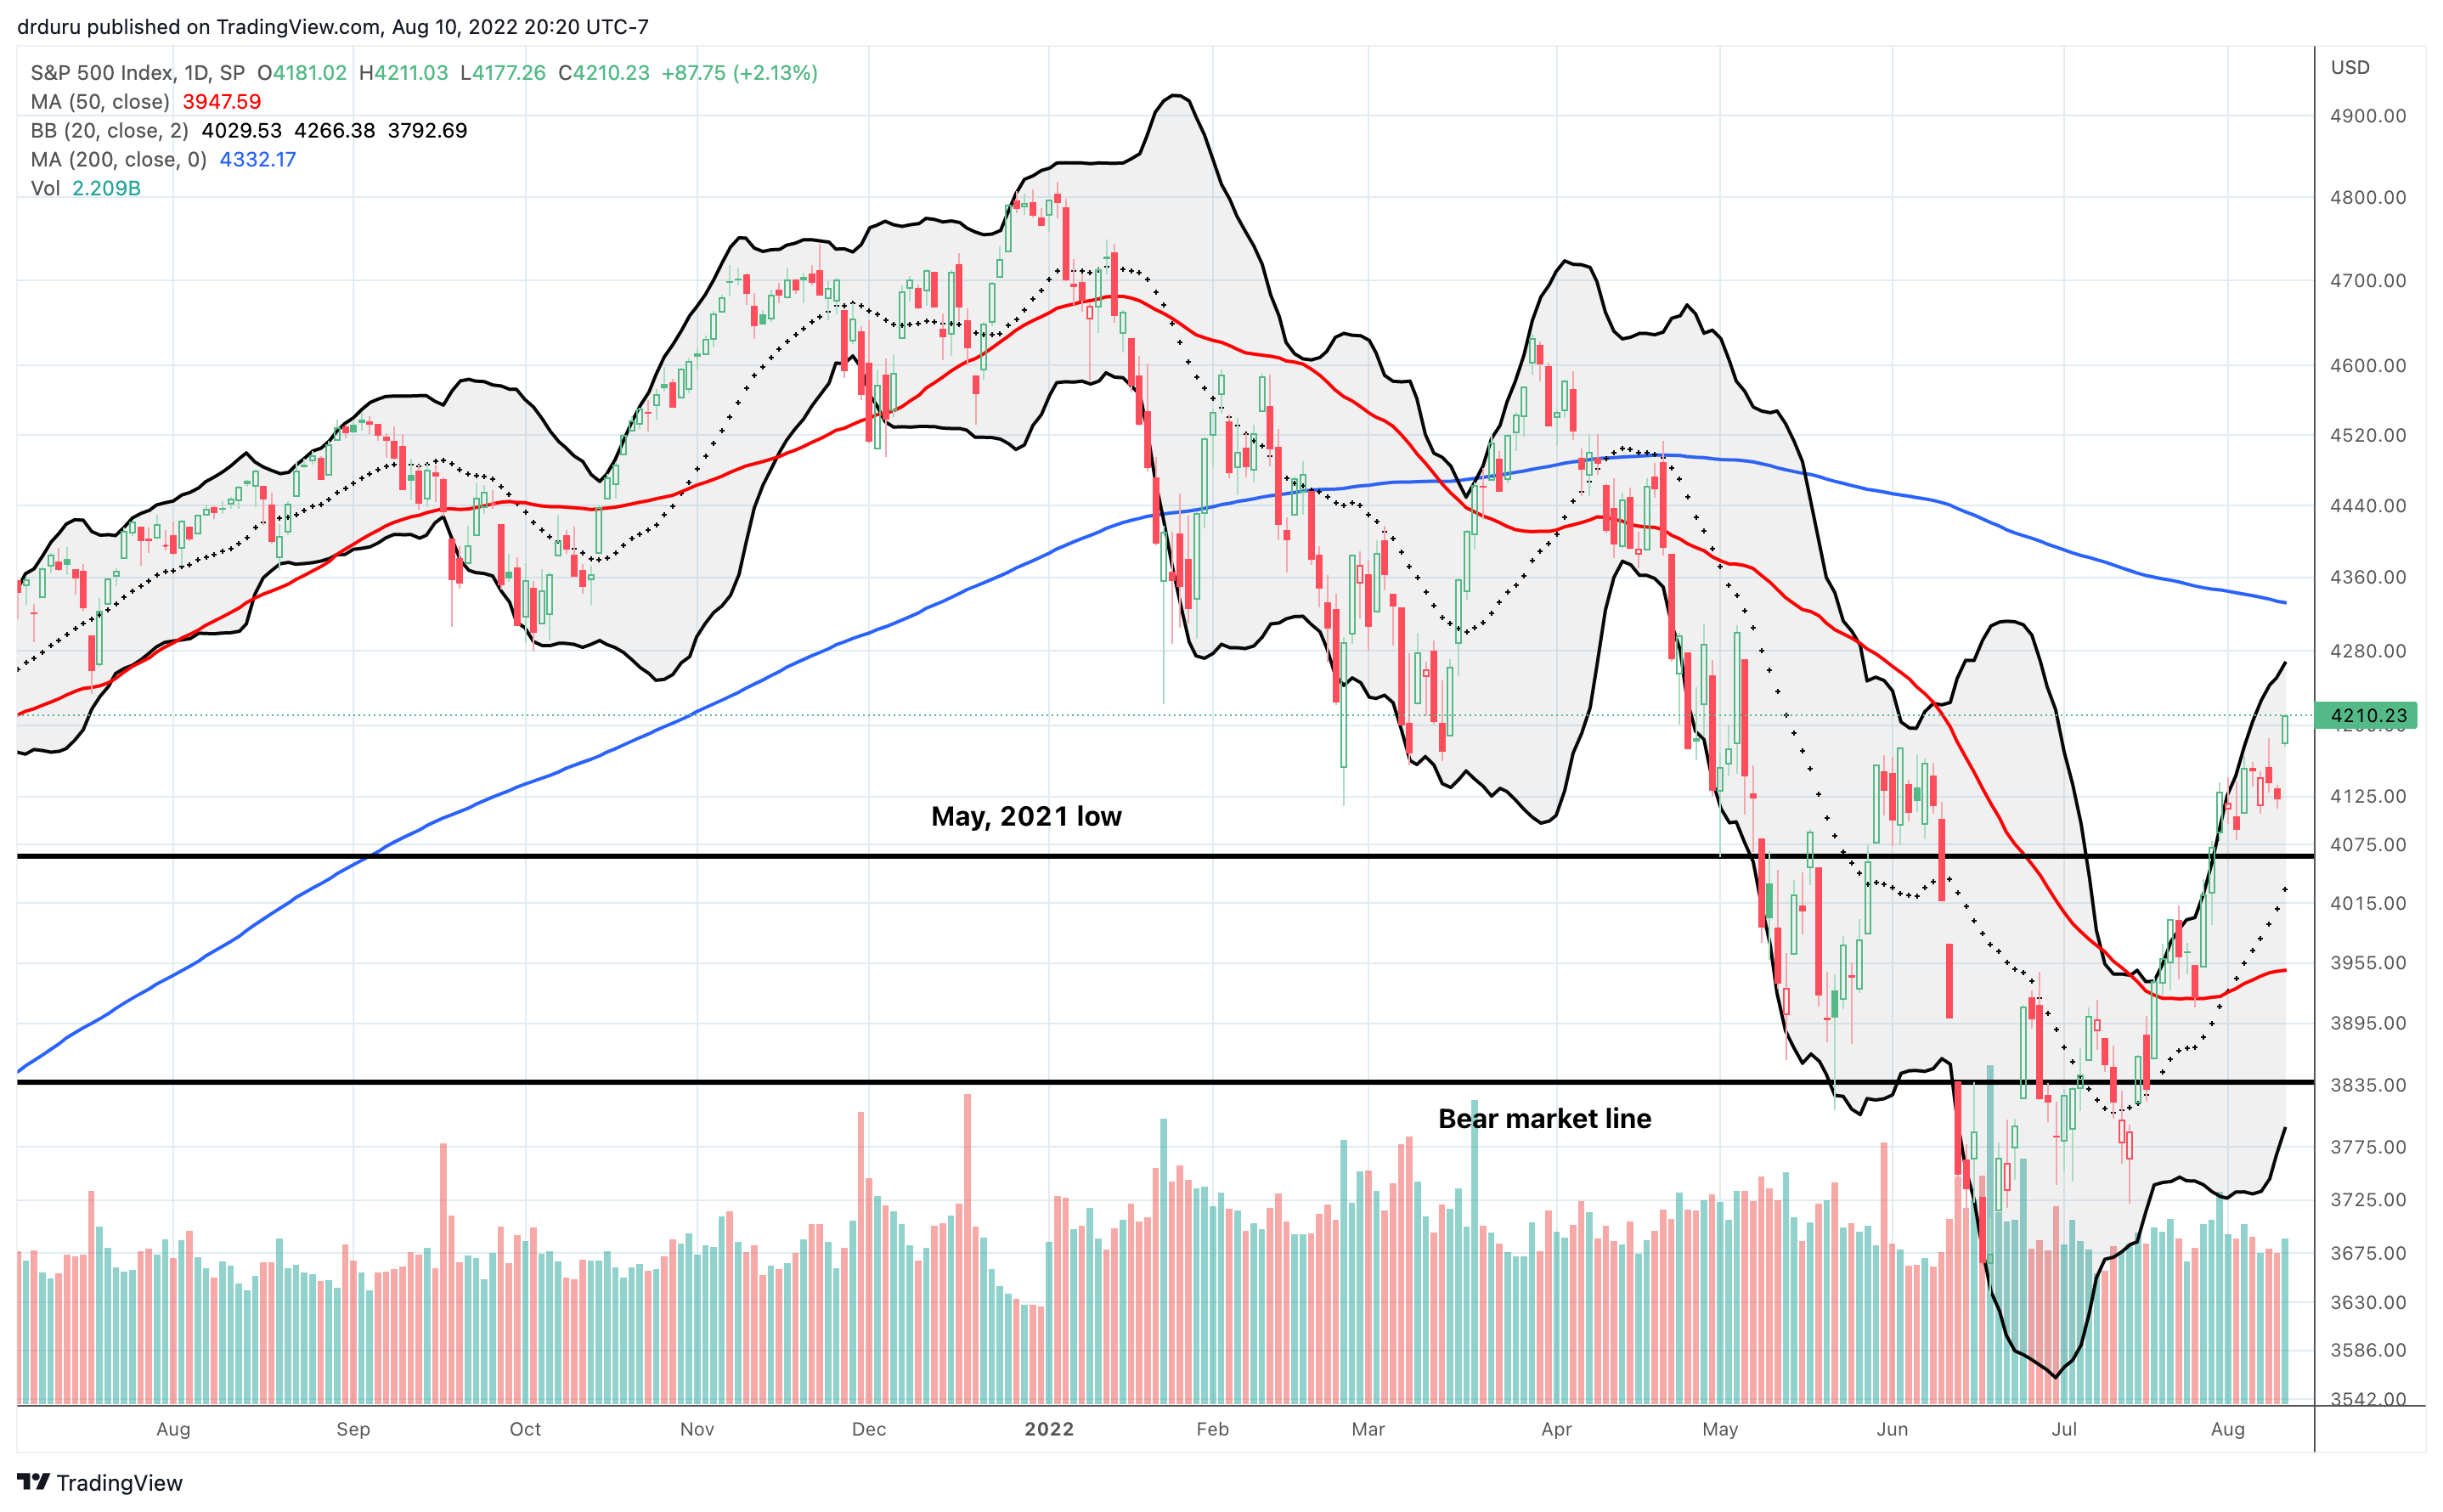
The S&P 500 (SPY) surged 2.1% and finally cleared resistance from the June highs. The index is now up 1.9% since the end of April (again, so much for sell in May), and it looks poised to challenge resistance from its 200-day moving average (DMA) (the blue line below). The entire period of former churn looks like a big fakeout. The S&P 500’s breakout from this churn is just as significant as the index’s breakdown from the churn that formed resistance at the June highs.
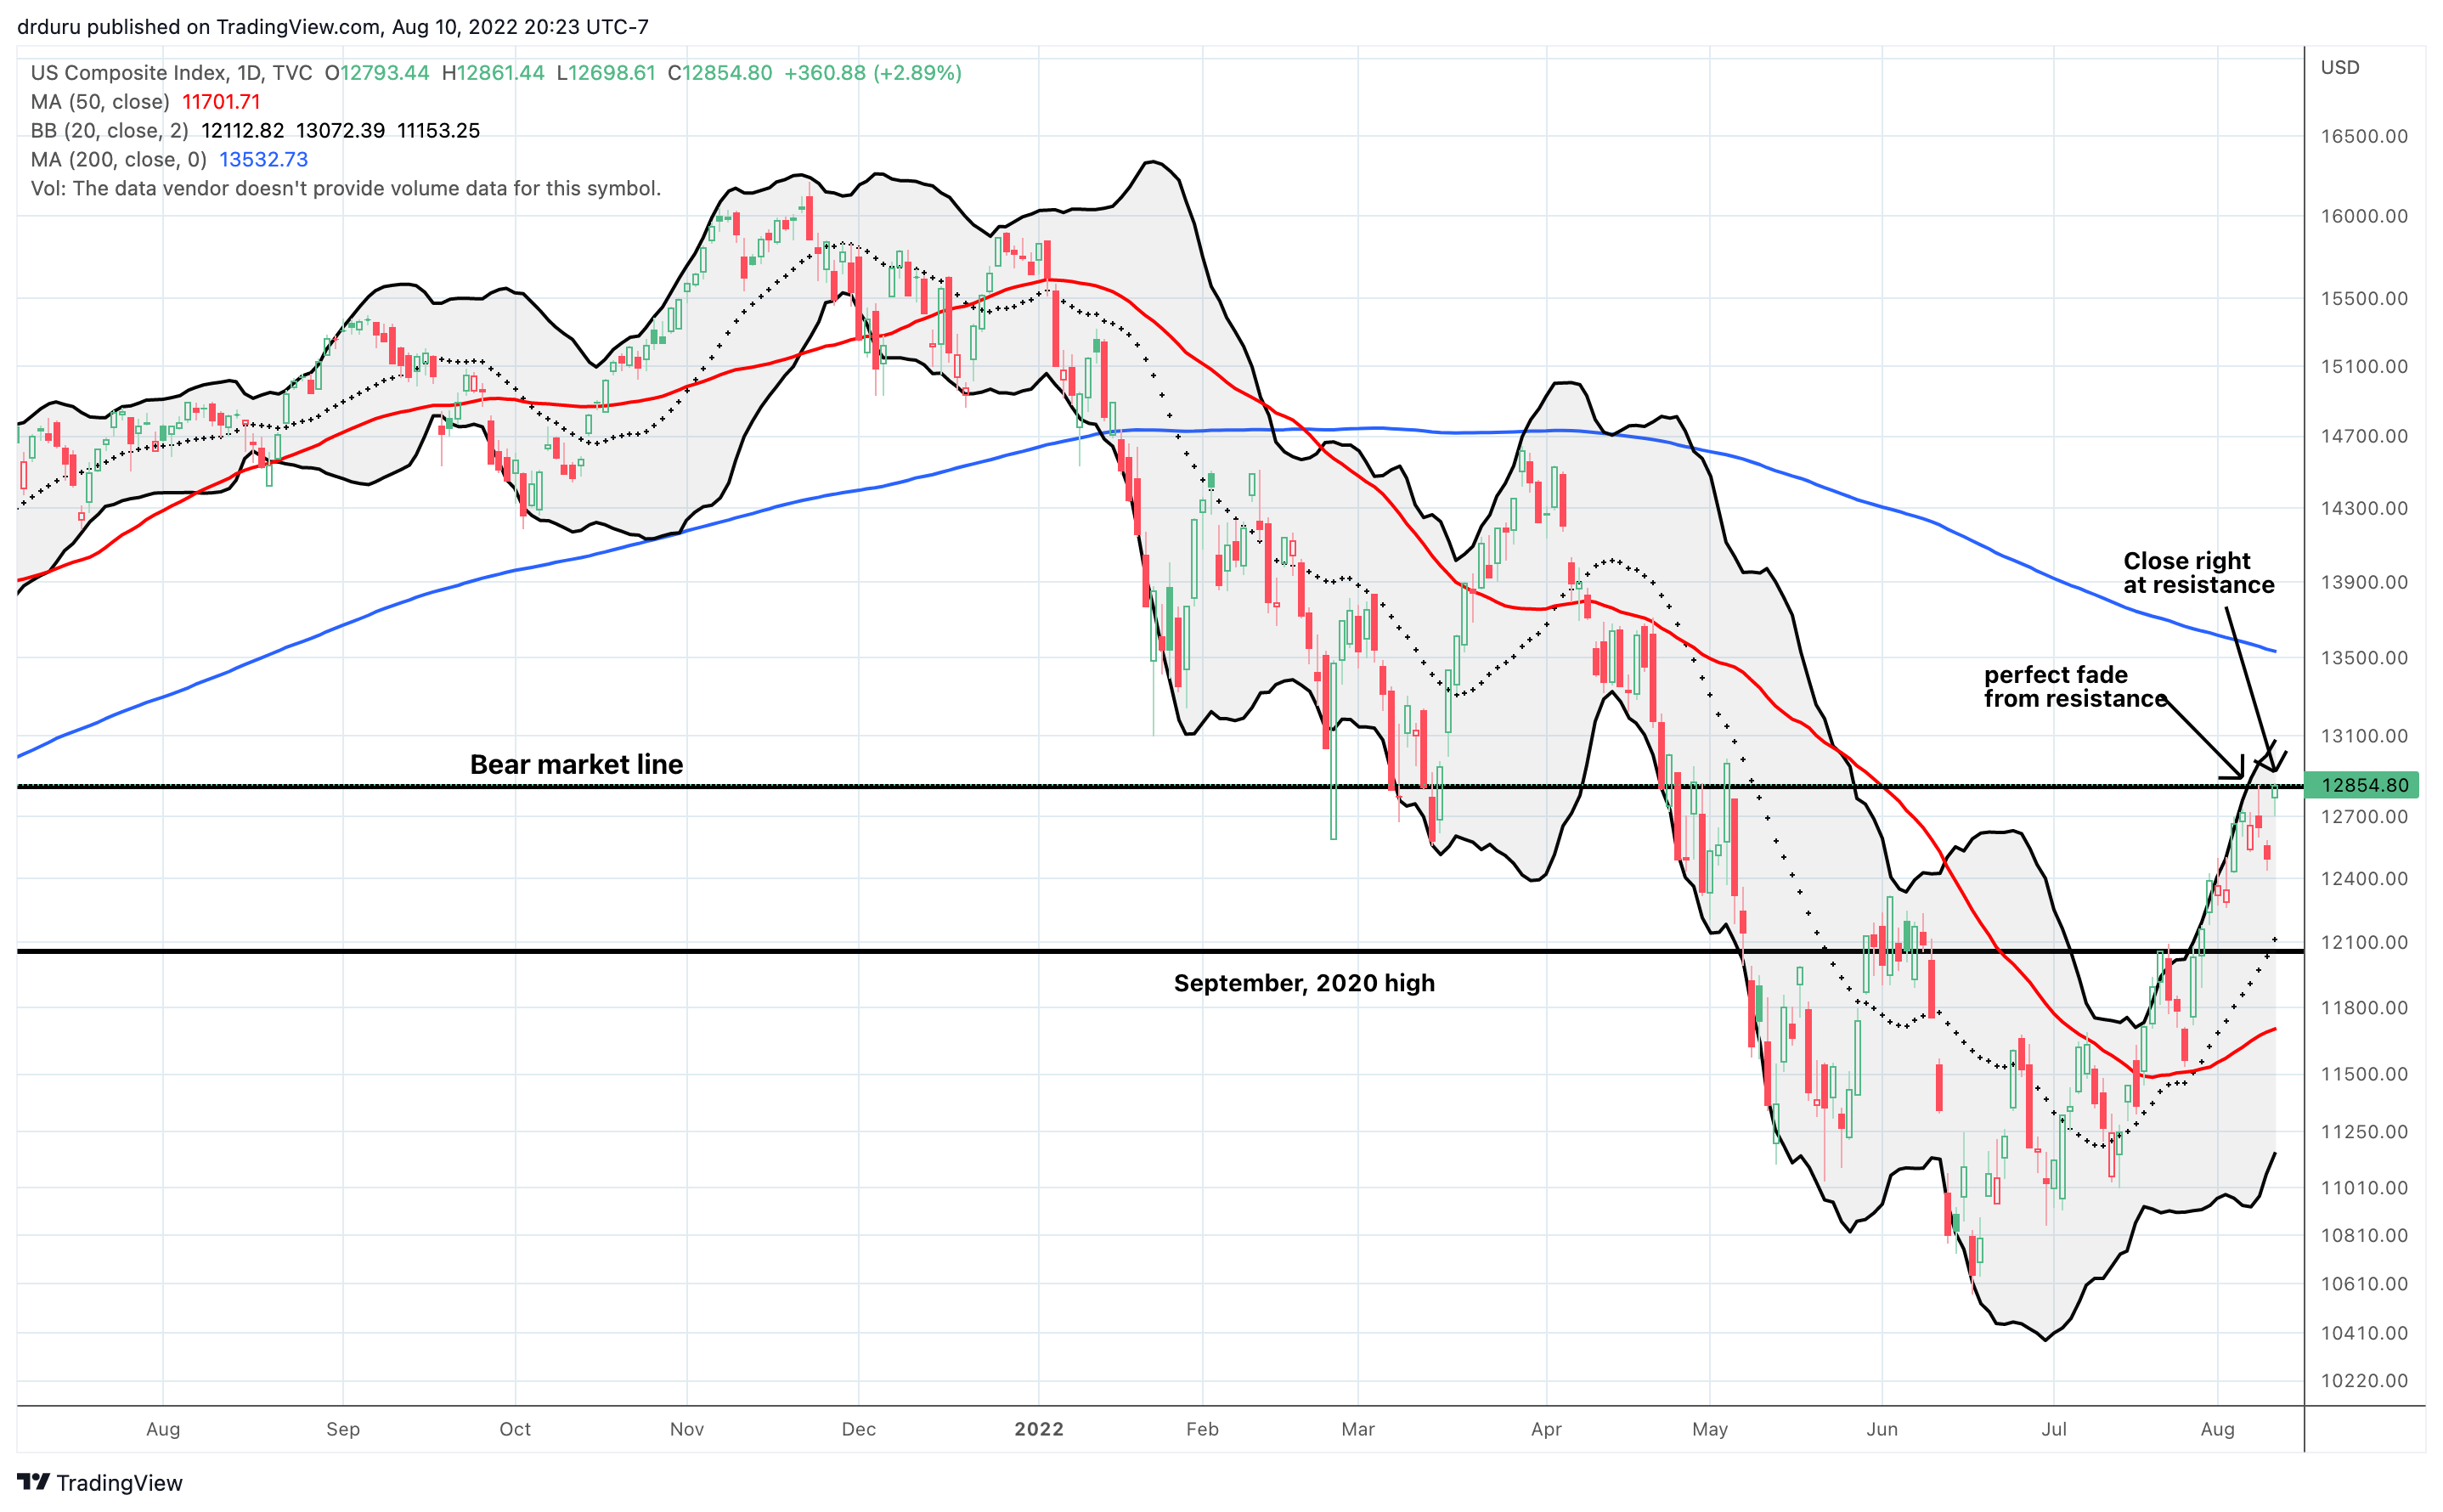
The NASDAQ (COMPQ) also had an impressive move with a 2.9% gain. However, the tech laden index did not quite bring its bear market to an end. Accordingly, the NASDAQ still needs one more up day to solidify the return of bullish technicals.

The iShares Russell 2000 ETF (IWM) joined the S&P 500 in clearing a major hurdle with a notable fakeout. The bear market ended for the ETF of small caps with a 2.9% gain just one day after a 1.4% loss seemed to confirm the survival of the bear market. Resistance from the downtrending 200DMA now looms directly overhead.
Stock Market Volatility
The volatility index (VIX) was a key tell all along. The earlier bearish signals never roused the VIX, and it continued to look “heavy.” The VIX followed through with a clean slice through the 20 level that defines “elevated” volatility. The volatility index is no longer elevated and is poised to continue supporting a market rally. The next stop/test will be the old 15.35 pivot.
The Short-Term Trading Call With A Big Fakeout
- AT50 (MMFI) = 76.0% of stocks are trading above their respective 50-day moving averages (overbought day #1)
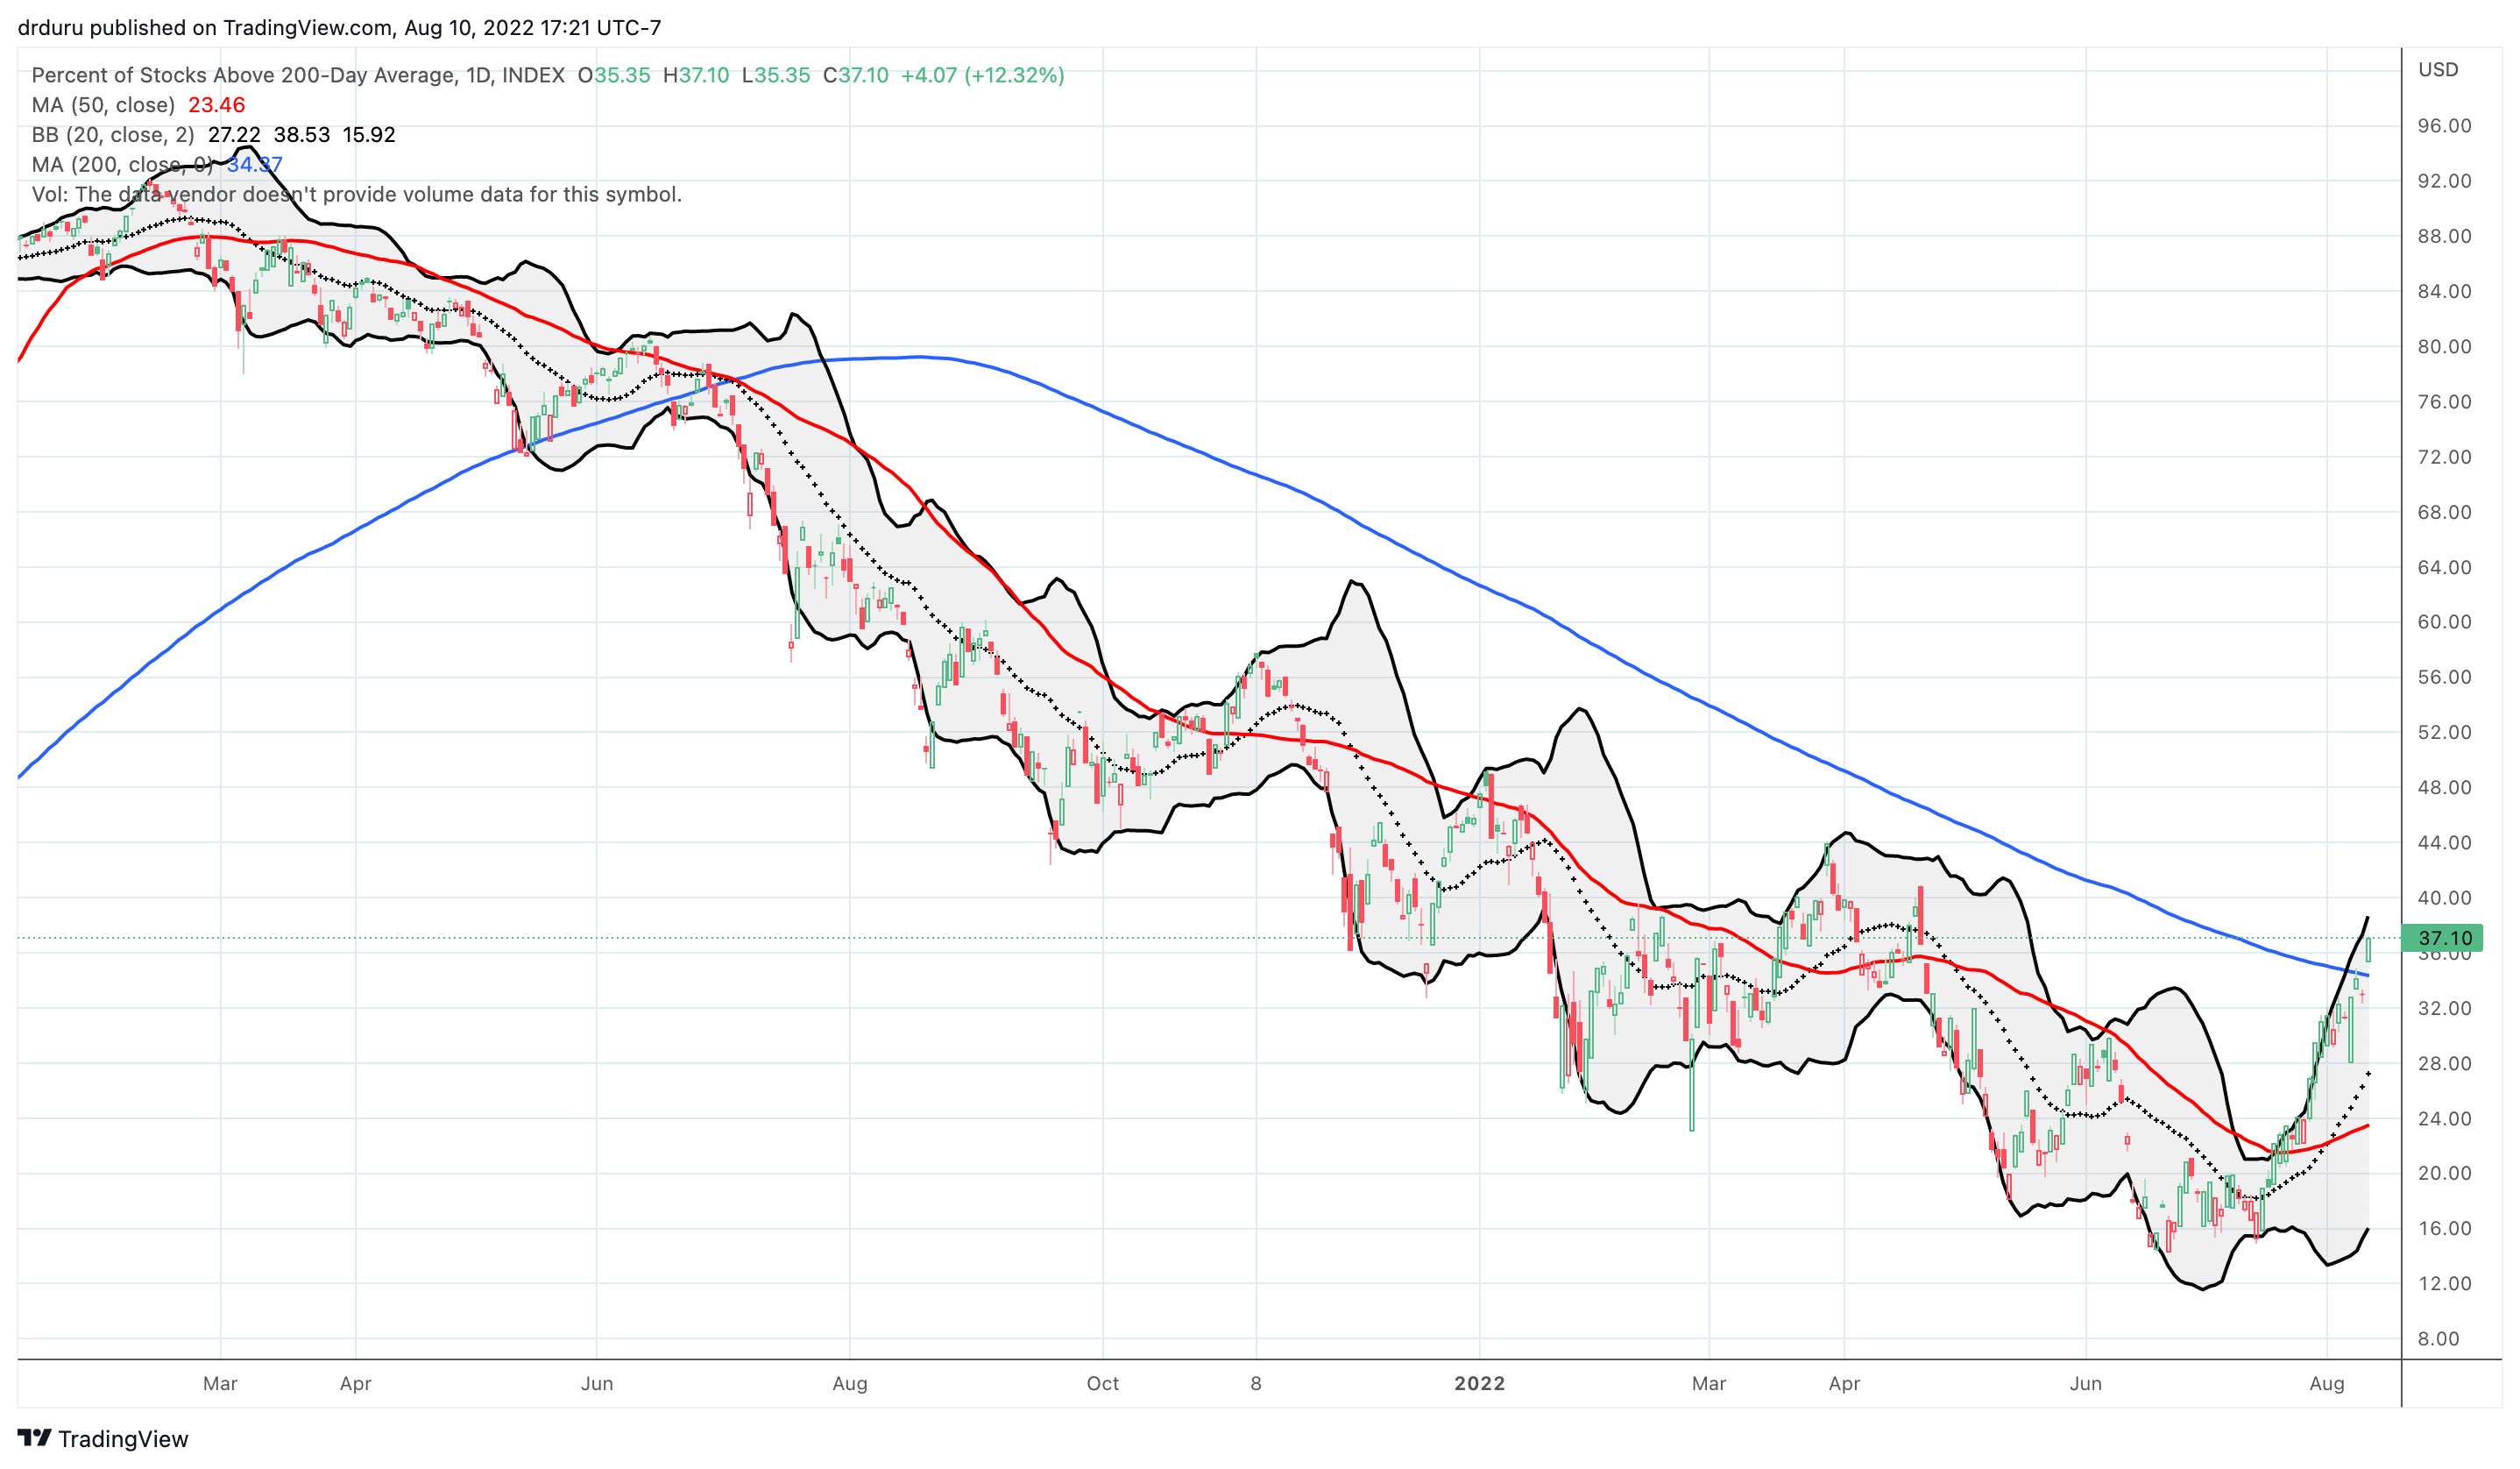
- AT200 (MMTH) = 37.2% of stocks are trading above their respective 200-day moving averages
- Short-term Trading Call: neutral
AT50 (MMFI), the percentage of stocks trading above their respective 50DMAs, reversed course with a quickness. The 76.0% close solidly replanted my favorite technical indicator in overbought territory. Per the AT50 trading rules, I cannot remain bearish. While I hate churning the short-term trading call, I hate fighting the market even more. The bear market ended for IWM, the S&P 500 broke out well above its resistance from June highs, and the VIX transitioned out of elevated levels. Accordingly, I returned to a neutral stance. Given yesterday’s fakeout, I will not flip bearish until the stock market confirms the next bearish signal: either an end to overbought trading conditions and/or a blow-off top. In the meantime, the stock market suddenly has a LOT more room to soar for an extended overbought rally, especially once the NASDAQ ends its bear market.

Be careful out there!
Footnotes
“Above the 50” (AT50) uses the percentage of stocks trading above their respective 50-day moving averages (DMAs) to measure breadth in the stock market. Breadth defines the distribution of participation in a rally or sell-off. As a result, AT50 identifies extremes in market sentiment that are likely to reverse. Above the 50 is my alternative name for “MMFI” which is a symbol TradingView.com and other chart vendors use for this breadth indicator. Learn more about AT50 on my Market Breadth Resource Page. AT200, or MMTH, measures the percentage of stocks trading above their respective 200DMAs.
Active AT50 (MMFI) periods: Day #27 over 20%, Day #21 over 30%, Day #14 over 40%, Day #14 over 50%, Day #8 over 60%, Day #1 over 70% (overbought day #1 ending 1 day under 70%)
Source for charts unless otherwise noted: TradingView.com
Full disclosure: no positions
FOLLOW Dr. Duru’s commentary on financial markets via StockTwits, Twitter, and even Instagram!
*Charting notes: Stock prices are not adjusted for dividends. Candlestick charts use hollow bodies: open candles indicate a close higher than the open, filled candles indicate an open higher than the close.


You said a few months ago you thought this was market looking for good news…..seems you were right with the big jump based on small decrease in inflation.
You’re correct. Great memory!
Still, back then, I would not have anticipated such a big reaction to such a small bit of good news. The market is really reaching and extrapolating to a LOT of good news ahead.
Equity markets tank usually after the fourth or fifth rate hike.Your comment to be careful out there is particularly valid in the near term!
Interesting data point. Where did you source that? Or can you send the analysis you did?