Stock Market Commentary:
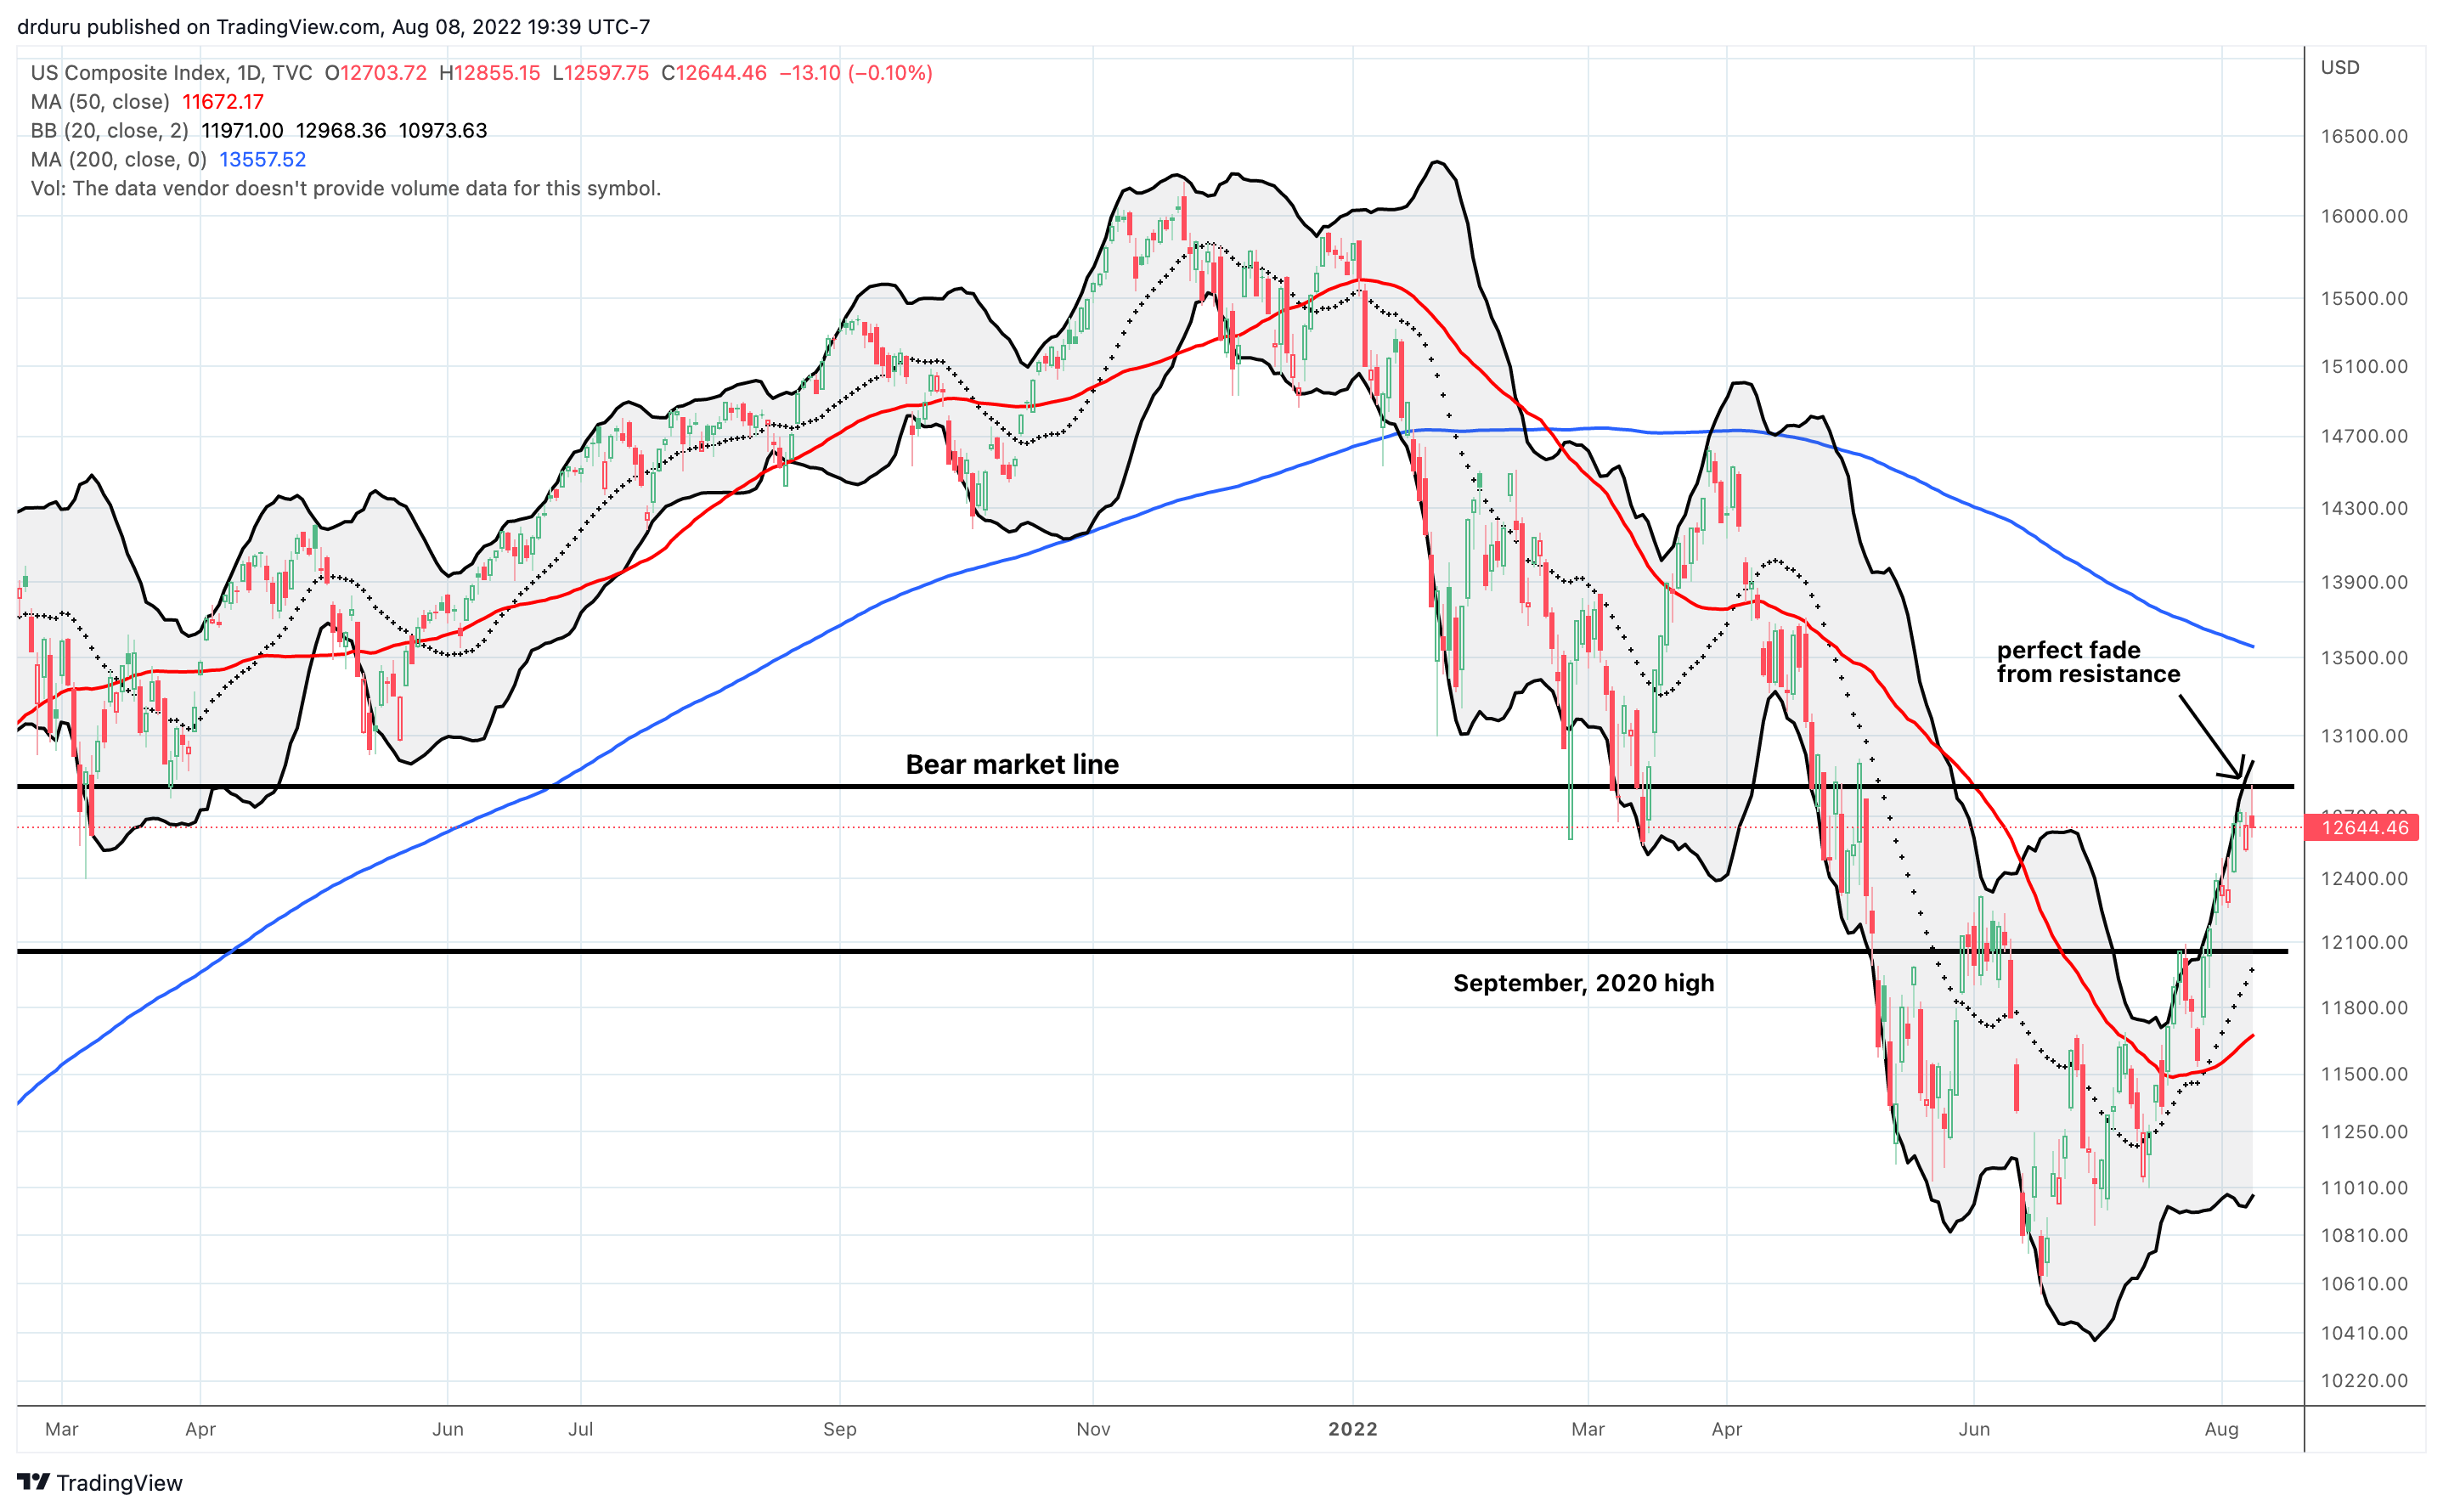
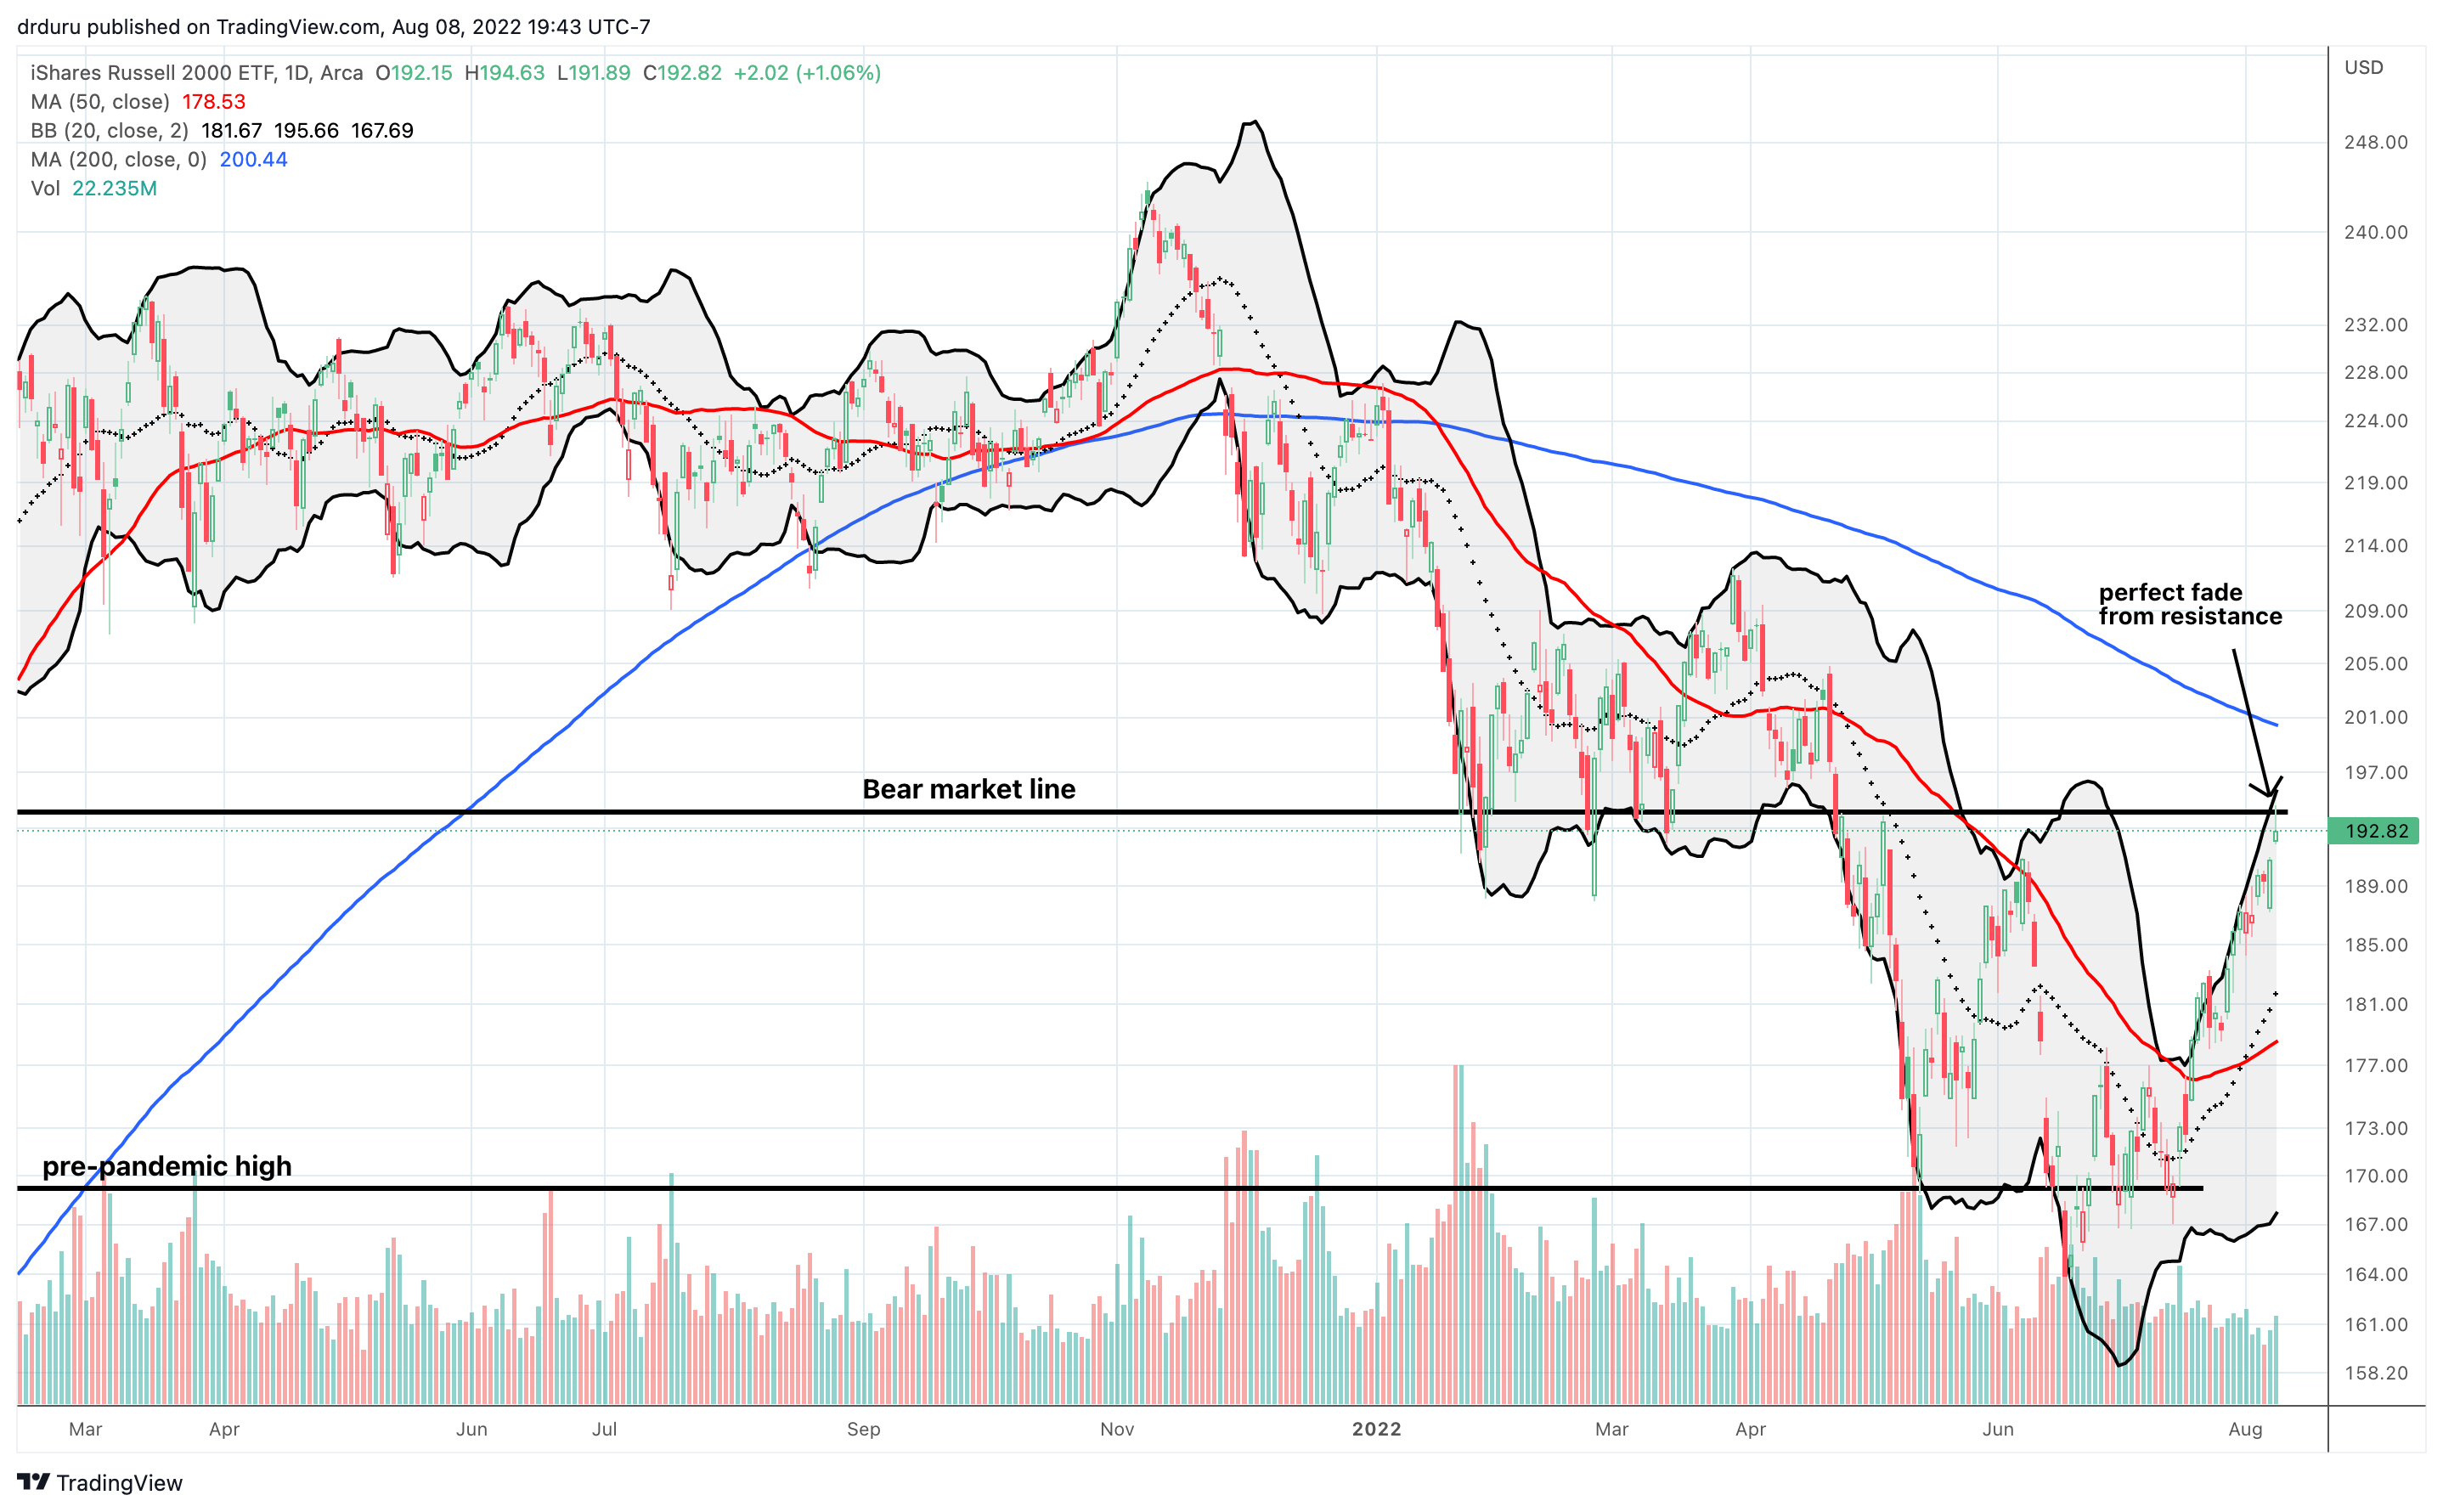
The suspense at the overbought threshold ended without resolution. In a surprising, and even bizarre, display of performance divergence, small caps led the way higher while the S&P 500 and the NASDAQ ended the day flat. Moreover, IWM and the NASDAQ faded from important resistance at their bear market lines. Additionally, the S&P 500 faded at resistance from its June highs. So while the stock market closed in overbought territory, the market did not provide reassurance or confirmation that it can launch into an extended overbought rally.
The Stock Market Indices
The S&P 500 (SPY) faded to a flat close and left the market without resolution. The June highs continue to loom as important resistance for the index.
The NASDAQ (COMPQ) generated an even bigger disappointment by fading from resistance at its bear market line. The fade back to flat left the stock market without resolution from the tech side. However, sellers DID highlight the specter of a notable pullback following this critical failure.

The iShares Russell 2000 ETF (IWM) left traders in suspense right at the June high on Friday. IWM resolved that suspense only to fade from resistance at its bear market line. I am looking to take profits on my IWM call spread. The ETF of small caps looks more vulnerable to a pullback from here.

Stock Market Volatility
The volatility index (VIX) rebounded tepidly with a 0.7% gain. The VIX left the market without resolution of a presumed imminent test of the 20 level.
The Short-Term Trading Call Without Resolution
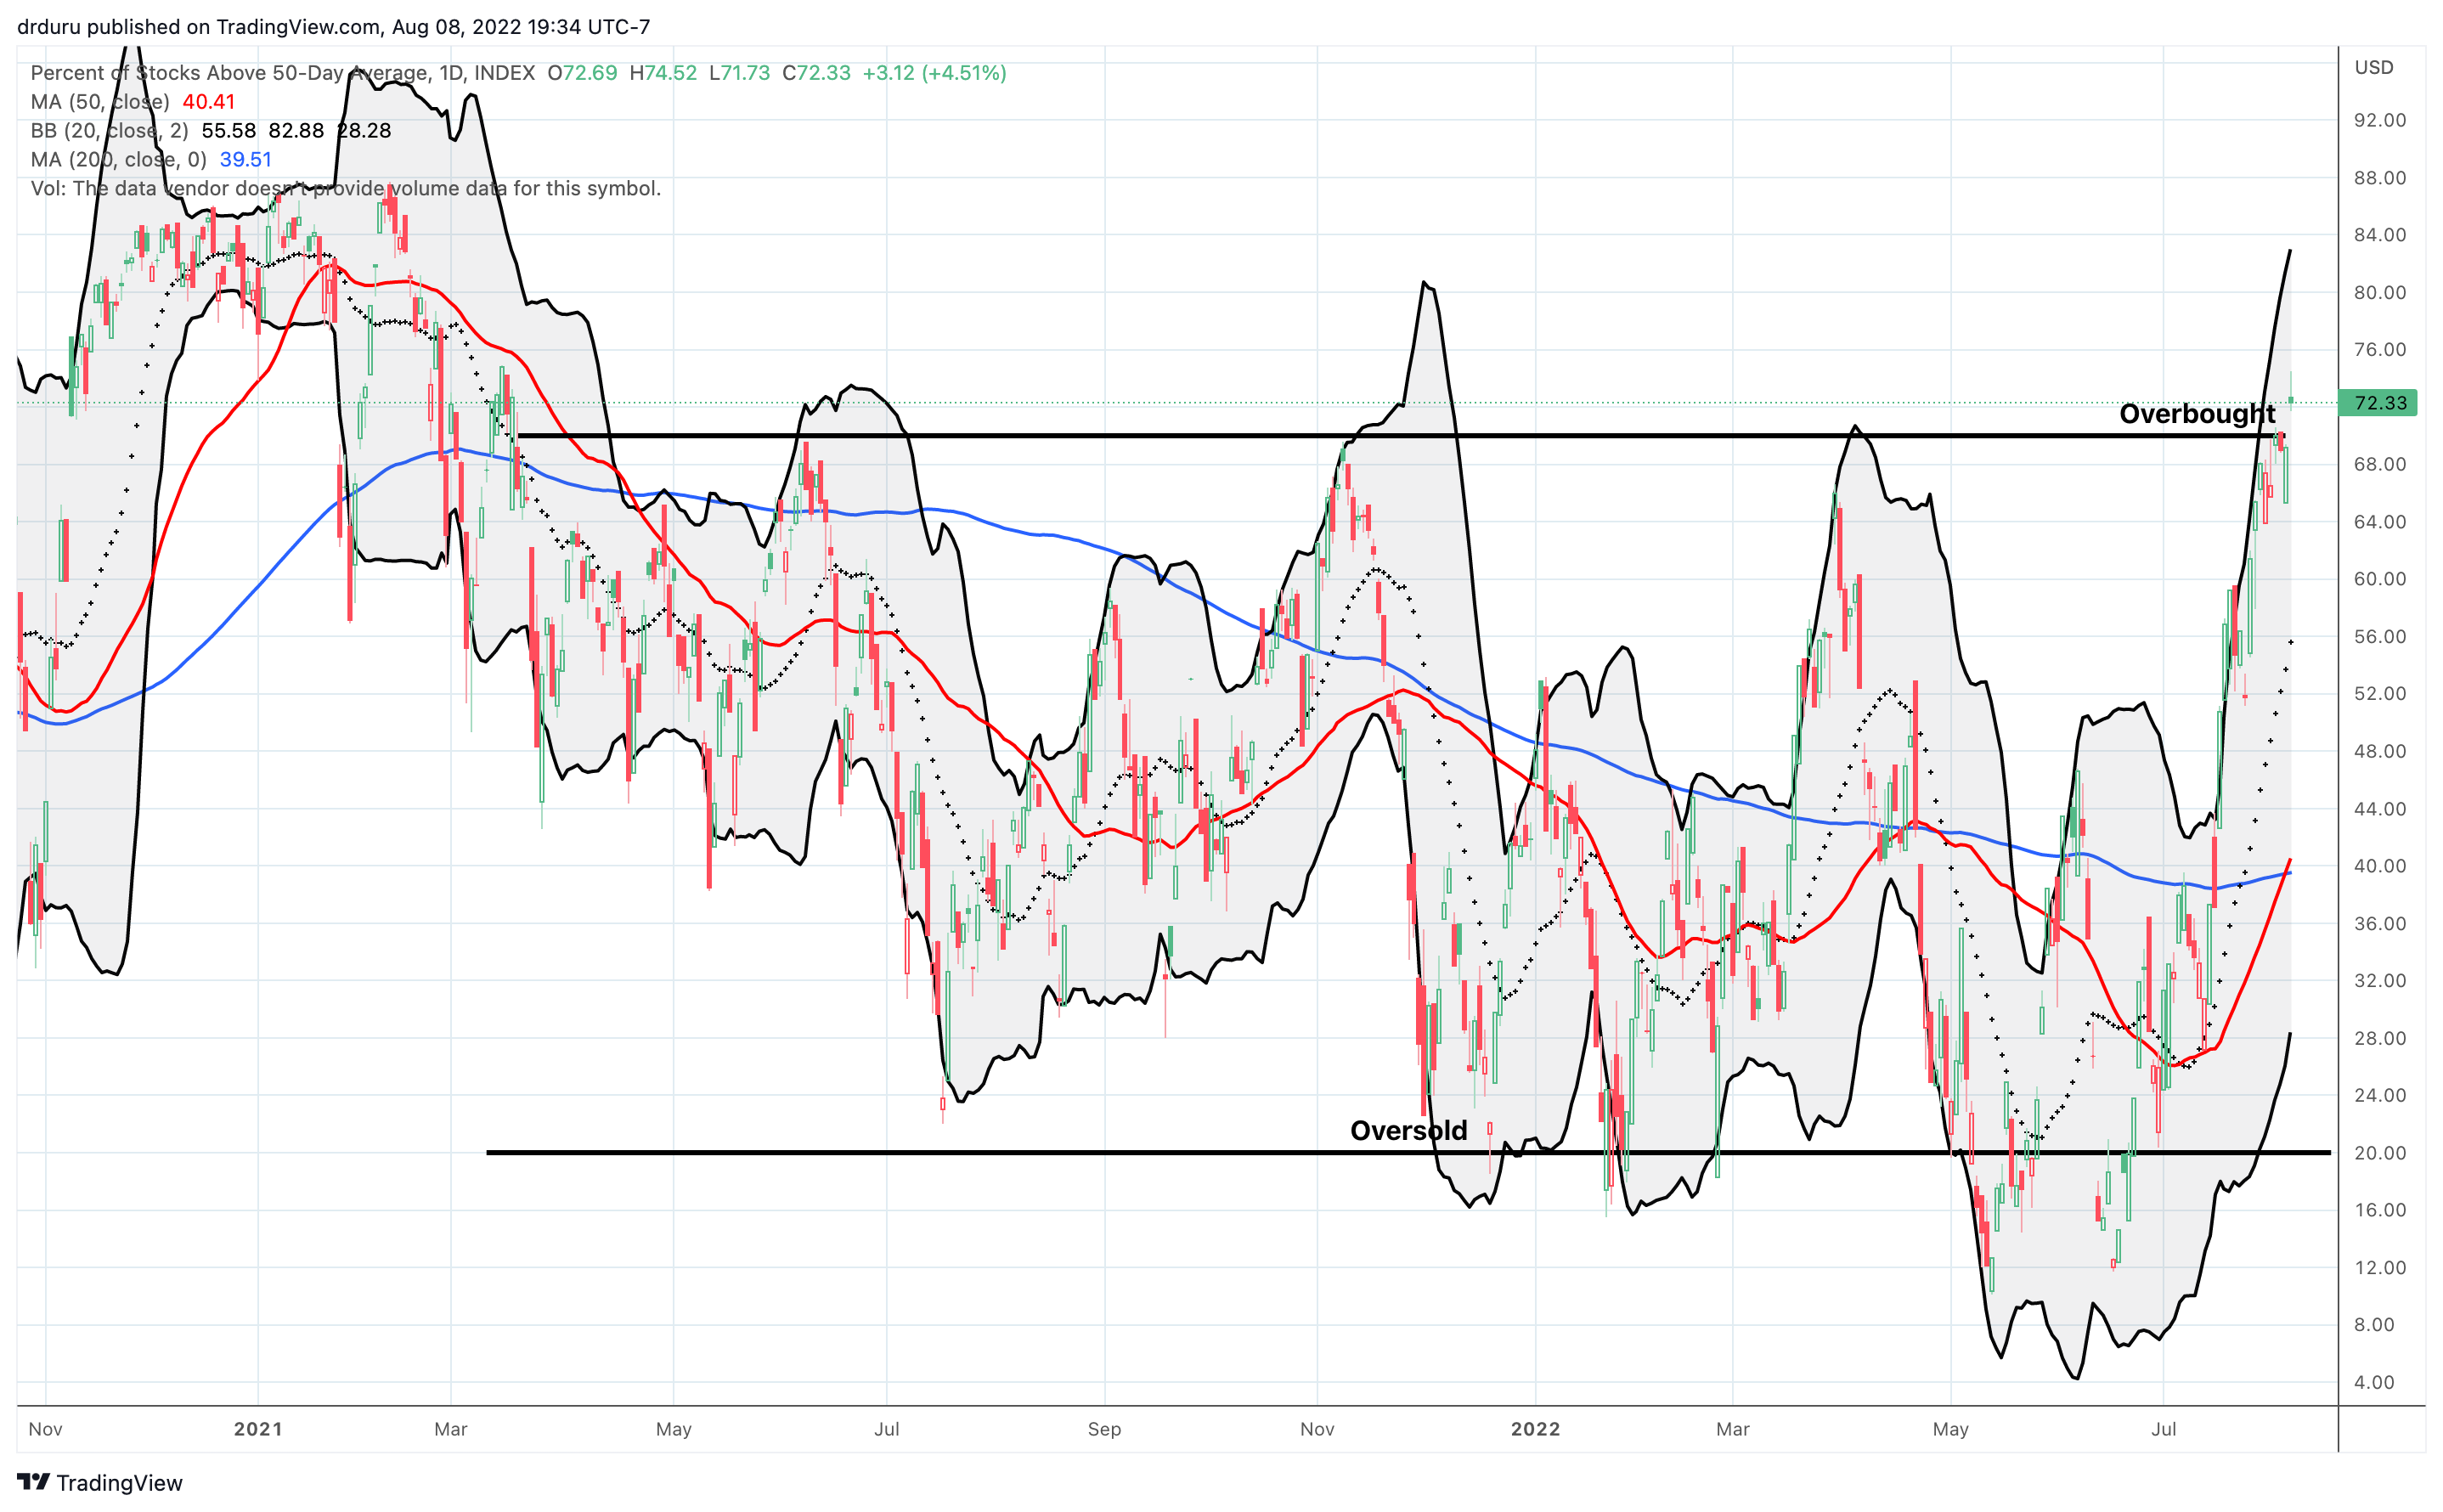
- AT50 (MMFI) = 72.3% of stocks are trading above their respective 50-day moving averages (overbought day #1)
- AT200 (MMTH) = 34.2% of stocks are trading above their respective 200-day moving averages
- Short-term Trading Call: neutral
AT50 (MMFI), the percentage of stocks trading above their respective 50DMAs, finally closed in overbought territory after 356 trading days. My favorite technical indicator held overbought trading conditions despite fading with the stock market. The move in IWM looks like the prime driver for this milestone. While AT50’s punch higher resolved the suspense from Friday, the move still left the market without resolution. No buy signal is possible with all three indices fading from important resistance levels. No short/sell signal is possible until AT50 drops out of overbought conditions (per the AT50 trading rules).
Technician Carter Braxton Worth of Worth Charting has a more optimistic interpretation of the trading action for IWM. His pairs trade proposal is interesting given IWM’s breakout in relative performance. Still, I would not trigger it until IWM cleared resistance at its bear market line and/or I would weight the trade toward SPY put options.
Be careful out there!
Footnotes
“Above the 50” (AT50) uses the percentage of stocks trading above their respective 50-day moving averages (DMAs) to measure breadth in the stock market. Breadth defines the distribution of participation in a rally or sell-off. As a result, AT50 identifies extremes in market sentiment that are likely to reverse. Above the 50 is my alternative name for “MMFI” which is a symbol TradingView.com and other chart vendors use for this breadth indicator. Learn more about AT50 on my Market Breadth Resource Page. AT200, or MMTH, measures the percentage of stocks trading above their respective 200DMAs.
Active AT50 (MMFI) periods: Day #25 over 20%, Day #19 over 30%, Day #12 over 40%, Day #12 over 50%, Day #6 over 60%, Day #1 over 70% (ending 355 days under 70%)
Source for charts unless otherwise noted: TradingView.com
Full disclosure: long IWM call spread, long QQQ puts
FOLLOW Dr. Duru’s commentary on financial markets via StockTwits, Twitter, and even Instagram!
*Charting notes: Stock prices are not adjusted for dividends. Candlestick charts use hollow bodies: open candles indicate a close higher than the open, filled candles indicate an open higher than the close.


This situation looks simple to me: large-cap ETFs are being sold to fund buying the small caps that will benefit from passage of the IRA.
And it’s looking like an algorithmic blip right now.