
Stock Market Commentary
The S&P 500 (SPY) is a key driver of the stock market’s most predictable pattern. The index’s relentless rise this year has held the majority of the trading action above the 20-day moving average (DMA) (the dotted line in the chart below). Brief dips below the 20DMA set up tests of the uptrending 50DMA (the red line below). Time after time buyers made their stand at the 50DMA. This behavior forms the core of the stock market’s most predictable pattern. After a rare (for 2021) 6 trading days below the 20DMA, buyers face yet one more moment to demonstrate the predictability of this uptrend. An upcoming Federal Reserve meeting provides this week’s biggest catalyst.
The Stock Market Indices
While the S&P 500 remains comfortably tucked into an uptrend, the index has spent most of September drifting downward. The troubles for Apple (AAPL) helped to change the tenor of the trading. Yet, last week, the predictability of 50DMA support played out on an intraday basis. Buyers bought the S&P 500 off 50DMA support for two days before sellers were finally able to crack the trendline by a hair’s margin. Every trader and investor paying attention to the stock market will surely closely watch this test of the market’s most predictable pattern. I have no interest in joining this game until the index closes above its 20DMA….or the stock market finally drops into oversold trading conditions.
The NASDAQ (COMPQX) somewhat stabilized just below its 20DMA. Long dips below the 50DMA make the tech-laden index less predictable than the S&P 500. Still, a coming test of 50DMA support will likely generate a lot of fresh buying interest.
The iShares Trust Russell 2000 Index ETF (IWM) had a bad day on Tuesday, including a 50DMA breakdown. Buyers took over from there and held IWM firm above its 50DMA. The pivoting around the 50DMA continues.
Stock Market Volatility
The volatility index (VIX) has also delivered a predictable pattern. Faders have tightly contained every surge in the VIX. Swells of fear sometimes last as short as 1 to 2 days. However, very subtly, the VIX overall looks like it is stabilizing. Over the last 3 months, the VIX has held the 15-16 range as support. The three surges before the current one have produced a pattern close to higher highs. The current surge is holding 18 as support. In other words, the VIX looks like it wants to serve as a launchpad for the stock market’s most dangerous months.
The Short-Term Trading Call With Apple’s big loss
- AT50 (MMFI) = 43.7% of stocks are trading above their respective 50-day moving averages
- AT200 (MMTH) = 49.4% of stocks are trading above their respective 200-day moving averages
- Short-term Trading Call: neutral
Although the S&P 500 is finally showing some weakness, the market breadth indicators stopped their descent. AT50 (MMFI), the percentage of stocks trading above their respective 50DMAs, dropped below 40% for a day and then rebounded. The resulting resilience worked counter to the dribbling weakness in the S&P 500. This divide is not quite a bullish divergence, but I find myself “intrigued.” If AT50 continues higher from here, suddenly, my favorite technical indicator looks like it is making higher lows. Such momentum will greatly reduce the odds for the most dangerous months of the year fulfilling their historical pattern.
AT200 (MMTH), the percentage of stocks trading above their respective 200DMAs, is still making lower lows. The drop in this longer-term indicator of market breadth is fully bearish and fully counters the lift in AT50. My vote stays with AT200 providing on-going drag for AT50.
Stock Chart Video Review
Stock Chart Reviews – Below the 50DMA
iShares MSCI Brazil ETF (EWZ)
The iShares MSCI Brazil ETF (EWZ) closed the week with a 20% correction from its last high. That milestone triggered my rule on buying 20% pullbacks on EWZ. The trigger last fired in March and created a golden profit opportunity. EWZ held 200DMA support (the blue line below) and rallied for 3 months. THIS time looks a lot more tricky: EWZ lost 2.8% on a gap down that further confirms 200DMA resistance. Still, I prefer to execute rules than find excuses for exceptions. I will add more shares if EWZ tests the March lows.
Nucor Corporation (NUE)
Four months have passed since I fretted that a steep run-up in Nucor Corporation (NUE) would lead to selling around the $100 level. NUE got as high as $110 before pulling back and is trading below $100 again. Now, NUE is on a September slide that includes two 50DMA breakdowns. I will be watching for a test of the July lows and/or 200DMA support for a new opportunity to nibble my way back into a position.
Zoom Video Communications, Inc (ZM)
The bottoming in Zoom Video Communications, Inc (ZM) failed quickly with trading in ZM opening the week with a 3.7% loss and a close right at the post-earnings lows. I reversed myself and jumped into put options to ride the new momentum. I took profits as ZM tested the intraday low from May. Almost predictably, buyers stepped in to defend that support. I switched again to long with a small number of shares with a hard stop below the bottoming hammer.
HyreCar Inc. (HYRE)
Web-based car-sharing marketplace HyreCar Inc. (HYRE) is struggling. A massive 48.5% post-earnings loss in August created a convincing 200DMA breakdown. Apparently, the company shocked investors by shifting to a more capital intensive business model. Bargain hunters managed to make a run back to 200DMA resistance that in turn became too much to resist for investors eager to abandon the ride. Now, HYRE is testing the August lows. A break of the lows creates a fresh short-selling opportunity. A close above $10.50 sets up a fresh run to 200DMA resistance…which is ominously converging with 50DMA resistance.
Twitter (TWTR)
I did my semi-regular check on Twitter (TWTR) looking for a new entry point to buy. The hold at 200DMA support looks interesting. However, with 50DMA resistance looming directly overhead, I prefer to stay patient. A confirmed 50DMA breakout is an automatic buy for me.
FedEx Corporation (FDX)
FEdEx Corporation (FDX) spent the first half of this year enjoying the support of value traders and investors. The gears suddenly jammed at the highs in May. A 200DMA breakdown in August led to a confirmation of 200DMA resistance and now FDX is fully trapped in a bearish downtrend. I am looking to fade the next bounce in FDX with a potential (and tight!) stop above the 20DMA.
Martin Marietta Materials, Inc (MLM)
The buzz over the last infrastructure deal in Washington D.C. officially came to an end last week. Martin Marietta Materials (MLM) lost 3.1% and plunged well below its lower Bollinger Band (BB). MLM ended the week precariously hovering above 200DMA support and closing well below the pop from the infrastructure deal. I am watching closely for the stock’s reaction at support, especially because of the close alignment with support from the June and July lows. It is possible Friday’s intraday low was “close enough” to a 200DMA test, so I am inclined to buy into a bounce and stop out below the 200DMA. I am not interested in shorting such a valuable company.
Stock Chart Reviews – Above the 50DMA
Netflix, Inc. (NFLX)
On August 19th, Netflix (NFLX) surged 4.2% off converged support at its 50 and 200DMAs. The high-volume buying set off a run-up to a long awaited breakout above a 14-month trading range. That move is very bullish, so I like buying into the current pullback. My stop-loss will sit below the recent low and below the 20DMA.
Spotify Technology (SPOT)
The setup on Spotify Technology (SPOT) far surpassed my expectations. As the stock soared right through a 50DMA breakout, SPOT’s 6.6% surge made me expect a test of 200DMA resistance in short order. Two trading days later, KeyBanc upgraded SPOT and boosted it with a juicy $340 price target. Surprisingly, sellers completely faded the initial excitement. When SPOT breached the intraday low from the 50DMA breakout, I took profits on my position. Friday’s 2.5% jump makes SPOT look ready to run again. However, I am not in a rush to jump back in: I must be leery about a poor response to an extremely bullish upgrade.
Schlumberger (SLB)
Oil services company Shlumberger (SLB) looks like it is setting up again. SLB gained 5.7% on a 50DMA breakout, but buyers failed to confirm the move with a higher close. In fact, sellers completely reversed the move with a brief test of converged 20 and 200DMA support. SLB now looks like a coiled spring that just needs a close above the double resistance just above $29. Such a move could launch SLB on a healthy rally.
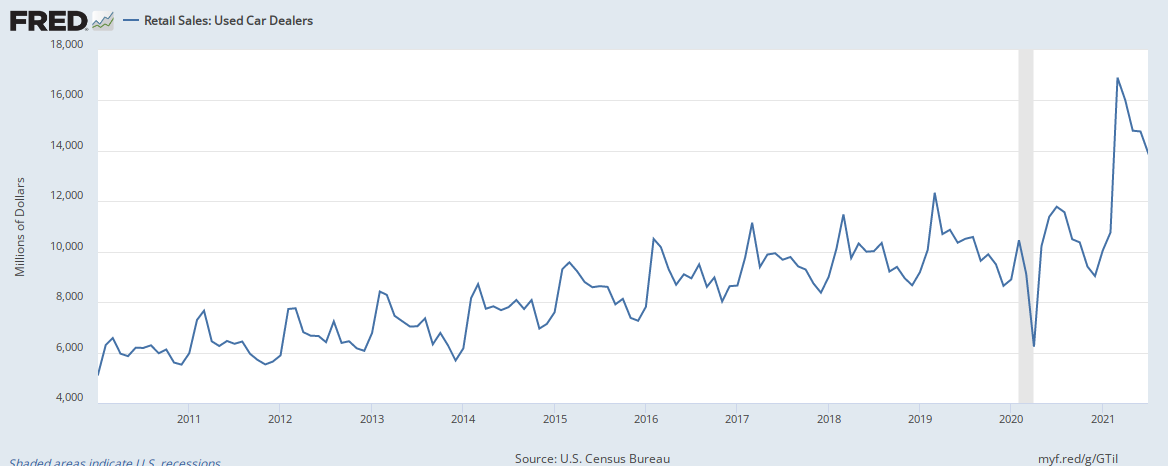
CarMax (KMX)
Used car retailer CarMax (KMX) pushed itself over the top last week. Despite a fade from intraday highs, KMX closed at an all-time high. I am surprised that KMX took this long to shake its 2021 trade range given soaring prices and sales for used cars. The KMX breakout is happening just as it looks like used car sales are normalizing (see charts below). Accordingly, I am a watcher for now. KMX could be a swing trade on a retest of 50DMA support.

Be careful out there!
Footnotes
“Above the 50” (AT50) uses the percentage of stocks trading above their respective 50-day moving averages (DMAs) to measure breadth in the stock market. Breadth defines the distribution of participation in a rally or sell-off. As a result, AT50 identifies extremes in market sentiment that are likely to reverse. Above the 50 is my alternative name for “MMFI” which is a symbol TradingView.com and other chart vendors use for this breadth indicator. Learn more about AT50 on my Market Breadth Resource Page. AT200, or MMTH, measures the percentage of stocks trading above their respective 200DMAs.
Active AT50 (MMFI) periods: Day #361 over 21%, Day #3 over 31% (overperiod), Day #4 under 41%, Day #13 under 51% (underperiod), Day #67 under 62%, Day #131 under 72%
Source for charts unless otherwise noted: TradingView.com
Grammar checked by Grammar Coach from Thesaurus.com
Full disclosure: long UVXY call spread, long AAPL calls, long WYNN call spread
FOLLOW Dr. Duru’s commentary on financial markets via StockTwits, Twitter, and even Instagram!
*Charting notes: Stock prices are not adjusted for dividends. Candlestick charts use hollow bodies: open candles indicate a close higher than the open, filled candles indicate an open higher than the close.