
Stock Market Commentary
The U.S. stock market quickly rebounded from the weekend’s jolt of pandemic news from Europe. The initial bout of selling created a close call for the extended overbought period. The comeback of buying picked the stock market off the threshold for overbought conditions but a sustained survival remains unsettled. While buyers convincingly returned to tech stocks, the S&P 500 (SPY) is trading with shades of uncertainty.
The Stock Market Indices
The S&P 500 (SPY) punctured uptrending support at its 20-day moving average (DMA) and lost as much as 2.0% at the lows. A rebound preserved support and secured a 0.4% loss on the day. Sellers returned today to add a 0.2% loss. The S&P 500 continues to levitate above 20DMA support, still scraping below the recent all-time high.
The NASDAQ (COMPQX) sprinted ahead of the S&P 500 again. The tech-laden index essentially recovered all its initial losses on Monday. Today, the NASDAQ pulled off a 0.5% gain and a fresh all-time high.
Stock Market Volatility
The volatility index (VIX) faded hard from Monday’s highs and lost another 3.7% today. Monday’s gap remains intact so the VIX is still flagging residual fear and lingering nervousness. The dichotomy between the VIX and the resurgent NASDAQ is leaving the S&P 500 in the middle and “undecided.”
The Short-Term Trading Call: Extended Overbought Conditions

- AT40 = 74.9% of stocks are trading above their respective 40-day moving averages (Day #27 overbought)
- AT200 = 85.6% of stocks are trading above their respective 200-day moving averages TradingView’s calculation).
- Short-term Trading Call: neutral
Trading this week reminded me why I am keeping the short-term trading call at neutral despite the strong buying power implied by this extended overbought period. AT40 (T2108), the percentage of stocks trading above their respective 40DMAs, had a close call with the 70% overbought threshold. On Monday, the day’s opening salvo of selling took my favorite indicator right to the edge.

Just as the contrary mindset worked in the currency markets, so too did it work in the equity markets. In a confirmation of bullish interest, buyers stepped right into the breach and sent AT40 higher right into the close. Tuesday’s setback was also met with immediate buying interest. Still, AT40 has clearly cooled off. I am on alert for the beginning of the end of this extended overbought period.
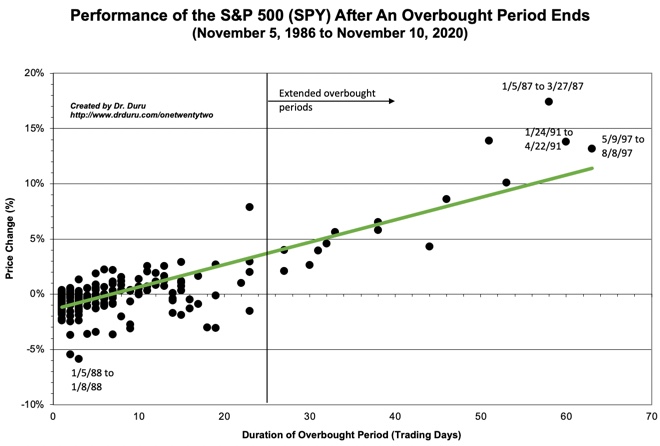
The stock market is on day #27 of overbought conditions. The S&P 500 has 2.8% in gains since overbought trading resumed on November 13th. The index is stuck in a near 3-week range of 2-3% overbought gains. The historical chart below shows that 2.8% is a little lower than the expected gains for the S&P 500 if the overbought period ended on the 27th day (the green trend line represents the “expected” relationship). This slight underperformance suggests the stock market has one more rally left in it before the overbought period ends. Either way, I am more prepared now to flip (cautiously) bearish when the overbought period ends.
Stock Chart Reviews – Below the 50DMA
Best Buy (BBY)
Electronics retailer Best Buy (BBY) finally stopped selling off. A two week trading range is now in place. The downtrending 20DMA presents the first test to this stabilization. I am looking to next trade BBY in the direction of the breakout from this short-term trading range.
Beyond Meat (BYND)
In a month full of parabolic moves and highly speculative trades, I am surprised to see Beyond Meat (BYND) still stuck in a relative rut. BYND trades exactly where it did 7 months ago. The good news for BYND is that post-earnings selling lasted just one day. The stock is in stabilization mode now.
Splunk (SPLK)
The post-earnings recovery for Splunk (SPLK) surged into my upside target. I will look for a new buy if SPLK confirms a 200DMA breakout.
Stock Chart Reviews – Above the 50DMA
Goldman Sachs Group (GS)
Goldman Sachs Group (GS) benefited from Monday’s surge in financials. Financials stood above the fray in the stock market as they basked in the glow of approval from the Federal Reserve. GS jumped 6.1% to a 2 1/2 year high. Today, GS gave some of those gains back with a 2.7% pullback. I am a buyer on dips from there. Last month’s breakout looks confirmed with this week’s breakout.
Timkensteel (TMST)
Specialty steel marker Timkensteel (TMST) remains on my radar. Buyers got ahead of themselves sending the stock on a parabolic burst above its upper Bollinger Band (BB) earlier this month. The stock subsequently snowballed into a full reversal. Today TMST is defended 50DMA support. I am a buyer on a higher close from here. If the 50DMA gives way, I will next look for a complete reversal of last month’s post-earnings breakout.
Target Corporation (TGT)
Retailer Target Corporation (TGT) enjoyed a 1-week post-earnings rally before topping out. December has been a month of cooling. I am eyeing a test of 50DMA support as an opportunity to buy some speculative call options.
Be careful out there!
Footnotes
“Above the 40” (AT40) uses the percentage of stocks trading above their respective 40-day moving averages (DMAs) to measure breadth in he stock market. Breadth indicates the distribution of participation in a rally or sell-off. As a result, AT40 can identify extremes in market sentiment that are likely to reverse. Above the 40 is my alternative name for “T2108” which was created by Worden. Learn more about T2108 on my T2108 Resource Page. AT200, or T2107, measures the percentage of stocks trading above their respective 200DMAs.
Active AT40 (T2108) periods: Day #50 over 20%, Day #34 above 30%, Day #33 over 40%, Day #32 over 50%, Day #31 over 60%, Day #27 over 70%


Red line: Overbought threshold (70%); Blue line: Oversold threshold (20%). Source: FreestockCharts
Source for charts unless otherwise noted: TradingView.com
Full disclosure: long UVXY
FOLLOW Dr. Duru’s commentary on financial markets via StockTwits, Twitter, and even Instagram!
*Charting notes: FreeStockCharts stock prices are not adjusted for dividends. TradingView.com charts for currencies use Tokyo time as the start of the forex trading day.