U.S. Gross Domestic Product (GDP) for the first quarter of 2020 (advanced estimate) plunged by 4.8% as the coronavirus pandemic put the economy on lockdown. The following categories made positive contributions to GDP in ascending order of their contribution to the percentage change:
- Housing and utilities: .08%
- Change in farm inventories: 0.10%
- Government consumption expenditures and gross investment: 0.13%
- Financial services and insurance: 0.15%
- Software: 0.16%
- Final consumption expenditures of nonprofit institutions serving households: 0.63%
- Private residential fixed investment: 0.74%
- Non-durable goods – Food and beverages purchased for off-premises consumption & other non-durables : 0.94%
- Imports: 2.32%
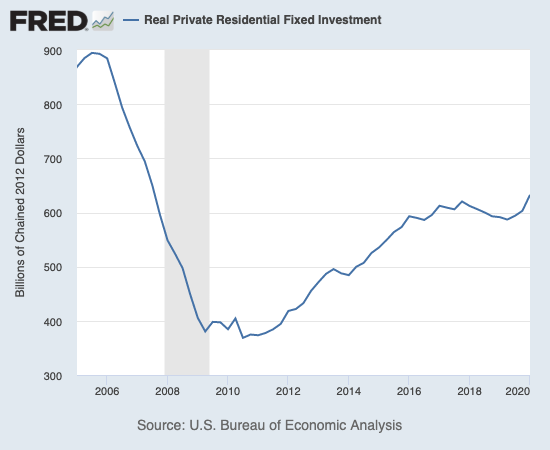
I already knew that the residential housing market was exceptionally strong going into mid-March when much of the U.S. went into lockdowns. Still, I was quite surprised to see just how vigorously the housing sector was investing into the economy. GDP from residential fixed investment increased 7.0% year-over-year and 21.0% from Q4 2019. The graph below of real private residential fixed investment shows how this category rebounded from a shallow trough a year ago to hit a new post- financial crisis high, a 13-year high.

Source: U.S. Bureau of Economic Analysis, Real Private Residential Fixed Investment [PRFIC1], retrieved from FRED, Federal Reserve Bank of St. Louis, May 14, 2020.
Unfortunately, residential construction will likely become a major drag on GDP for Q2 based on recent housing start and employment data.
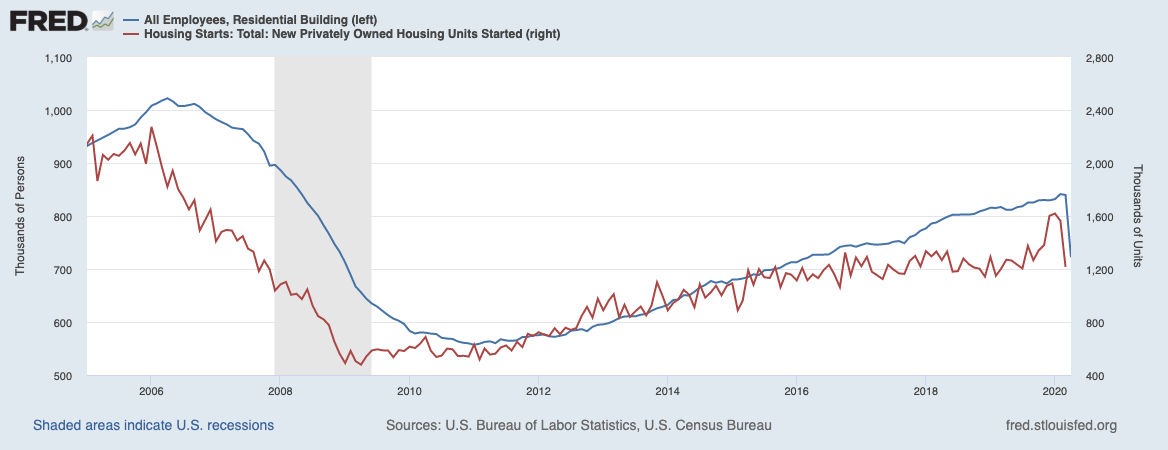
In March, 2020 unemployment in the construction industry increased to 6.9% from the 5.2% in March, 2019. The sector lost 29,000 jobs from February, 2020, almost all of it in nonresidential building and heavy and civil engineering construction (21,000 total loss).
The situation changed dramatically in April. From the April jobs report:
“Construction employment fell by 975,000 in April, with much of the loss in specialty trade contractors (-691,000). Job losses also occurred in construction of buildings (-206,000).”
This plunge took construction employment down to a 4-year low. Unemployment surged to 16.6%, a significant increase from the 4.7% in April, 2019.
These job losses were immediately proceeded by a collapse in housing starts back to July, 2019 levels. The surge in housing starts from the previous 3 months was reversed in a flash. Just like the last peak of the housing industry from 2005 to 2006, employment topped out after housing starts.

Sources: U.S. Bureau of Labor Statistics, All Employees, Residential Building [CES2023610001], retrieved from FRED, Federal Reserve Bank of St. Louis and U.S. Census Bureau and U.S. Department of Housing and Urban Development, Housing Starts: Total: New Privately Owned Housing Units Started [HOUST], retrieved from FRED, Federal Reserve Bank of St. Louis, May 16, 2020.
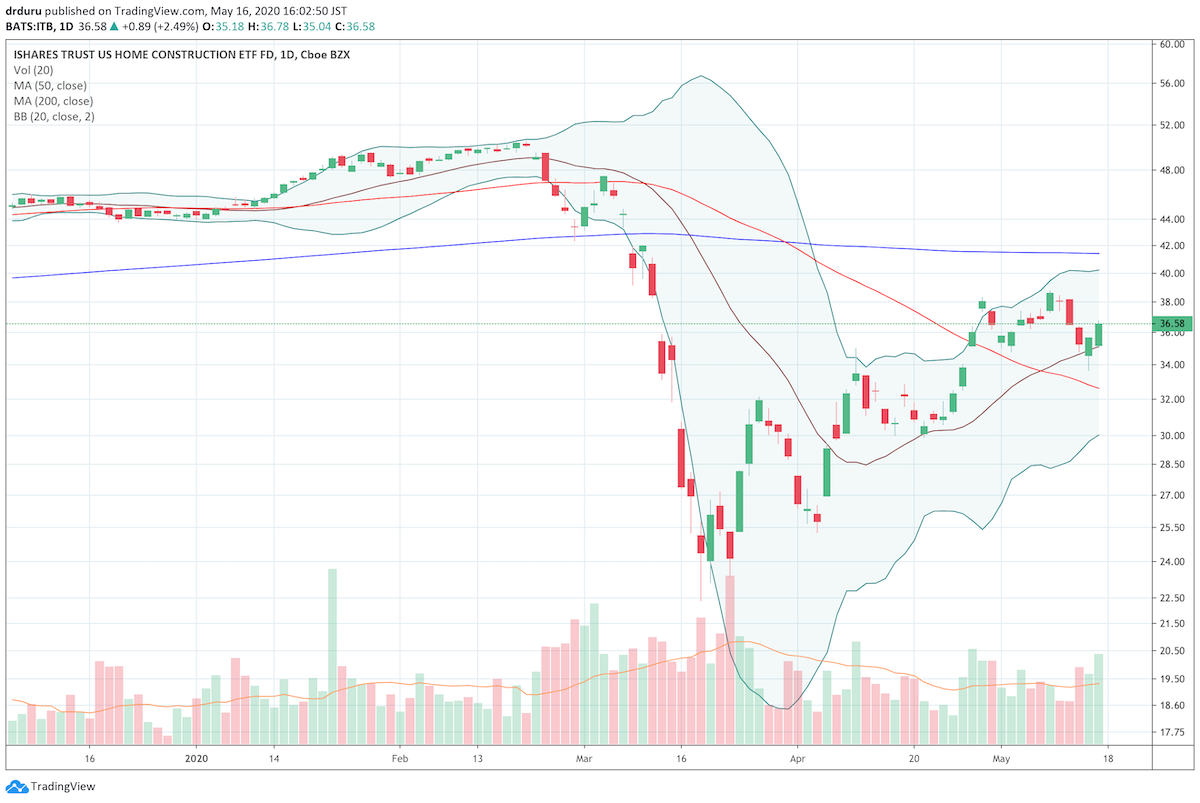
The rapid loss of housing starts and construction employment suggest in turn an on-going rapid loss in economic activity in the housing market. This will be reflected in the housing numbers for April as well as the Q2 GDP numbers. In the meantime, public home builders have reported a lot of optimism surrounding a rush to rationalize their businesses. The data tell me not to expect much more upside in coming weeks and months for the iShares Dow Jones US Home Construction Index Fund (ITB).

Source: TradingView.com
Be careful out there!
