
AT40 = 34.2% of stocks are trading above their respective 40-day moving averages (DMAs)
AT200 = 31.5% of stocks are trading above their respective 200DMAs
VIX = 18.1
Short-term Trading Call: neutral
Commentary
The countdown to “hedge fund d-day” is finally behind the market.
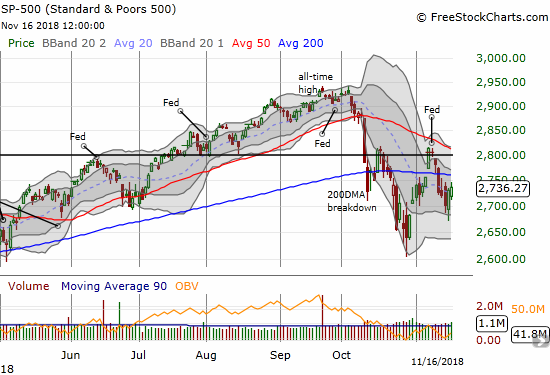
So far, the results are encouraging while the market is still far from a solid process of healing from the on-going technical damage. AT40 (T2108), the percentage of stocks trading above their respective 40-day moving averages (DMAs), dropped as low as 25.8% on Thursday and may have marked a “close enough” point to the oversold threshold of 20%. The S&P 500 (SPY) bounced sharply off Thursday’s intraday low to log a gain with Friday delivering some follow-through buying. Note well that overhead resistance looks more ominous than ever with declining 50 and 200DMAs and two peaks well below 50DMA resistance.
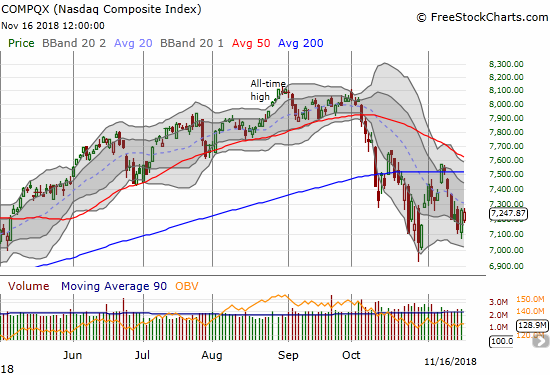
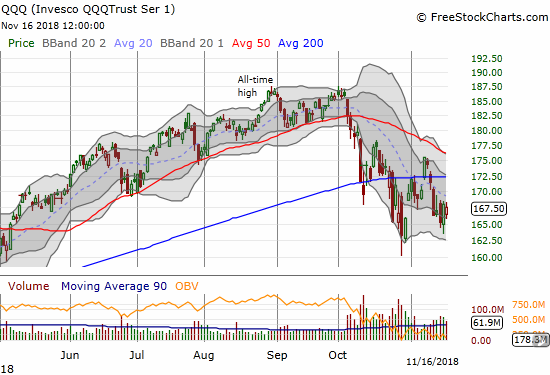
The NASDAQ and the Invesco QQQ Trust (QQQ) bounced back from ominous starts to the week. I used this time to buy QQQ put options as a hedge. Tech has suffered some startling beatings in this selling cycle, so I think it is a good place to put on some hedges (in addition to my favorite Caterpillar (CAT)).
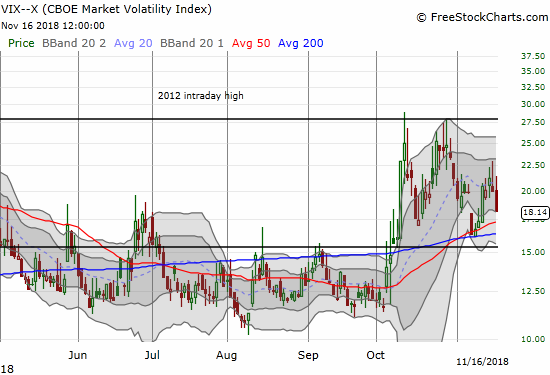
The volatility index, the VIX, was the most encouraging part of the picture. The VIX faders returned with a vengeance over the past two days. On Friday, the VIX dropped 9.2% for a close below the important 20 level. I took this opportunity to take profits on my latest tranche of put options on ProShares Ultra VIX Short-Term Futures (UVXY). While I do not expect the coming holiday-shortened week to aggravate volatility, I also do not anticipate enough short-term downside to make worthwhile the risk of an extended hold of UVXY puts.
The bears maintained a fresh grip on the market to start the week. That grip significantly loosened going into the close of the week. While it looks like November should avoid a drawdown, this period is not generating the relatively benign trading I was anticipating. I am continuing to adjust my short-term trading strategy accordingly. I have shortened the horizon for trades, and I am more willing to try fades. Accordingly, the short-term trading call remains firmly at neutral.
CHART REVIEWS
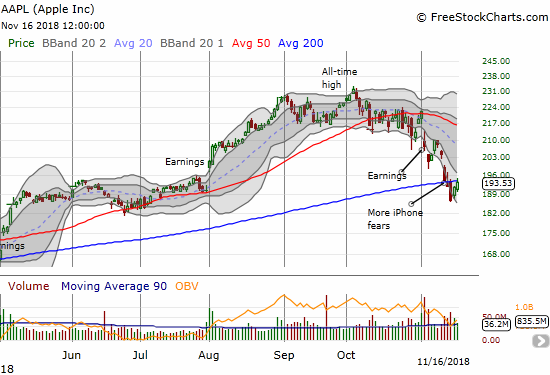
Apple (AAPL)
AAPL finished the week strong after a Wednesday plunge that could have been the nail to seal the trap door shut for the market. AAPL closed the week right at 200DMA resistance. The spotlight is on AAPL here as a potentially significant drag or boost on sentiment.
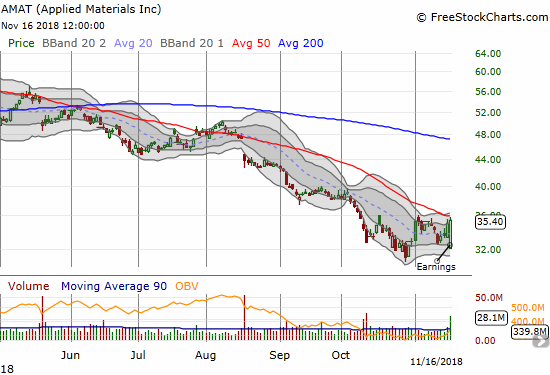
Applied Materials (AMAT)
AMAT gapped down post-earnings and looked ready to confirm on-going weakness in the semiconductor sector. Buyers took over from there and created a bullish engulfing pattern. I am a buyer on a 50DMA breakout. The easy stop is below the post-earnings intraday low.
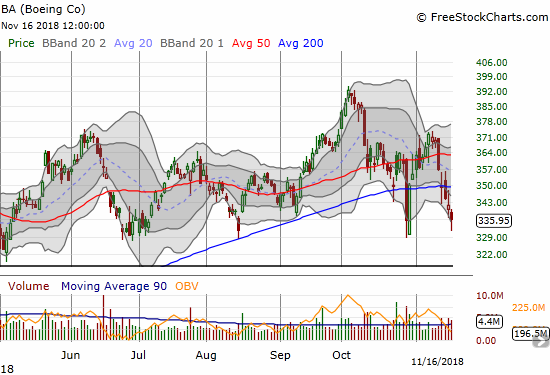
Boeing (BA)
BA suffered uncharacteristic relative underperformance under the weight of news of a Wall Street Journal story citing safety concerns. With two 200DMA breakdowns in less than a month, BA looks like it is topping out. Before this selling, BA last traded under its 200DMA over two years ago. Still, with the stock bouncing off the lows, I bought a call option on a bet the stock still has enough unwavering support to send it back toward the top of the current trading range.
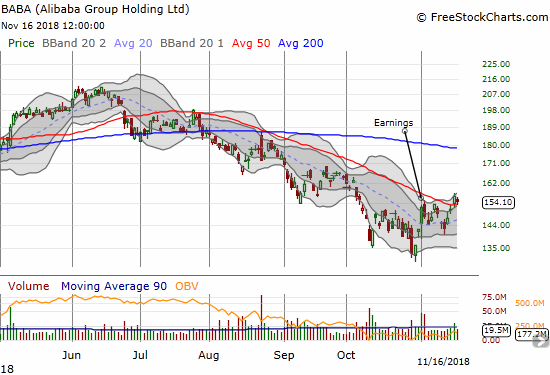
Alibaba Group (BABA)
I did not draw up the trade this way, but BABA gained just enough last week to deliver decent profits on my call spread. The call spread was a play on what I expected to be a run-up going into China’s Singles Day (November 11th or 11/11). Ironically, BABA sold into the event and rallied after.
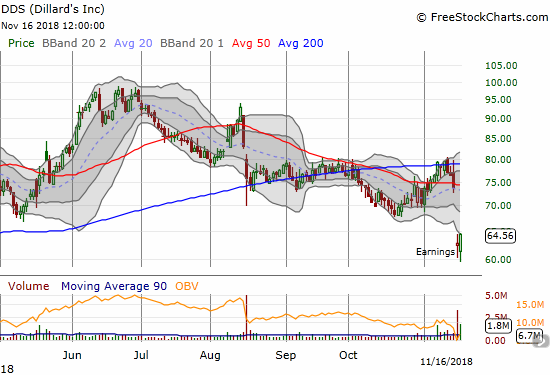
Dillard’s (DDS)
DDS lost 14.8% post-earnings. The move confirmed 200DMA resistance and completed another 50DMA breakdown. With a post-earnings closing high on Friday, the stock looks like it is already trying to make a comeback. With 66.1% of its float sold short, DDS is like ground zero for the health of department stores.
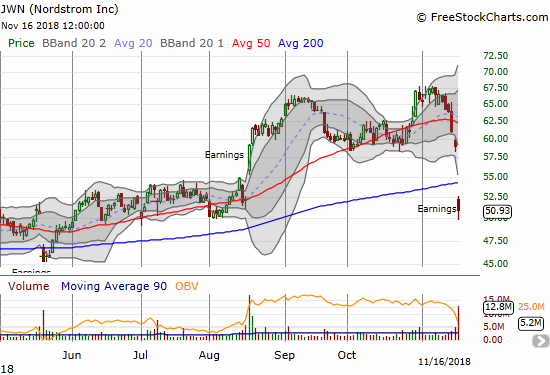
Nordstrom (JWN)
JWN added to the bad news for department stores. The post-earnings sell-offs for these stocks seem to be confirming the top in retailers. JWN is my favorite play in the space, but I am in no rush to buy this dip. This large post-earnings 200DMA breakdown is quite bearish.
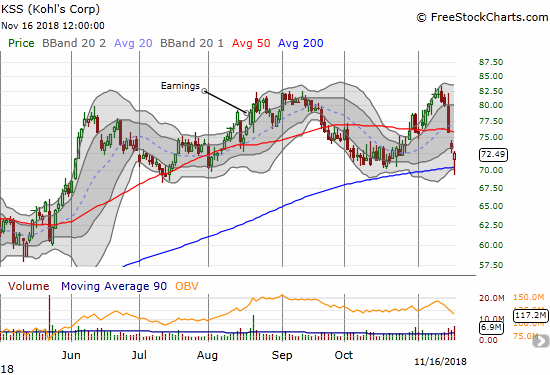
Kohl’s Corporation (KSS)
KSS did not report earnings last week, but it succumbed in sympathy with the department stores that did report. While the apparent successful test of 200DMA support is encouraging, I am quite content to wait to see what happens after KSS reports earnings in two days on November 20th.
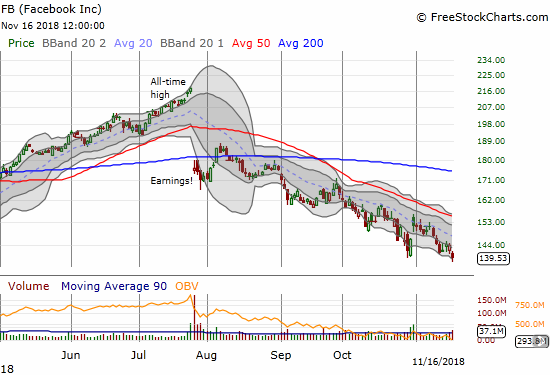
Facebook (FB)
After earnings, FB resumed its on-going downtrend off the summer post-earnings collapse. With a fresh 18-month low, FB confirmed its status as a broken stock. While the fresh weakness is surprising given the post-earnings pop, I decided to hold onto my pre-earnings trade with the short side of the calendar call spreads expiring harmless on Friday.
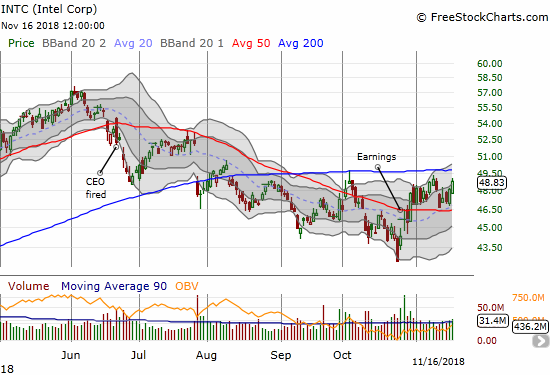
Intel (INTC)
I am back in business with the INTC between earnings trade. Despite more bad news in the semiconductor sector, INTC managed to rally 1.5% on Friday. I used this opportunity to take profits on my last tranche of call options. Since INTC was trading above the strike of my calendar call spread, I also took profits on that position. Overhead 200DMA resistance still looks ominous, so I anticipate my next trade will be a buy on the dip instead of a buy on the breakout; I am liking the 50DMA as support.
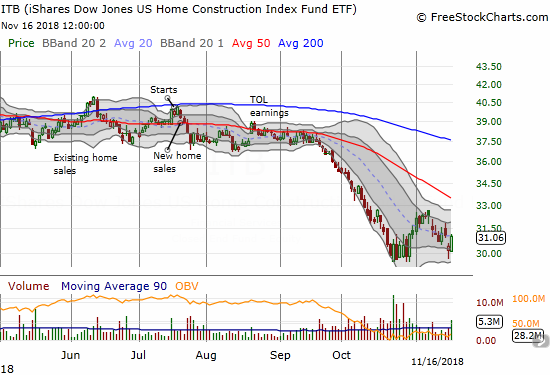
iShares US Home Construction ETF (ITB)
The seasonally strong period for home builder stocks launched well in the first half of the month. An earnings warning from KB Home (KBH) brought that momentum to a resounding end. The good news is that ITB ended the week with an immediate reversal of the KBH-driven loss from Thursday. I will be covering a lot more on home builders in a post on KBH and then the Housing Marketing Review for November.
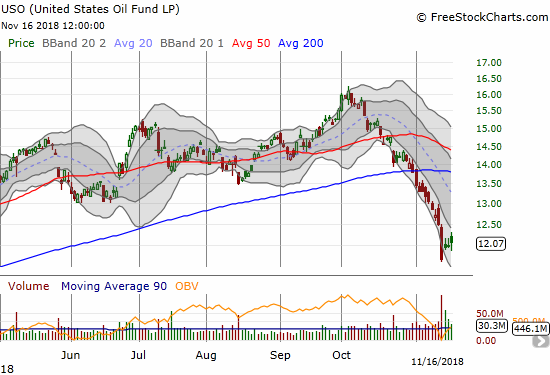
United States Oil (USO)
Oil is suffering an epic plunge. At its worst, USO was down 27.3% off the three-year high set on October 3rd. USO closed the week clinging to a thin year-to-date gain. With a gap up on Wednesday after Tuesday’s plunge and another gain on Friday, USO may finally be making a bottom. However, I do not want to dive into this mess at this juncture. I would prefer to see more buying interest and some stabilization. Note that USO remains trapped in the middle of a downtrending lower Bollinger Band (BB).
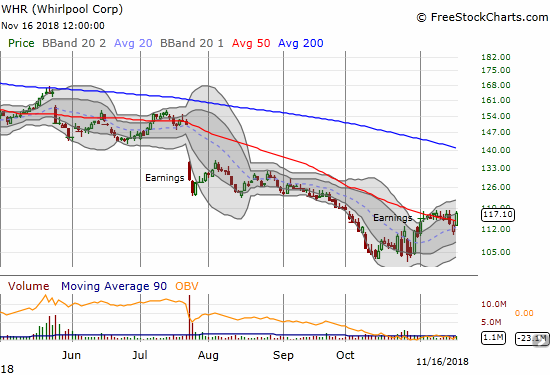
Whirlpool (WHR)
WHR is surprisingly holding up. The stock is inches away from a bullish breakout which would convert me from a seller to a buyer.
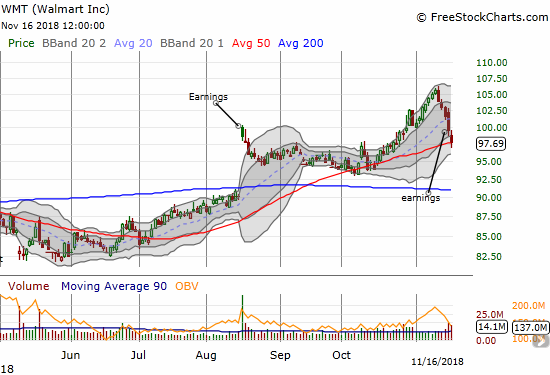
Walmart (WMT)
WMT looked unstoppable after its huge post-earnings gap up in August. The momentum seemed to return with an October rally that was impressively counter market weakness. As the stock continued to power ahead to new post-earnings highs, WMT looked primed for another strong post-earnings performance. Instead, selling started ahead of earnings and has yet to stop. Support at the 50DMA provided some relief for the selling. I am a buyer if WMT can manage to show some buying pressure above 50DMA support.
— – —
FOLLOW Dr. Duru’s commentary on financial markets via email, StockTwits, Twitter, and even Instagram!
“Above the 40” uses the percentage of stocks trading above their respective 40-day moving averages (DMAs) to assess the technical health of the stock market and to identify extremes in market sentiment that are likely to reverse. Abbreviated as AT40, Above the 40 is an alternative label for “T2108” which was created by Worden. Learn more about T2108 on my T2108 Resource Page. AT200, or T2107, measures the percentage of stocks trading above their respective 200DMAs.
Active AT40 (T2108) periods: Day #12 over 20%, Day #2 over 30% (overperiod), Day #6 under 40%, Day #40 under 50%, Day #56 under 60%, Day #109 under 70%
Daily AT40 (T2108)
")
Black line: AT40 (T2108) (% measured on the right)
Red line: Overbought threshold (70%); Blue line: Oversold threshold (20%)
Weekly AT40 (T2108)

*All charts created using freestockcharts.com unless otherwise stated
The charts above are my LATEST updates independent of the date of this given AT40 post. For my latest AT40 post click here.
Related links:
The AT40 (T2108) Resource Page
You can follow real-time T2108 commentary on twitter using the #T2108 or #AT40 hashtags. T2108-related trades and other trades are occasionally posted on twitter using the #120trade hashtag.
Be careful out there!
Full disclosure: long SSO, long SPY calls, long ITB calls, long BA call, long QQQ puts, long FB calls,
*Charting notes: FreeStockCharts.com stock prices are not adjusted for dividends. TradingView.com charts for currencies use Tokyo time as the start of the forex trading day. FreeStockCharts.com currency charts are based on Eastern U.S. time to define the trading day.