AT40 = 67.5% of stocks are trading above their respective 40-day moving averages (DMAs)
AT200 = 63.2% of stocks are trading above their respective 200DMAs
VIX = 9.2
Short-term Trading Call: cautiously bullish
Commentary
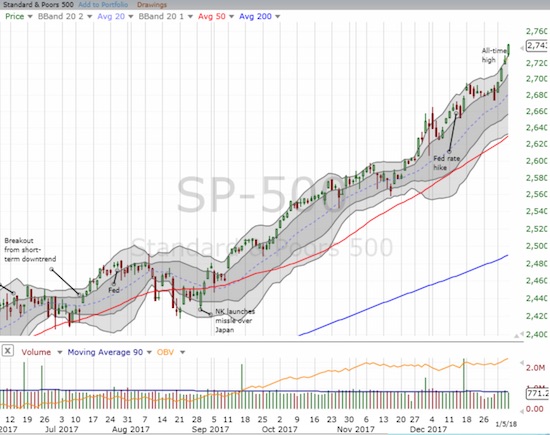
In my last Above the 40 I complained that market breadth was once again suffering thanks to an S&P 500 (SPY) stretching upward while AT40 continued to churn below the overbought threshold of 70%. The first trading week of 2018 closed out with a subtly new wrinkle on an even more stretched rubberband.
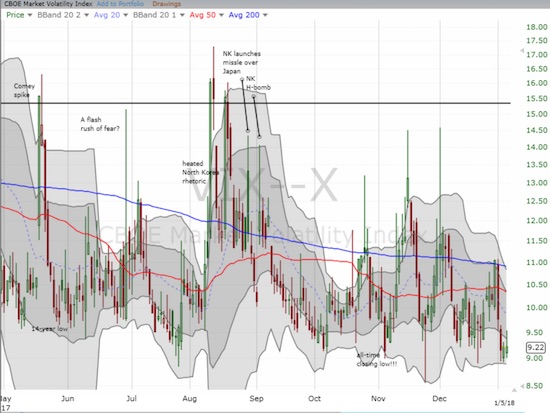
The S&P 500 reached well above its upper-Bollinger Band (BB) and a 0.7% gain. AT40, the percentage of stocks trading above their respective 40-day moving averages (DMAs), nudged just slightly higher. However, AT40 closed at a fresh 2 1/2 month high. At 67.5%, AT40 is now within striking distance of overbought and transitioned the churn into a sloth-like uptrend. The volatility index, the VIX, was even more interesting: it scooted higher only to fade to a flat close on the day. It is hard to imagine the S&P 500 pushing even higher from here without AT40 breaking into overbought territory to support an overstretched technical condition. Moreover, with the VIX holding the line just above all-time lows, some kind of snapback of the rubberband seems imminent. The S&P 500 should only be able to stretch further in the coming week with the VIX managing a breakdown below its all-time low (at which point I would feel compelled to double down on my hedge of call options on ProShares Ultra VIX Short-Term Futures (UVXY)).
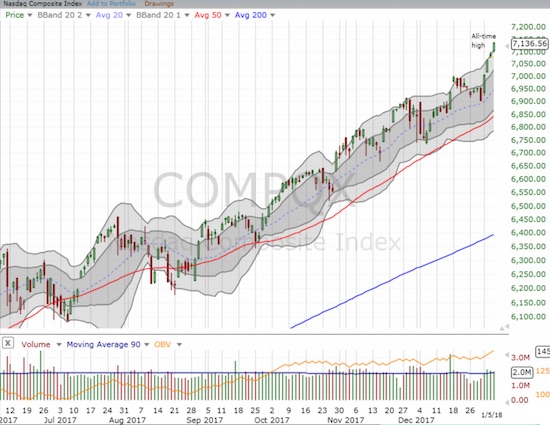
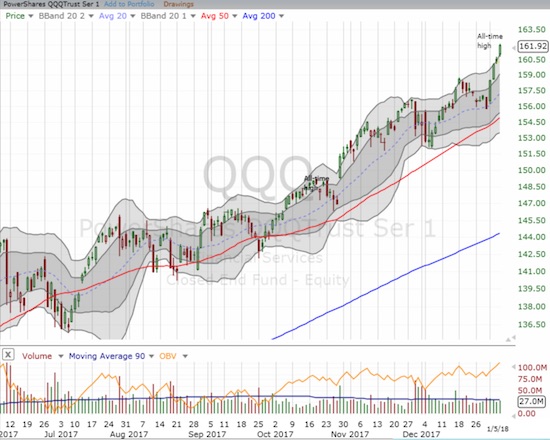
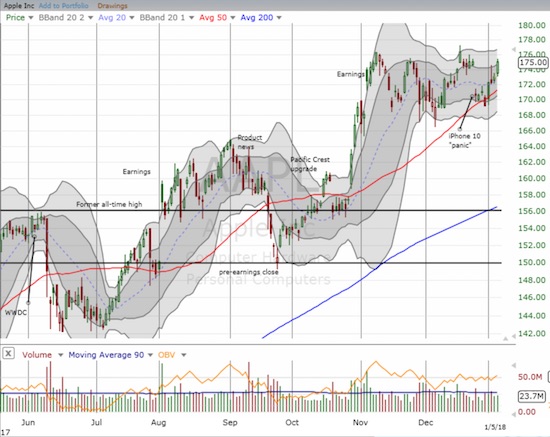
Thanks to MOST of the usual suspects, tech stocks sprinted higher similarly to the S&P 500. Apple (AAPL) has once again appeared as the important laggard; the stock faces some critical resistance. AAPL closed the week by finally filling last month’s gap down on iPhone X supplier news. The move also confirmed 50DMA support. YET, the 175 to 177 range has stopped AAPL in its tracks three times before. Needless to say, I held off on making a fresh weekly AAPL call option trade (last week’s trade worked out particularly well).
STOCK CHART REVIEWS
DexCom (DXCM)
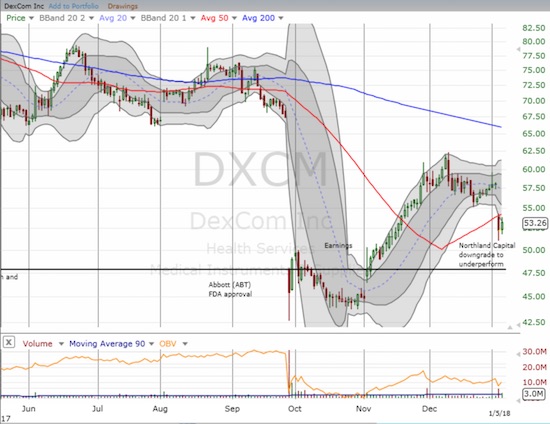
Northland Capital downgraded DXCM to underperform. That action was enough to create a devastating gap down below the 50DMA and forced me to abandon ship and lock in my remaining profits. I will be keeping an eye on DXCM in case I can get back in at an even lower price. I explained my bottom-fishing on DXCM in “The Danger in DexCom…and the Opportunity.”
Macy’s (M)
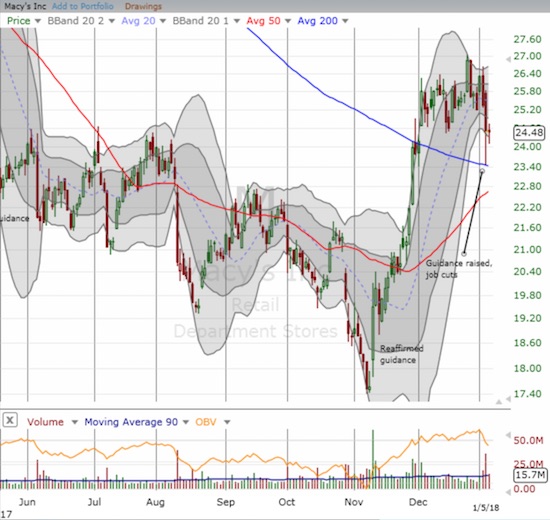
Macy’s increased guidance and was rewarded with a pullback. This reaction indicates that the retail recovery has entered a new stage: no more benefit of the doubt based on low valuation. Still, Macy’s reported strong results and the stock bounced off 200DMA support. This drop is a buying opportunity with a clear stop below 50DMA support.
Bed Bath & Beyond (BBBY)
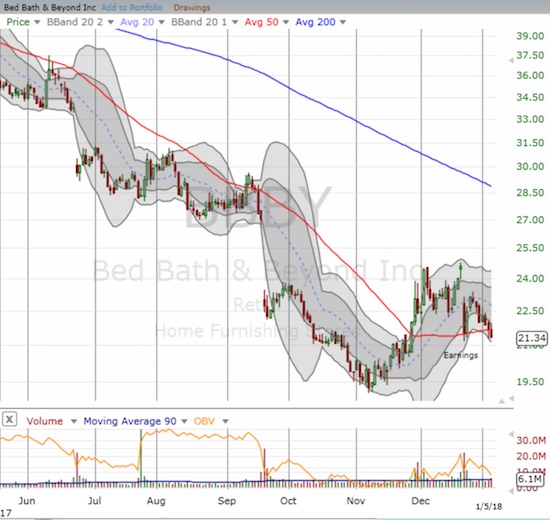
It looks like Bed Bath & Beyond (BBBY) is not quite ready to rebound. The early bounceback gave way to a resumption of selling. The stock closed below 50DMA support on Friday.
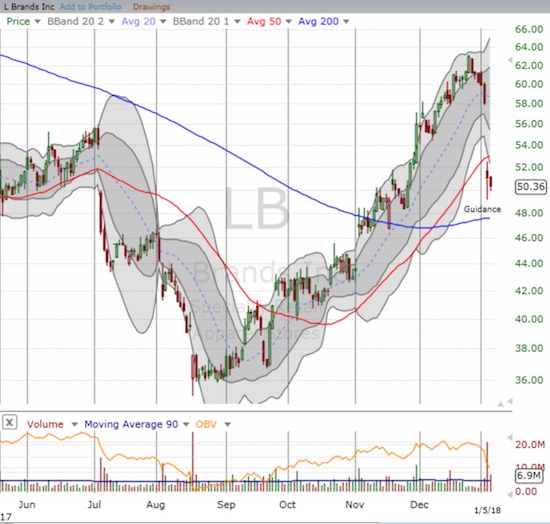
L Brands (LB)
LB added its own brake to the retail rally with disappointing guidance. I will be watching to see whether its 200DMA holds up as support.
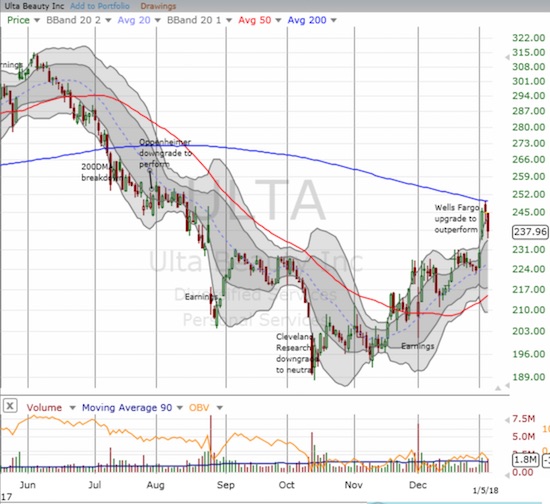
Ulta Beauty (ULTA)
ULTA found a fresh fan in Wells Fargo. The upgrade to outperform sent the stock slamming into 200DMA resistance. I did not have a fresh position in place ahead of the upgrade, but I bought back in with a call option on Friday just as the incremental gain from the upgrade reversed.
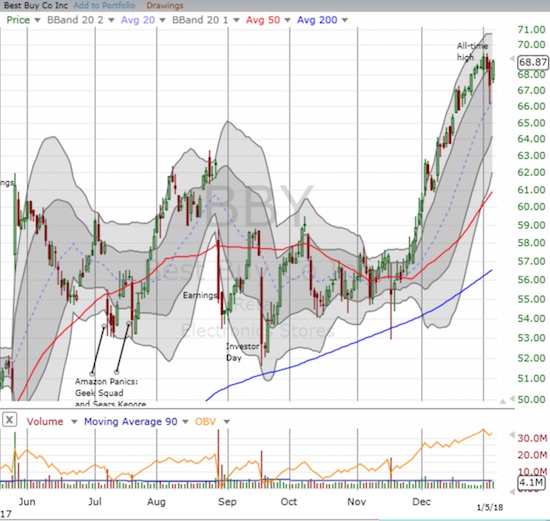
Best Buy (BBY)
BBY fell back on Thursday in sympathy with the pause in retail stocks. Buyers returned the next day in a sign that portends well for the retail recovery trade.
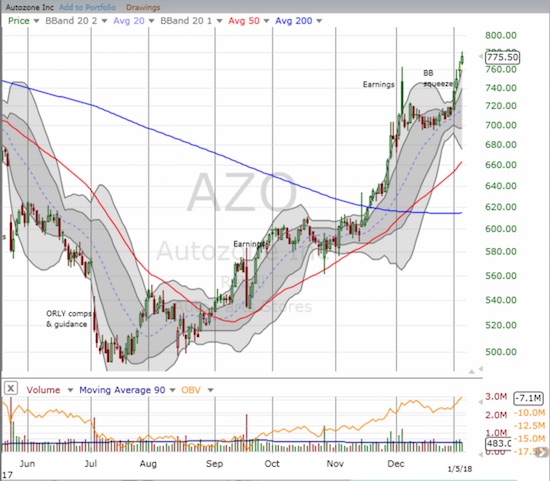
Autozone (AZO)
Auto parts companies are helping to carry the torch for retailers in 2018. The Bollinger Band (BB) squeezes I pointed out in my last discussion on the space resolved to the upside. AZO is at a 52-week high.
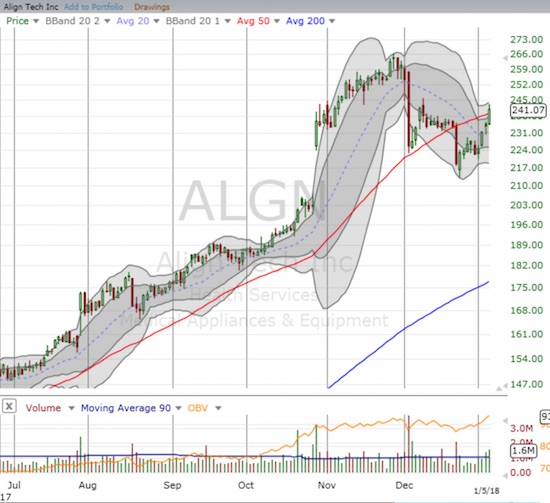
Align Technology (ALGN)
ALGN had a rough December as its impressive upward momentum came to an abrupt end. A 50DMA breakout on Friday finished the reversal of the 50DMA breakdown in mid-December. Buyers look ready to return.
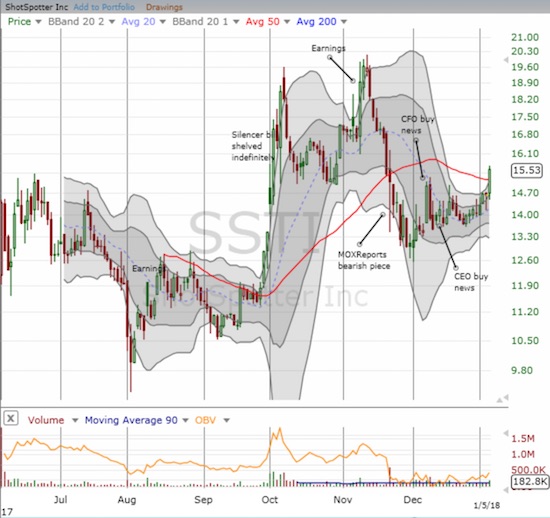
ShotSpotter (SSTI)
It took a month of growing pressure, but SSTI finally broke out above 50DMA resistance. The market failed to respond much to important insider buying last month. This month may mark the time buyers put an end to the bear raid especially given the series of good news SSTI experienced in the last month.
— – —
FOLLOW Dr. Duru’s commentary on financial markets via email, StockTwits, Twitter, and even Instagram!
“Above the 40” uses the percentage of stocks trading above their respective 40-day moving averages (DMAs) to assess the technical health of the stock market and to identify extremes in market sentiment that are likely to reverse. Abbreviated as AT40, Above the 40 is an alternative label for “T2108” which was created by Worden. Learn more about T2108 on my T2108 Resource Page. AT200, or T2107, measures the percentage of stocks trading above their respective 200DMAs.
Active AT40 (T2108) periods: Day #469 over 20%, Day #283 over 30%, Day #83 over 40%, Day #31 over 50%, Day #22 over 60% (overperiod), Day #57 under 70%
Daily AT40 (T2108)

Black line: AT40 (T2108) (% measured on the right)
Red line: Overbought threshold (70%); Blue line: Oversold threshold (20%)
Weekly AT40 (T2108)

*All charts created using freestockcharts.com unless otherwise stated
The charts above are my LATEST updates independent of the date of this given AT40 post. For my latest AT40 post click here.
Related links:
The T2108 Resource Page
You can follow real-time T2108 commentary on twitter using the #T2108 or #AT40 hashtags. T2108-related trades and other trades are occasionally posted on twitter using the #120trade hashtag.
Be careful out there!
Full disclosure: long UVXY calls, long SSTI, long ULTA call option, long BBBY
*Charting notes: FreeStockCharts.com uses midnight U.S. Eastern time as the close for currencies. Stock prices are not adjusted for dividends.
