
AT40 = 47.2% of stocks are trading above their respective 40-day moving averages (DMAs)
AT200 = 60.1% of stocks are trading above their respective 200DMAs
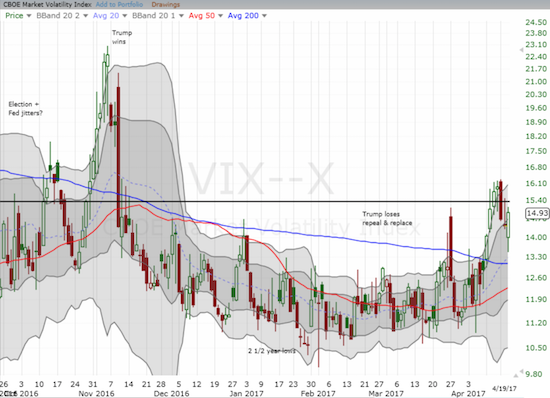
VIX = 14.9 (volatility index)
Short-term Trading Call: cautiously bullish)
Commentary
The S&P 500 (SPY) ended last week on a sour note. The index hit its first 42 trading day low since the days going into last year’s U.S. Presidential election and confirmed a breakdown below support at its 50-day moving average (DMA) – something the market had not experienced since last September and October. The setup appeared perfect for sellers to finally make a serious point, but, as usual these days, they failed to deliver. While the S&P 500 continues to trade below its 50DMA, each day this week has featured a higher intraday low.
Yet, the sellers have clearly not given up as easily as prior market setbacks. Today, the downtrending 20DMA held as resistance at the intraday high. The 50DMA is holding as resistance.
The S&P 500 is in a position of stasis, a stalemate.
Perhaps most importantly, the volatility index, the VIX, made a sharp and rapid comeback and closed just under the 15.35 pivot.
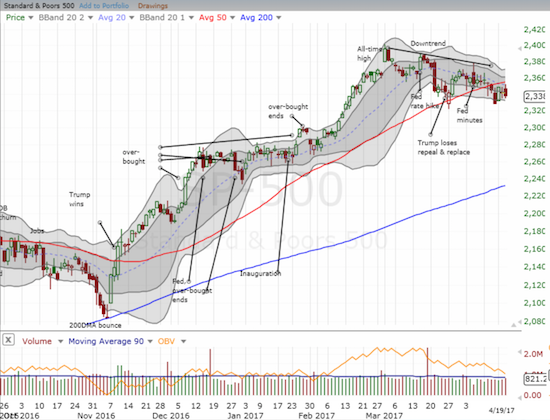
AT40 (T2108), the percentage of stocks trading above their respective 40DMAs, is adding to the sense of stasis. My favorite technical indicator closed the day at 47.2%. Since March 6th, AT40 has bounced widely between 31% and 55%. Now that earnings season is in full swing, I have no reason to expect a change in this churning behavior – the kind of change required to nudge the S&P 500 to a breakout or breakdown.
Stock market stasis does not cap the drama for individual stocks of course.
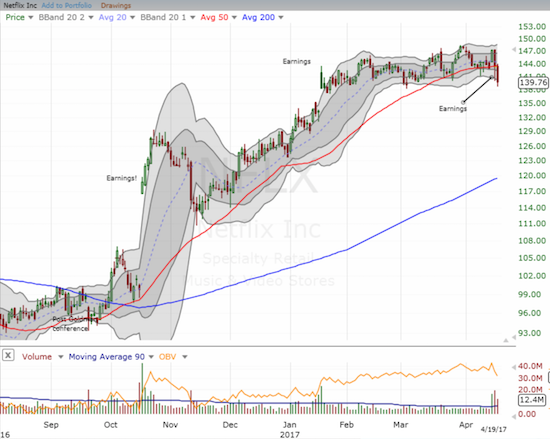
Netflix (NFLX) reported earnings on Monday evening and sellers went to work from the open the next day. Buyers were able to bounce the stock back to its 50DMA, but today sellers refreshed the downward push with a 2.5% loss. I interpreted these two days of selling and the 50DMA breakdown as bearish enough to warrant a small short position. The easy stop loss is a close above the 50DMA. I have no immediate downward price target just yet.
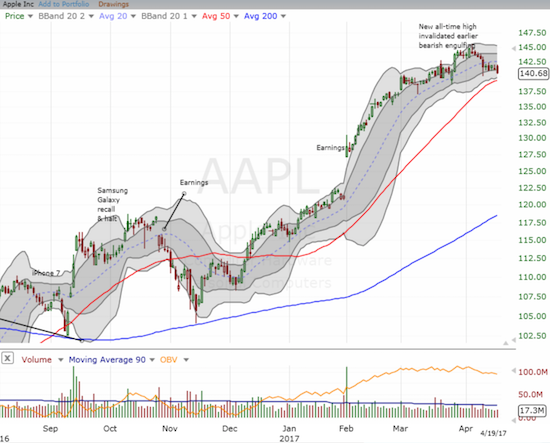
I chose the wrong week to get back to the AAPL weekly trade. As the week opened in relief mode, I went to what I thought would be one of the better performing big cap tech stocks in a week of recovery: Apple (AAPL). Monday delivered the tiniest of gains for AAPL. As a result, I lamented my choice as the likes of Alphabet (GOOG), Amazon.com (AMZN), and Facebook (FB) surged 1.7%, 2.0%, and 1.3% respectively. Needless to say, the follow-on performance for AAPL has only deepened my disappointment. I strongly suspect AAPL will flounder the rest of the week and put on a buying display closer to the May 2nd earnings report.
On the good side, I am back in business with call options on the SPDR Gold Shares (GLD). I learned my lesson from the last trade and went for a call spread. I picked 123/125 with 125 set as the upside target given this level was the last major peak in GLD. Note how GLD ended the day right on top of its pre-election close.
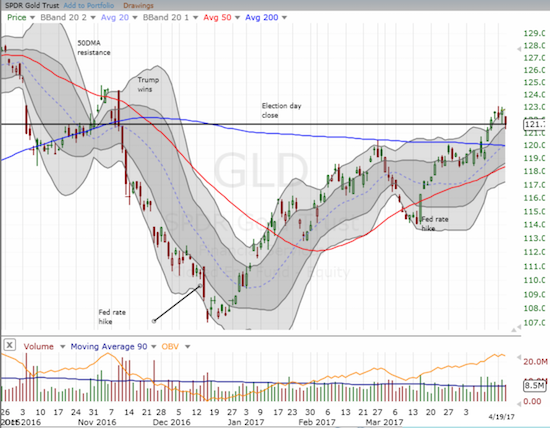
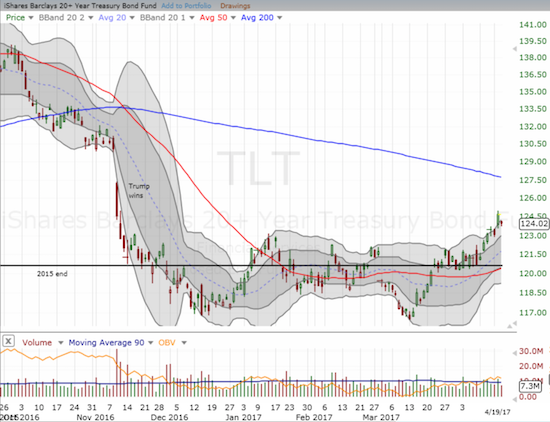
Gold fell as interest rates actually rose on the day. Still, the iShares 20+ Year Treasury Bond ETF (TLT) looks like it has bottomed out with a breakout last week above almost 4 months of consolidation. A weaker rate environment is bullish for gold, especially if that weaker rate environment is the result of “safe haven” flows.
— – —
FOLLOW Dr. Duru’s commentary on financial markets via email, StockTwits, Twitter, and even Instagram!
“Above the 40” uses the percentage of stocks trading above their respective 40-day moving averages (DMAs) to assess the technical health of the stock market and to identify extremes in market sentiment that are likely to reverse. Abbreviated as AT40, Above the 40 is an alternative label for “T2108” which was created by Worden. Learn more about T2108 on my T2108 Resource Page. AT200, or T2107, measures the percentage of stocks trading above their respective 200DMAs.
Active AT40 (T2108) periods: Day #293 over 20%, Day #113 over 30%, Day #3 over 40% (overperiod), Day #6 under 50%, Day #34 under 60%, Day #65 under 70%
Daily AT40 (T2108)
")
Black line: AT40 (T2108) (% measured on the right)
Red line: Overbought threshold (70%); Blue line: Oversold threshold (20%)
Weekly AT40 (T2108)

*All charts created using freestockcharts.com unless otherwise stated
The charts above are my LATEST updates independent of the date of this given AT40 post. For my latest AT40 post click here.
Related links:
The T2108 Resource Page
You can follow real-time T2108 commentary on twitter using the #T2108 or #AT40 hashtags. T2108-related trades and other trades are occasionally posted on twitter using the #120trade hashtag.
Be careful out there!
Full disclosure: long GLD shares and call spread, short NFLX, long SSO shares and call options, long TLT put options, long AAPL call options
NFLX downward targets based on gap-fills are $133.26 , $129.18, and $123.80 . Personally I’d pick $128, there looks to be significant old upward resistance around there which is now support.
I like it!