
AT40 Status: 64.5% of stocks are trading above their respective 40-day moving averages (DMAs)
AT200 Status: 70.0% of stocks are trading above their respective 200DMAs
VIX Status: 11.5 (volatility index)
Short-term Trading Call: neutral
Commentary
The S&P 500 (SPY) stumbled out the gate and struggled in slightly negative territory for much of the day. A strong push in the final two hours of the trading day barely nudged the index over the hump into a fresh all-time high. It was a run that underlined the market’s stubborn determination. That close marked the 6th day out of the last 7 at a record close.
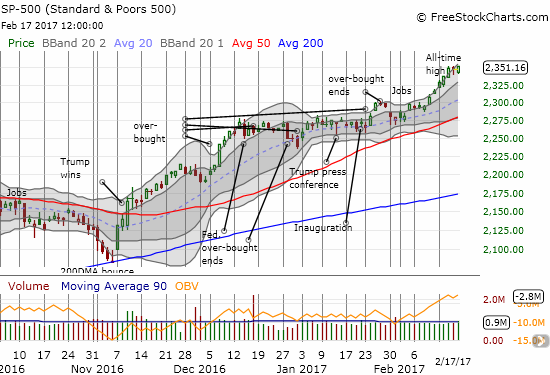
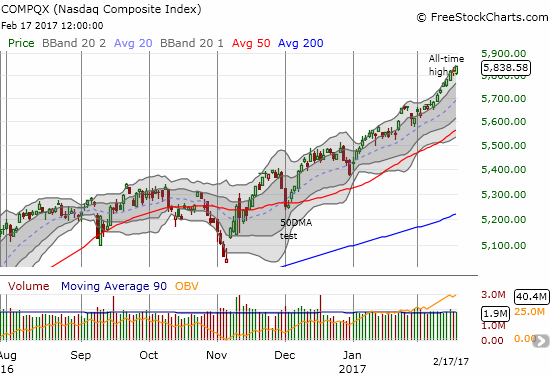
The chart of the NASDAQ (QQQ) is also impressive. Amid the current uptrend from the November low, the NASDAQ’s ascent has accelerated in February. In the S&P 500, February stands out as a breakout. The tech-laden index has spent much of this month trading at the high end of the uptrending channel formed from the upper-Bollinger Bands (BBs) (the lighter grey area). This acceleration is one more of those subtle signs revealing the stubborn determination of the buyers and bulls to keep pushing the stock market higher.
AT40 (T2108), the percentage of stocks trading above their 40DMAs, is NOT picking up the pace. While the bearish divergence with the S&P 500 (SPY) ended this week, AT40 has made no further progress. In fact, AT40 ended the week with two small declines. At its intraday low of 60.3%, AT40 was in danger of returning to its former downtrend. By the end of the day, AT40 pulled off a close of 64.5% and held up the appearances of an indicator more ready to support bullish sentiment.
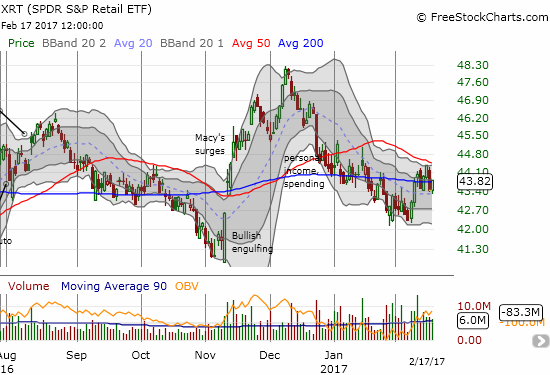
The week closed with the expiration of February monthly options. This is a time for reflecting upon trades gone wrong. The most striking of these trades was on SPDR S&P Retail ETF (XRT) with put options. XRT was one of the confirmations of a growing bearish divergence a month ago. XRT was breaking down below 200DMA support and trickled downward for two weeks. The dribs and drabs were never enough to generate a good profit on my put options. XRT has now pivoted around its 200DMA for the past 6 days. All this chop and churn is not good for long options positions. Next time, I will short (or buy) outright.
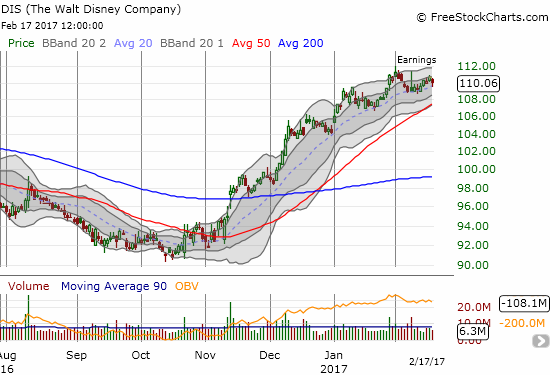
Disney (DIS) is driving me nuts. After DIS rallied a minute too late and a foot too short for my long-term call options, I turned my attention to an earnings play. A Morgan Stanley update made DIS look like a promising candidate to soar after earnings. Instead, DIS traded higher one more day before fading into earnings. On the day of earnings, the stock rallied sharply only to fade just as sharply. The stock’s reluctant progress is too slow to make options positions worthwhile.
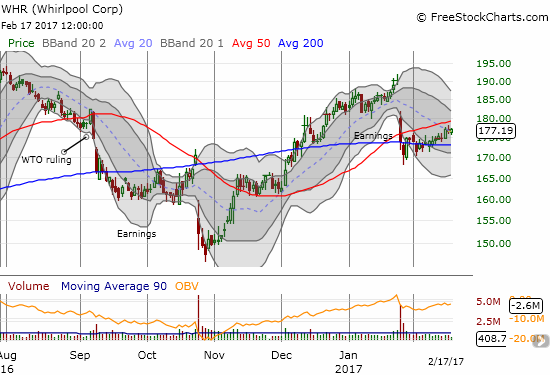
Finally there is Whirlpool (WHR). I was relatively certain after earnings WHR was headed for a big sell-off OR a big recovery. Accordingly, I bought a hedged position of calls and puts. Instead of a big gain, I got nothing but fizzle as WHR failed to sustain firm momentum in either direction. WHR now looks like a stock in search of its next catalyst.
Earnings season is effectively over. For the next half of the quarter ever more attention will turn to the economic implications of the machinations and imaginations in Washington D.C. As long as the stock market’s underpinnings stay relatively healthy, the dips caused by political headlines will likely become buying opportunities for swing trades. (Recall that if history repeats itself, this period of extremely low volatility should last until May).
— – —
FOLLOW Dr. Duru’s commentary on financial markets via email, StockTwits, Twitter, and even Instagram!
“Above the 40” uses the percentage of stocks trading above their respective 40-day moving averages (DMAs) to assess the technical health of the stock market and to identify extremes in market sentiment that are likely to reverse. Abbreviated as AT40, Above the 40 is an alternative label for “T2108” which was created by Worden. Learn more about T2108 on my T2108 Resource Page. AT200, or T2107, measures the percentage of stocks trading above their respective 200DMAs.
Active AT40 (T2108) periods: Day #251 over 20%, Day #71 over 30%, Day #70 over 40%, Day #68 over 50%, Day #10 under 60% (overperiod), Day #17 under 70% (underperiod)
Daily AT40 (T2108)
")
Black line: AT40 (T2108) (% measured on the right)
Red line: Overbought threshold (70%); Blue line: Oversold threshold (20%)
Weekly AT40 (T2108)

*All charts created using freestockcharts.com unless otherwise stated
The charts above are my LATEST updates independent of the date of this given AT40 post. For my latest AT40 post click here.
Related links:
The T2108 Resource Page
You can follow real-time T2108 commentary on twitter using the #T2108 or #AT40 hashtags. T2108-related trades and other trades are occasionally posted on twitter using the #120trade hashtag.
Be careful out there!
Full disclosure: no positions