
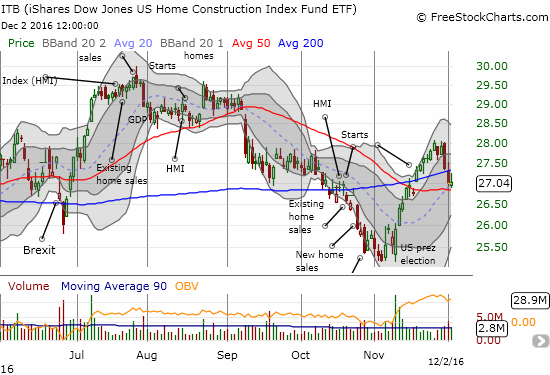
The last Housing Market Review covered data reported in September for August, 2016. At that time, iShares US Home Construction (ITB) was at the tail-end of an extended sell-off. I noted the irony of the acceleration of selling in the wake of a new home sales number that was the second-highest of this post-recession period. A singular spike in long-term interest rates marked the end of the worst of the selling, and a bottom finally came on November 3rd. I looked at the carnage as a likely buying opportunity. A month later, the reaction to the U.S. Presidential election has complicated my strategy a bit.
Source: FreeStockCharts.com
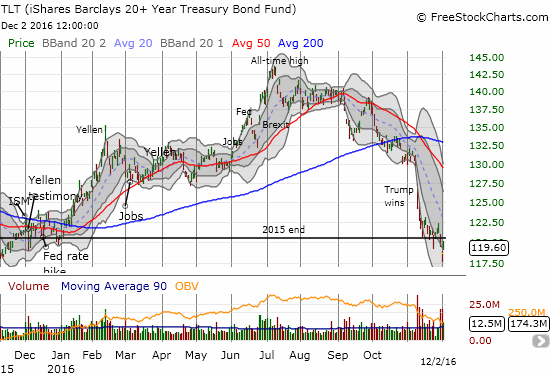
The presidential election brought hopes of an even stronger U.S. economy and with it more momentum for the housing market. The iShares US Home Construction (ITB) initially sold off on the resulting surge in long-term interest rates but recovered by the end of the day with a gain. ITB rallied from there with the rest of the market until this past week. The 50-day moving average (DMA) held as tenuous support. I seized upon the selling to get started on my play on the seasonally strong period for the stocks of home builders; I started with a handful of April ITB call options. I plan to accumulate more shares and options form here through the end of the year. I anticipate angst before and/or after the Federal Reserve’s December meeting to generate at least one more good buy-the-dip opportunity.
In the meantime, the housing data reported in November revealed a housing market that remains as strong as ever. Starts and sales of existing homes printed fresh post-recession highs. Sales of new homes still sit just off post-recession highs. Sentiment for home builders have stabilized at lofty levels. The market’s response to rising mortgage rates looms as the biggest wildcard for an otherwise encouraging picture for the housing market.
Source: FreeStockCharts.com
New Residential Construction (Housing Starts) – October, 2016
After four straight months of downward revisions, housing starts for single-family homes have received two upward revisions in a row. September’s privately owned 1-unit housing starts were revised from 783,000 units to 785,000. October starts increased 10.7% month-over-month and soared 21.7% year-over-year to 869,000. Single-family starts achieved a new post-recession high and have not been this high since October, 2007.
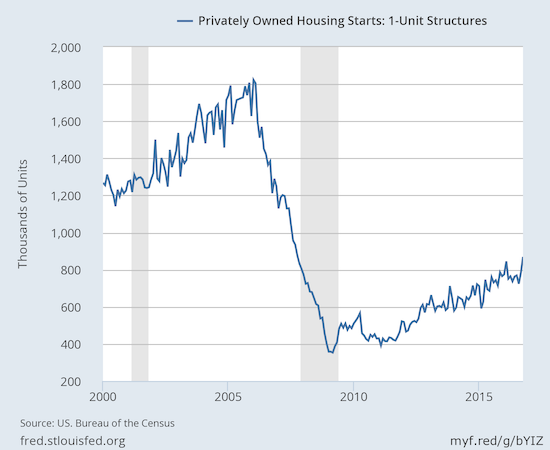
Source: US. Bureau of the Census, Privately Owned Housing Starts: 1-Unit Structures [HOUST1F], retrieved from FRED, Federal Reserve Bank of St. Louis, November 30, 2016.
Starts increased year-over-year across all regions. This is the second straight month of regional unison and confirms my claim from the last Housing Market Review that housing starts are “back on track.” The West led the way with a very robust 35.2% year-over-year gain. The South was a distant second with a 21.4% gain. All regions gained month-over-month as well.
Existing Home Sales – October, 2016
July ended a four-month streak of gains for existing home sales and represented the first year-over-year decline since November, 2015 and only the second such decline in the previous 21 months. August delivered another monthly decline but resumed (marginally) the year-over-year gains. September put existing home sales on solid footing, and October delivered validating follow-through. The seasonally adjusted annualized sales of 5.6M were up 2.0% month-over-month from an upwardly revised 5.49M in sales for September. Year-over-year sales saw an impressive gain of 5.9% to notch the highest sales level since February, 2007.
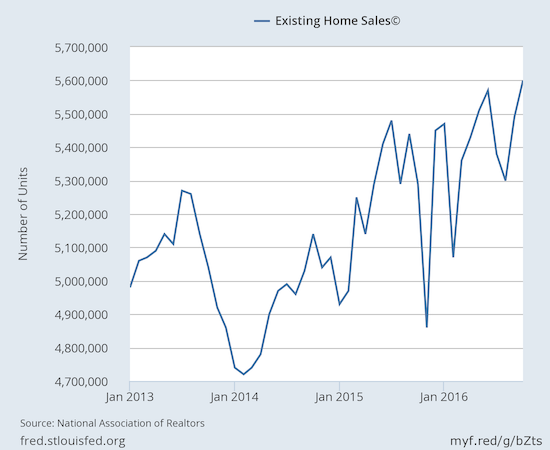
Source: National Association of Realtors, Existing Home Sales© [EXHOSLUSM495S], retrieved from FRED, Federal Reserve Bank of St. Louis, December 1, 2016.
These exceptionally strong sales results occurred even with the continuation of the on-going trends of shrinking inventory and rising median prices. The NAR has consistently complained about these factors as impediments to the market. So, I found it strange to read the NAR attribute these strong sales to the release of pent-up demand that was held back by low inventory.
“‘October’s strong sales gain was widespread throughout the country and can be attributed to the release of the unrealized pent-up demand that held back many would-be buyers over the summer because of tight supply…Buyers are having more success lately despite low inventory and prices that continue to swiftly rise above incomes.'”
This is a “non-explanation” since inventory is as tight as ever (see below). The NAR did not even attempt to explain why the low inventory situation was an impediment over the summer but not so much in the fall. I would have guessed rising mortgage rates provided some motivation but that explanation falls flat given the lack of similar moves in new home sales (see next section).
The irony thickened as the NAR cited rising wages as a factor maintaining demand even though the organization also noted that prices are rising “swiftly above incomes”…
“The good news is that the tightening labor market is beginning to push up wages and the economy has lately shown signs of greater expansion. These two factors and low mortgage rates have kept buyer interest at an elevated level so far this fall.”
Stepping away from the month-to-month volatility, I think the data demonstrate underlying fundamental strength in demand. Rising prices and tightening inventory are more symptoms of this strong demand rather than major impediments to the demand. The NAR’s back and forth on symptom to cause was on display the previous two months when in August the NAR worried that higher incomes were not driving stronger sales of existing homes but the next month applauded the strength of first-time home buyers in driving existing sales. With sales at a 9-year high, first-time buyers actually dropped as a share of sales from 34% to 33% although this is up year-over-year from 31%.
In August, inventory cratered 10.1% year-over-year and in September it dropped 6.8% year-over-year. While that was a monthly increase, October’s inventory dropped 0.5% on a monthly basis. On a year-over-year basis, the inventory declined 4.3% to 2.02M homes. Inventory has now declined year-over-year for 17 straight months. Months of inventory marginally decreased from 4.4 to 4.3 months of supply.
Investors retreated slightly again as a share of sales. In October that share dropped from 14% to 13% which is the same share as in August. The share was 11% in July. As context, recall July’s share was the lowest share since 9% in July, 2009. In February, investors bought 18% of existing homes which was the highest share since April, 2014.
In May and June, the West was the only region in the country to experience year-over-year drops in exiting home sales. In July, every region suffered year-over-year declines. In August, no region experienced a year-over-year decline. In September, the South was the only region to experience a year-over-year decline. For October, sales were so strong that every region experienced year-over-year gains: Northeast +1.4%, Midwest +6.3%, South +4.7%, West +10.4%. Median prices jumped in every region.
October’s 6.0% year-over-year increase in the median price of an existing home represents the 56th consecutive month of year-over-year increases. August’s median price across all housing types of $232,200 is the fourth monthly decline (September was $234,200) after June set an all-time record of $247,700. I am still wondering whether this slowing pace is helping to encourage additional buyers even as the price trajectory is a function of demand.
Single-family home sales once again fared roughly the same as overall existing sales. Single-family sales increased on a monthly and yearly basis. The median price declined from September’s $235,700 but increased on a year-over-year basis…
“Single-family home sales increased 2.3 percent to a seasonally adjusted annual rate of 4.99 million in October from 4.88 million in September, and are now 6.6 percent above the 4.68 million pace a year ago. The median existing single-family home price was $233,700 in October, up 5.9 percent from October 2015.”
{video added January 1, 2017}
New Residential Sales – October, 2016
New home sales were the big headline in August as July sales soared to a fresh post-recession high. I predicted that post-recession peak would not get challenged until the next Spring selling season. The latest data on sales seem to further validate my assessment.
New single-family home sales hit 563,000 for October, marking a decline of 1.9% from September’s 574,000 sales (a downward revision from the originally reported 593,000 sales). Sales increased 17.8% year-over-year which maintains a torrid sequence: September was up 29.8% year-over-year, August was up 20.6% year-over-year, July was up 31.3% year-over-year, and June was up 25.4% year-over-year.
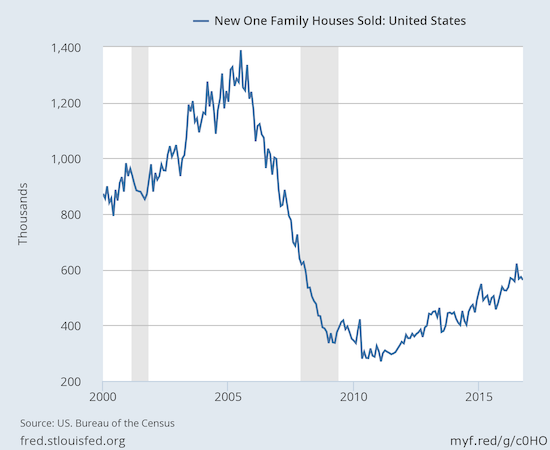
Source: US. Bureau of the Census, New One Family Houses Sold: United States [HSN1F], retrieved from FRED, Federal Reserve Bank of St. Louis, October 30, 2016.
New home inventory increased notably from 4.8 to 5.2 months of supply. Inventory was 4.6 months in August, 4.3 months in July and 4.9 months in June.
The West confirmed its turnaround from laggard to bright spot in the new home sales report. During the 5 months prior to June, the West suffered year-over-year declines in sales. The West had a robust summer with year-over-year sales increases of 24.6% (3rd ranked region), 11.4% (4th ranked region), and 35.0% (2nd ranked region), June through August respectively. September delivered a 32.4% year-over-year gain (3rd ranked region right behind the Midwest’s 33.3%). In October, the West finally led all regions with a 28.7% year-over-year gain. The South was a distant second at 17.9%. The Northeast was the one region that dropped year-over-year (-6.3%). My earlier worries about sales in the West have become a distant memory.
New home sales are beginning a notable divergence from the blistering upward trend of housing starts. Home builders must be racing to get ahead of what they must anticipate to be a very robust Spring 2017 selling season. I am keeping a close eye on this dynamic. For example, if increasing mortgage rates have any cooling impact on home sales, builders may hit a bit of an air pocket in business just as a swell of starts come to market.
Home Builder Confidence: The Housing Market Index– October, 2016
The Housing Market Index (HMI) started the year at 61 and then went four straight months at 58. In June, the HMI came to life again with a jump to 60 but dropped back to 58 for July. For August, the HMI was revised downward from 60 to 59 which made September’s 65 reading and post-recession high look like an even stronger jump. October dipped to 63, and I claimed at the time it was no cause for concern. For November, the HMI stabilized at 63. The National Association of Home Builders (NAHB) noted that this reading was taken before the election but still showed that “…the single-family housing sector continues to show slow, gradual growth” supported by “ongoing job creation, rising incomes and attractive mortgage rates.”
Two of the three components of the HMI rose. Significantly, the component for sales expectations in the next six months fell by two points. This component was the only one which gained (by one point) in October’s data. With housing starts climbing at a blistering pace, I do not want to see this component decline at all!
Click for a larger view…
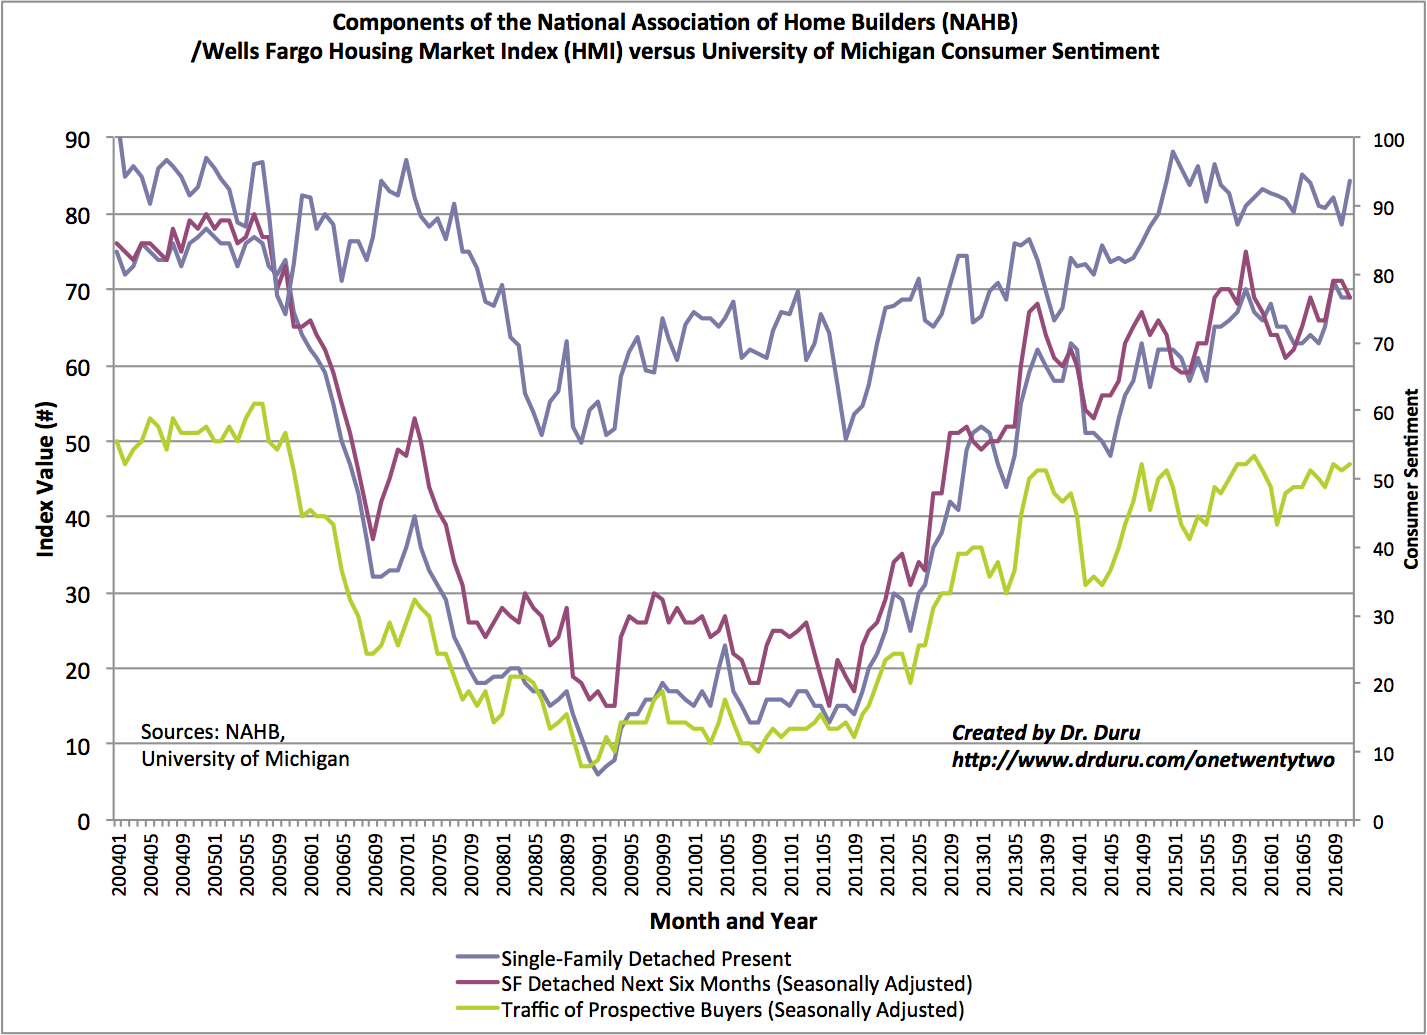
Source: The National Association of Home Builders (NAHB)
On a regional basis, the West’s HMI recovered a bit from September’s 8-point plunge. This recovery is important given the stronger showing in sales and starts in the West. Along with the Northeast and Midwest, the West gained 2 points. The South stayed at 66.
Parting thoughts
Once again, the housing data look as good as ever. As long as the housing data retain this strength, I will stay focused on buying opportunities in the stocks of home builders. Before the election, the stocks of home builders were looking bad and getting worse. I relished the opportunity to shop for bargains, but the election put a firm end to the selling. The trading in the past week may have put a cap on the buying for now.
In the last Housing Market Review, I showed how regional home builders were losing some of their advantage over the more regionally diversified builders. LGI Homes (LGIH) bounced off its 200DMA support but this week came tumbling back to that critical long-termsupport line. Tri Pointe Group (TPH) rebounded but hit a brick wall of resistance at its converged 50 and 200DMAs. Century Communities (CCS) rebounded and almost closed at a fresh 52-week high. CCS now trades exactly where it was during the last Housing Market Review.
Meritage Homes (MTH) experienced one of the most impressive bounces: from bottom to top, MTH gained over 20%. This performance puts MTH at the top of my “buy-the-dip” list whenever I make the next set of purchases in individual builders.
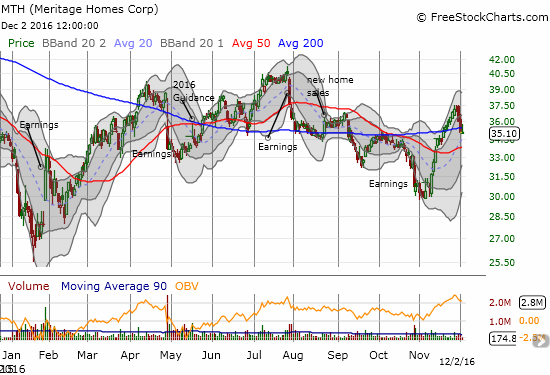
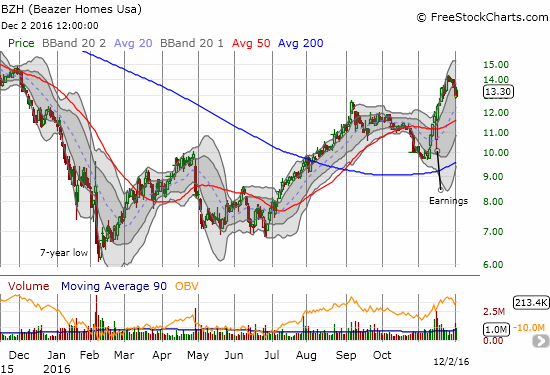
Source: FreeStockCharts.com
Beazer Homes (BZH) is not part of my regular universe of home builders because I do not like its persistently sub-standard business performance. Earlier this year, BZH managed to notch a 7-year low. Yet, I found a LOT of encouragement in the recent response to another poor earnings report. On November 15th, BZH reported another loss on lower deliveries and increased SG&A expenses. BZH gapped down and traded as low as 14% off the previous day’s close. By the end of trading, BZH was almost flat with the previous close. The buying momentum continued from there. This trading behavior suggests buying interest is out there shopping for perceived bargains. I plan to join the action for future clearance sales during this seasonally strong period for home builder stocks.
Be careful out there!
Full disclosure: long TPH, long ITB call options