
In past Housing Market Reviews, I observed a notable shift in housing activity from the West to the South. I have wondered aloud whether this disparity comes from economic choices moving households from relatively expensive markets in the West to relatively more affordable ones in the South. It turns out the IRS has some of the best data on migration patterns…but with a two-year delay. The IRS recently released its latest data on migration which covers 2013 to 2014. Author Wendell Cox wrote in Newgeography.com a summary of the data which are derived from tax returns. The IRS describes its data and methodology as follows:
“Migration data for the United States are based on year-to-year address changes reported on individual income tax returns filed with the IRS. They present migration patterns by State or by county for the entire United States and are available for inflows—the number of new residents who moved to a State or county and where they migrated from, and outflows—the number of residents leaving a State or county and where they went.”
Cox notes that income tax returns cover about 80% of the population and, unlike Census data, count actual people.
On an absolute basis, Texas and Florida led all states for net migration. These results, while two years old, are very consistent with the current housing data. This migration patterns has been in place for most years since at least 2000. Cox’s chart makes the dominance of Texas and then Florida abundantly clear!
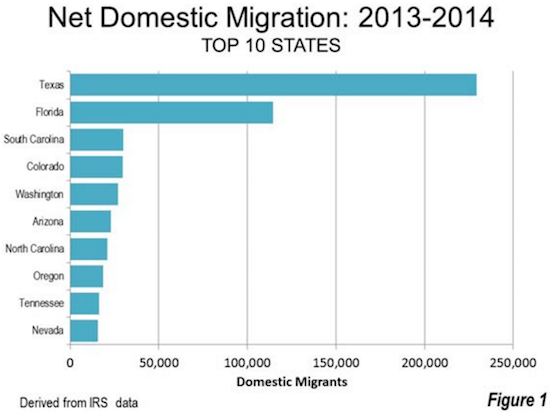
Source: newgeography
On the losing side of migration are most of the U.S.’s remaining major population centers. California ranks third in size of the net outflow. Note that California is the only state in the West in this bottom loser’s list. Given California is the least affordable and most populous state in the West, these data are consistent with today’s housing data even if it cannot explain the entire migration story assuming the patterns hold true today.
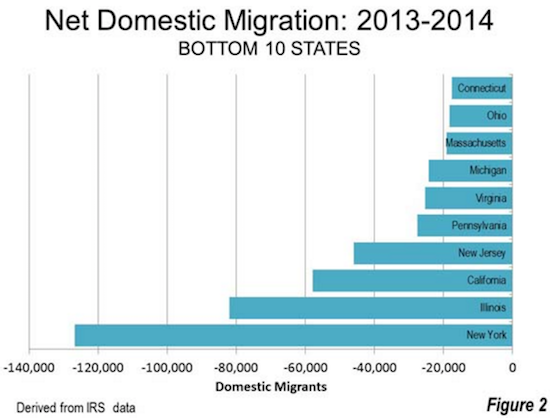
Source: newgeography
Tracking the money is another revealing way of understanding migration patterns. Florida leads all states by a wide margin with 30.5% of incoming migrants earning average incomes (per capita) higher than the Florida average. South Carolina ranks a distant second at 18.6%. The out-migrant data are even more interesting. While Maine leads the pack with 20.1% of out-migrants earning more than the Maine average, California is a close second at 19.7%. This means that, more so than other states, the relatively well-off in Maine and California are choosing to save money and take their incomes elsewhere. However, California also ranks 6th in the percentage of in-migrants who earn above the state’s income average (around 7%).
Further complicating the migration story are the Western states of Oregon, Arizona, and Nevada that no doubt attract a good number of Californians. These Western states are in the top 10 of those attracting net positive migration (as shown in the chart above). Cox points out that Texas was actually a top 10 net exporter of people until the most recent data where Pennsylvania replaced it. I am guessing the last oil boom helped push Texas off the list.
These data are suggestive but only brush the surface of the raw price pressures facing Californian residents. When I read Cox’s article, two recent stories immediately came to mind. They are not tales of people leaving California in the rearview mirror, but we can think of them as starting points.
Just last week, a highly publicized example came from Palo Alto, CA (in Silicon Valley). Kate Vershov Downing, a member of the city’s Planning and Transportation Commission, published her resignation and publicly announced that the cost of housing was a large part of the reason. Despite her and her husband’s high incomes, the combined incomes are simply not enough to afford living Palo Alto.
“My family has decided to move to Santa Cruz. After many years of trying to make it work in Palo Alto, my husband and I cannot see a way to stay in Palo Alto and raise a family here. We rent our current home with another couple for $6200 a month; if we wanted to buy the same home and share it with children and not roommates, it would cost $2.7M and our monthly payment would be $12,177 a month in mortgage, taxes, and insurance. That’s $146,127 per year — an entire professional’s income before taxes. This is unaffordable even for an attorney and a software engineer.”
I realize that the average American will NOT shed a tear over this tale of woe. Santa Cruz is a great place to live with a beachside view; it is expensive enough to be out of reach for many Californians. Yet, this story is still important for noting just how expensive the most desirable cities have become. Downing is essentially lamenting that her former hometown has become an exclusive enclave for the super-rich. Downing goes on to warn about the inability of Palo Alto workers to afford living in or even anywhere near the city where they work.
“It’s clear that if professionals like me cannot raise a family here, then all of our teachers, first responders, and service workers are in dire straits. We already see openings at our police department that we can’t fill and numerous teacher contracts that we can’t renew because the cost of housing is astronomical not just in Palo Alto but many miles in each direction.”
Downing goes on to criticize a City Council that has failed to address this severe housing imbalance (with supply-side solutions). She sees a city incapable of supporting families and eventually ceasing to exist as a real community.
“Over the last 5 years I’ve seen dozens of my friends leave Palo Alto and often leave the Bay Area entirely. I’ve seen friends from other states get job offers here and then turn them down when they started to look at the price of housing. I struggle to think what Palo Alto will become and what it will represent when young families have no hope of ever putting down roots here, and meanwhile the community is engulfed with middle-aged jet-setting executives and investors who are hardly the sort to be personally volunteering for neighborhood block parties, earthquake preparedness responsibilities, or neighborhood watch.”
Downing’s trials and tribulations were not news to Palo Alto’s newly hired school superintendent. He was featured in an article a year ago that noted how his generous $1M no-interest loan from the district still was insufficient to buy a home in Palo Alto. To Downing’s point, a real estate agent specializing in Palo Alto and nearby Atherton noted:
“We’re relegated to marketing mostly to tech buyers, or international buyers. People on salaries just can’t really afford to buy in Palo Alto anymore.”
The superintendent got the loan bumped up to $1.5M but still might have to “settle” for a condo.
Sarcastically, one might be tempted to call these episodes the gentrification of the middle class especially when compared to what is happening across the Bay in Oakland.
At the end of June, MarketWatch wrote about a rap group called Zion I who created a rap and video inspired by the forced exodus from Oakland of member Stephen Gaines. The description on the video simply states “This song was written in response to the rapid gentrification happening in Oakland, CA.” Zion I blames the high salaries of workers in high tech for the changes. Many workers are fleeing the high costs of living in San Francisco and moving across the Bay Bridge to Oakland. This migration is part of what I call a “housing microclimate” in which a steady migration from Silicon Valley toward the East Bay is underway. Thus the appropriate title of this song: “Tech $.”
Gaines wanted to stay in Oakland but could not afford the $4000/month in rent. He and his family went across the border to more affordable San Leandro. Surely it is only a matter of time before “tech money” follows suit!
Oakland’s housing inventory is severely constrained so the migration is pushing up rents at an incredible pace. In 2014, the city enacted tighter rent control on 60,000 units. Still, last year, I was able to write about an escalating housing crisis in Oakland in a piece titled “Pent-Up Housing Demand Meets Reticent Supply: A Focus On Oakland, CA.”
These tales of cost squeezes in the San Francisco Bay Area are a starting point for understanding a key driver of people leaving the state of California altogether. These stories are anecdotes that find confirmation in an annual poll conducted by The Bay Area Council. The poll covers people’s opinions about the health and desirability of the Bay Area. The poll is called The Pulse of the Bay and includes questions on housing and people’s plans to move.
The Bay Area Council ran its 2016 online poll from February 12 to March 9, 2016. The poll features 1,000 respondents with a margin of error +/- 3.1 percentage points.
The press release provides a summary of the headline result: “One Third of Bay Area Residents Planning to Leave Region”…
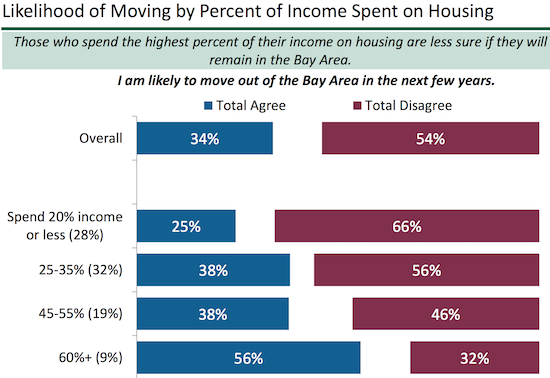
“The urge to leave is strongest among residents who have been here the shortest time, those making lower incomes and those paying a larger share of income for housing. Despite the 34 percent of residents who are eyeing an exit, another 54 percent said they’re not going anywhere. And among those looking to leave, just 13 percent felt strongly about it while 31 percent of residents felt strongly about staying put…
Given a set list of issues, 25 percent of Bay Area residents ranked cost of living, which is often associated with housing costs, as the region’s most serious problem followed by housing at 23 percent and traffic at 13 percent…
64 percent of residents identified cost of living among their top three problems for the Bay Area, with 48 percent citing housing in the top three and 39 percent ranking traffic among the region’s top problems.”
It is important to note that the survey is heavily skewed toward people who have lived in California for a long time. Sixty-four percent of people have lived in California more than 20 years and another 14% have lived in California 11 to 20 years. Moreover, the majority of respondents own their homes (55%) and are likely more inclined to stay put and tough things out. I did not see a segmentation of answers for renters versus owners. The survey was for adults only, and this year’s survey managed to achieve an exact 50/50 gender split.
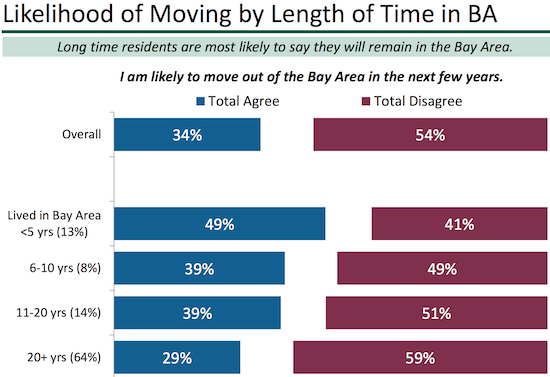
Source: Bay Area Council
These are the seeds of discontent in the San Francisco Bay Area and perhaps are most emblematic of an expensive state. As long as home builders continue to focus on high-end housing in the state and land for development stays scarce, the solutions will be few and far between. At some point of course, the high-end buyers will have to run low if the land does not run out first. For this reason, I keep a close eye on what is happening in the West in comparison to other housing markets. While a price-driven slowdown does not need to lead to a bust, such an economic event could certainly have outsized impact on the builders who have staked their fortunes on the state. Stay tuned for future Housing Market Reviews to track how this plays out.
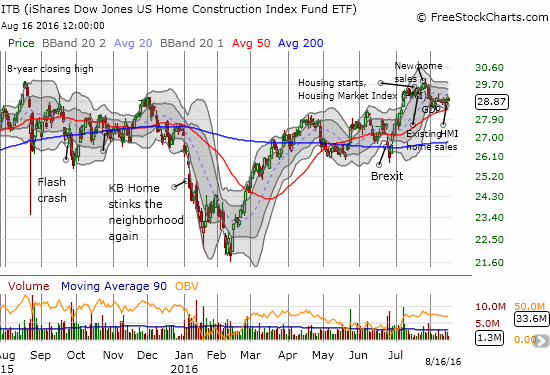
Source: FreeStockCharts.com
Be careful out there!
Full disclosure: no related positions