
(T2108 measures the percentage of stocks trading above their respective 40-day moving averages [DMAs]. It helps to identify extremes in market sentiment that are likely to reverse. To learn more about it, see my T2108 Resource Page. You can follow real-time T2108 commentary on twitter using the #T2108 hashtag. T2108-related trades and other trades are occasionally posted on twitter using the #120trade hashtag. T2107 measures the percentage of stocks trading above their respective 200DMAs)
T2108 Status: 35.2%
T2107 Status: 54.0%
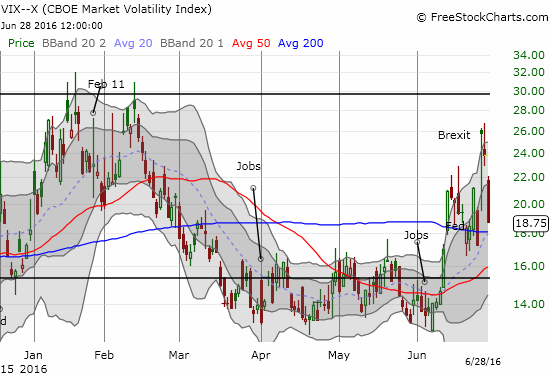
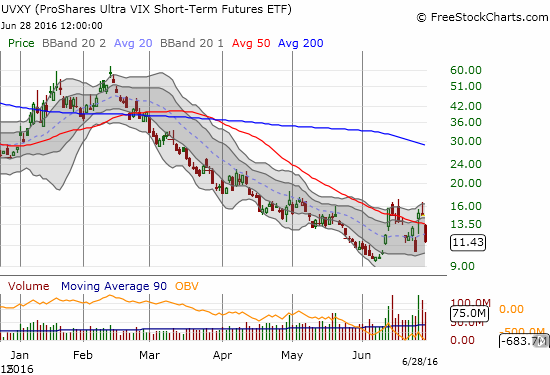
VIX Status: 18.8 (fell 21.4%!)
General (Short-term) Trading Call: bearish
Active T2108 periods: Day #95 over 20%, Day #1 over 30% (ending 1 day under 30%), Day #1 under 40%, Day #3 under 50%, Day #3 under 60%, Day #13 under 70%
Commentary
Art Cashin calls the Brexit bottom…
Tired of the Brexit headlines yet? This week is dedicated to Brexit fallout. The drama should become much less salient as the summer wears on and offers new dramas to captivate the market. For now, Brexit remains a hot topic relative to where it was during the massive run-up into the referendum vote…
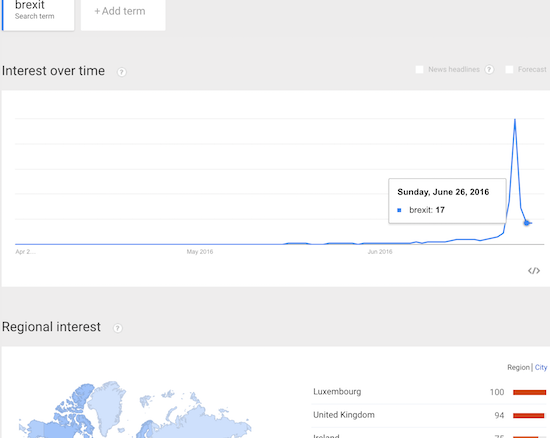
Source: Google Trends
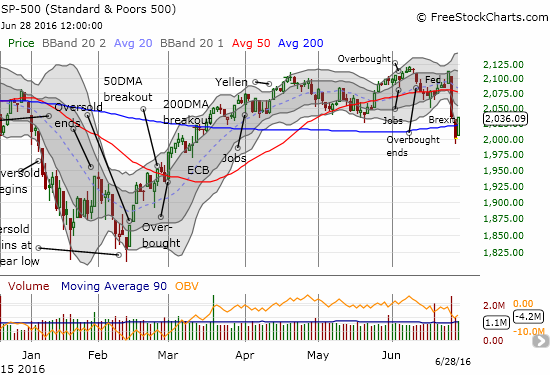
The stabilization in Brexit interest could be considered a precursor of “turnaround Tuesday’s” major relief rally. It was a picture-perfect bounce form the (quasi) oversold conditions I described in the last T2108 Update. T2108 jumped from the edge of oversold territory (it got as low as 24.5%) and closed at 35.2%, the open of Monday’s gap down. The S&P 500 (SPY) reversed all its losses from Monday with a 1.8% gain. Talk about a seesaw and a whiplash! Just like that, the S&P 500 flipped from a bearish 200DMA breakdown to a bullish recovery which makes the 2000 level look like support and returns the 200DMA to support status.
The volatility index, the VIX, took a MAJOR hit. The VIX continued its surprising decline from Monday. It turns out that contrasting weakness was likely the confirming signal that the market was ready to rally today. While the VIX remains above its 200DMA, it is once again below 20, the level of “elevated fear.”
With my trading bias firmly rooted in bearishness, this relief rally was just what the doctor ordered to deliver entry points for my list of short candidates. Granted, throughout the day I wondered whether I should instead hop aboard the bull train and assume that Monday’s close encounter with oversold conditions delivered a classic wash-out of panicked sellers. A second day of high volume buying confirmed by changing conditions in the currency markets COULD convince me to make a play for a restest of 50DMA resistance. Regardless, my trading call stays at bearish given last week’s sharp tumble form the edge of overbought territory (part of my T2108 trading rules).
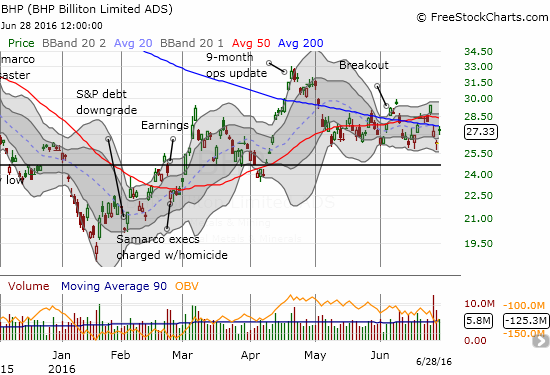
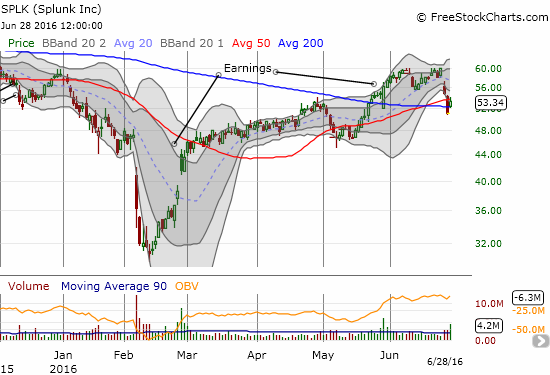
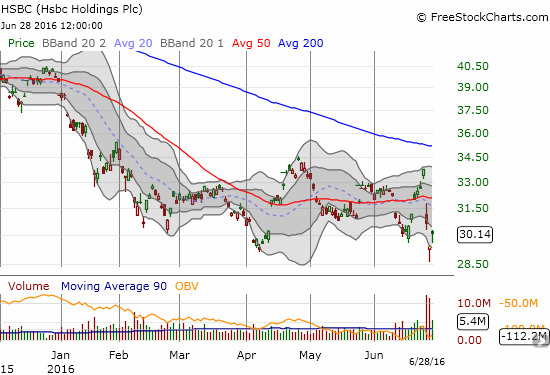
In the morning, I stuck to my trading plan and set several limit orders to buy put options at discounts from wherever they traded at the open. They all filled one-by-one throughout the trading day. Interestingly enough, my order for put options on ProShares Ultra S&P500 (SSO) triggered last. For the day, I triggered the following bearish positions: short BHP Billiton (BHP) to complete the iron ore pairs trade and put options in Splunk (SPLK), HSBC Holdings plc (HSBC) (doubled down on existing position), First Solar (FSLR), and even Facebook (FB). The Facebook puts actually went green for a bit, but I chose to hold on (per my lesson about locking in profits too quickly). I may have to return to flipping quickly out of positions if the market continues gyrating form day-to-day.
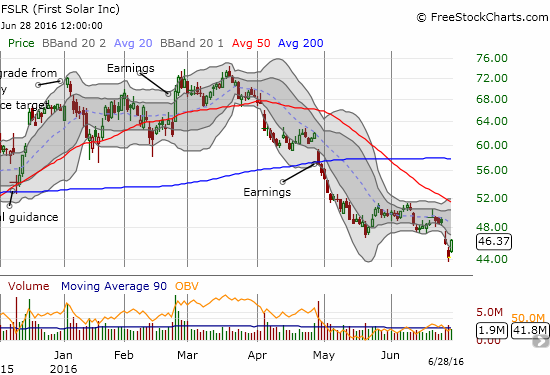
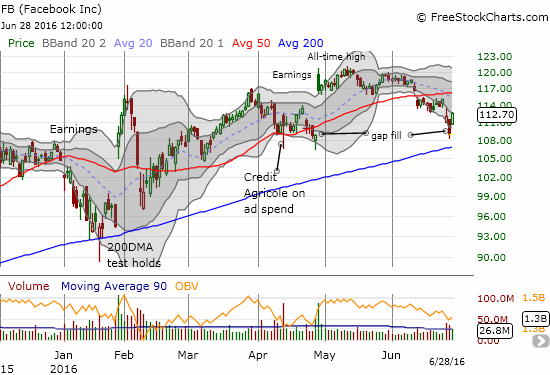
If you are bullish on the market, you can probably make a bullish case for many of these charts. The bear-bull tug is likely to dominate trading for several weeks going forward.
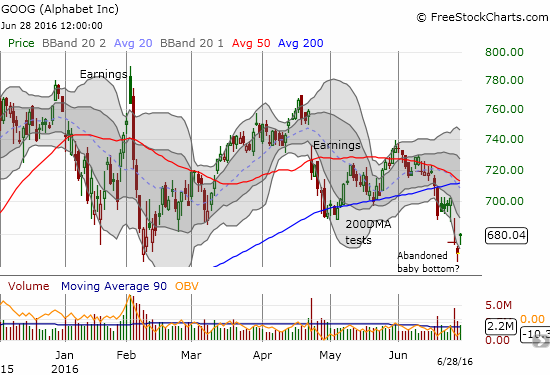
I also launched a hedged position in Alphabet (GOOG). If I were not bearish, I would look at GOOG’s chart and declare a hammer bottom good for at least a rebound to converged resistance at the 50 and 200DMAs – similar to HSBC. On an intraday basis, GOOG managed to lose almost all its gains from the initial gap up before rallying into the close. So, sellers may still have an edge in GOOG.
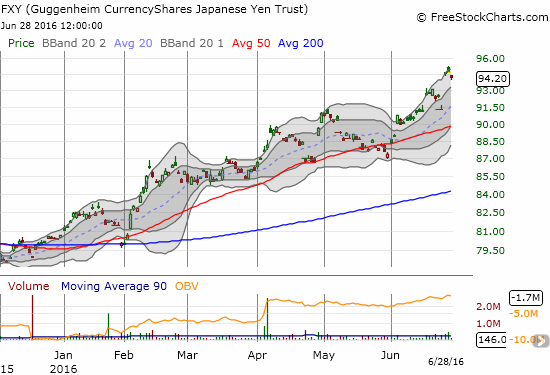
Although the market rallied bigtime, the Japanese yen did not decline nearly as much as I would have expected. This reluctance forms a minor caution flag for Wednesday. I took the opportunity to load up on more put options on CurrencyShares Japanese yen ETF (FXY). Unfortunately, an implosion of volatility reduced the value of the positions I initiated in the wake of Friday’s Brexit fall-out. I still think shorting the yen is one of the best hedges against bearishness: there is on-going potential for the Bank of Japan to intervene and weaken the yen, and it is hard to imagine stocks rallying much from here if the yen also holds firm.
On the bullish side, I bought Ciena (CIEN) and CyberArk (CYBR) for what I thought made good setups for a rally day. Neither one closed far from its open, and CYBR attracted weak volumes. CIEN even briefly broke support. Needless to say I was dismayed by these performances especially in light of the beating I took in a few outstanding bearish positions. I am holding both for at least one more day, maybe the rest of the week.
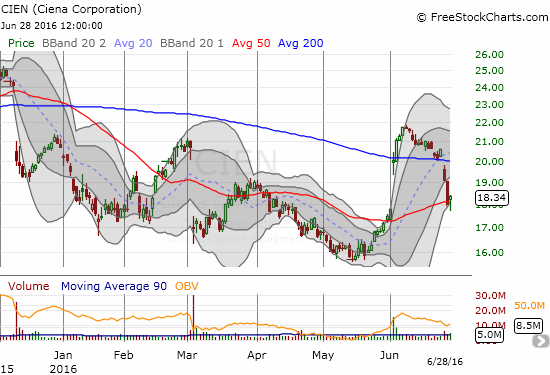
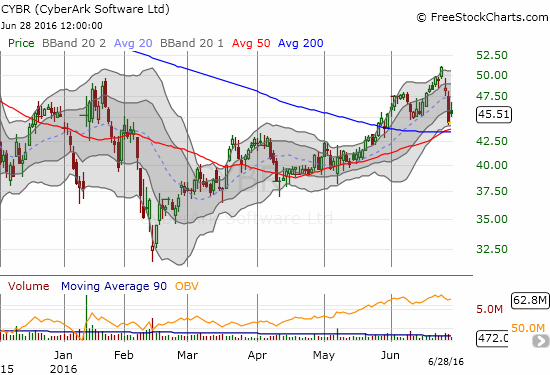
I am hoping I had just a bit of bad luck in these choices and look to these stocks out-performing during the next market rally day.
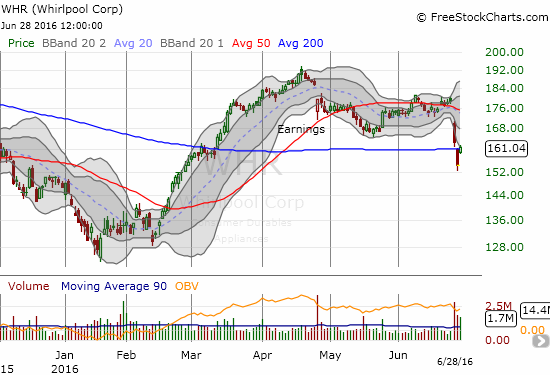
I am expecting analysts to trim earnings estimates given the incrementally cloudier outlook for the global economy. So far, nothing major. Indeed, Whirlpool (WHR) took the initiative by reaffirming full-year guidance and assuring investors that the company is ready to handle any Brexit-related fallout:
“The Company regularly performs risk assessments as part of the operational planning cycle and has prepared for either outcome of the vote. In the past, the Company has utilized a variety of approaches to manage volatility, including financial hedging. The Company plans to execute a previously-announced cost based price increase in the third quarter and expects to continue with strong ongoing cost productivity programs to lower overall costs in the EMEA region.
‘As we have done in the past in all markets, we are prepared to take swift actions to offset the negative impact to our EMEA operations…We will continue to monitor the situation closely to determine if additional actions may be required.'”
It was a great day for reassurances as WHR rode the wave to a 4.3% gain and closed just above 200DMA resistance. Still, the stock triggered one of my setups for a bearish trade. I expect the stock to resume its sell-off at some point: the stock gapped down in response to previous earnings and did not quite make it into the gap. I have also noted that WHR has set itself up for disappointing investors in a big way in future 2016 quarters: EMEA will not be the only market under pressure.
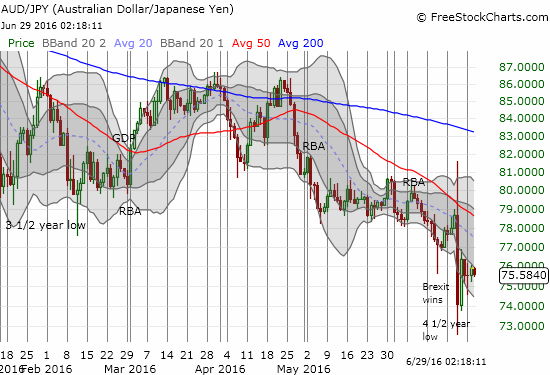
In currency markets, the Australian dollar (FXA) is still caught in its downward trending channel versus the Japanese yen (FX). I will be watching this pair closely to gauge sentiment.
— – —
Reference Charts (click for view of last 6 months from Stockcharts.com):
S&P 500 or SPY
U.S. Dollar Index (U.S. dollar)
EEM (iShares MSCI Emerging Markets)
VIX (volatility index)
VXX (iPath S&P 500 VIX Short-Term Futures ETN)
EWG (iShares MSCI Germany Index Fund)
CAT (Caterpillar).
IBB (iShares Nasdaq Biotechnology).
Daily T2108 vs the S&P 500
")
Black line: T2108 (measured on the right); Green line: S&P 500 (for comparative purposes)
Red line: T2108 Overbought (70%); Blue line: T2108 Oversold (20%)
Weekly T2108

*All charts created using freestockcharts.com unless otherwise stated
The charts above are the my LATEST updates independent of the date of this given T2108 post. For my latest T2108 post click here.
Related links:
The T2108 Resource Page
Be careful out there!
Full disclosure: long UVXY shares and put options, long put options on FXY, SSO, WHR, SPLK, HSBC, FSLR, and FB; long put spread on GOOG; long calls on GOOG; short AUD/JPY; long shares in CYBR and CIEN