
(T2108 measures the percentage of stocks trading above their respective 40-day moving averages [DMAs]. It helps to identify extremes in market sentiment that are likely to reverse. To learn more about it, see my T2108 Resource Page. You can follow real-time T2108 commentary on twitter using the #T2108 hashtag. T2108-related trades and other trades are occasionally posted on twitter using the #120trade hashtag. T2107 measures the percentage of stocks trading above their respective 200DMAs)
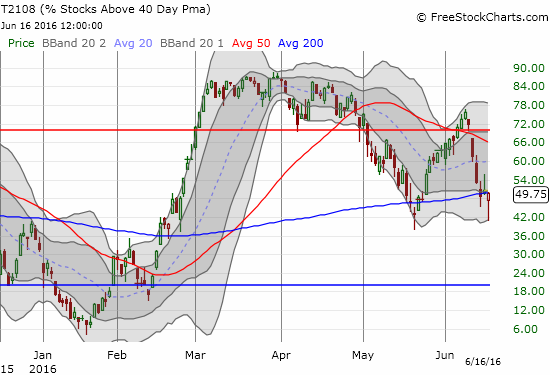
T2108 Status: 49.8% (was as low as 40.7%!)
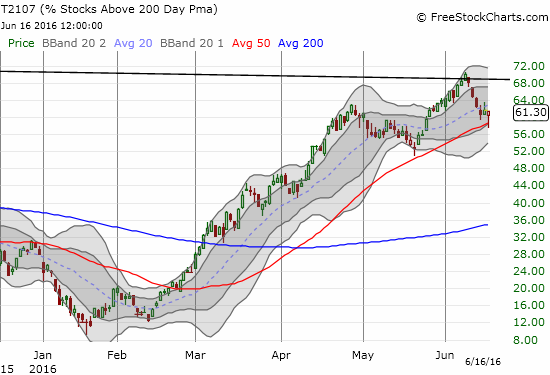
T2107 Status: 61.3%
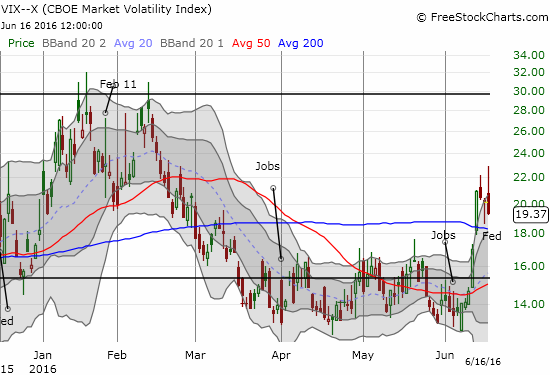
VIX Status: 19.4 (down 3.6%, was as high as 22.9, a 4-month high)
General (Short-term) Trading Call: bearish
Active T2108 periods: Day #87 over 20%, Day #86 over 30%, Day #83 over 40%, Day #3 under 50%, Day #4 under 60%, Day #5 under 70%
Commentary
It was the worst of times, it was the best of times.
Serious whiplash was in effect on the day. T2108 dropped as low as 40.7% before closing the day at 49.8%. While this close essentially matches the closing low of the week, the move demonstrates the challenge sellers still face in trying to break this market. Sellers had control for exactly one hour before the entire nature of trading changed: the seachange at 10:30am Eastern looked like synchronized whiplash.
- The S&P 500 (SPY) bottomed
- The volatility index, the VIX, topped out
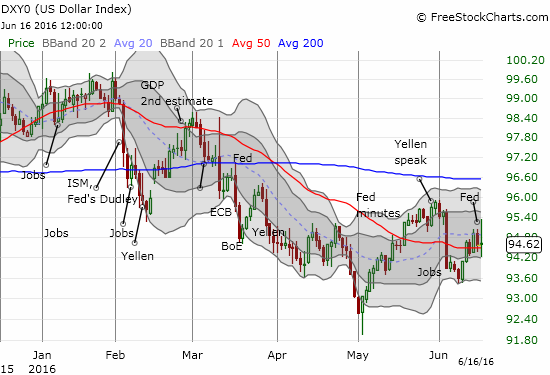
- The U.S. dollar index (DXY0) topped out
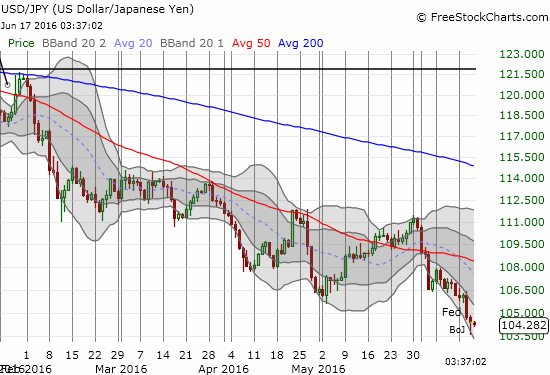
- The Japanese yen (FXY) topped out – even against the U.S. dollar
- Gold (GLD) topped out even though the dollar did as well. (See “A Potential Blow-Off Top for Gold” for more on gold).
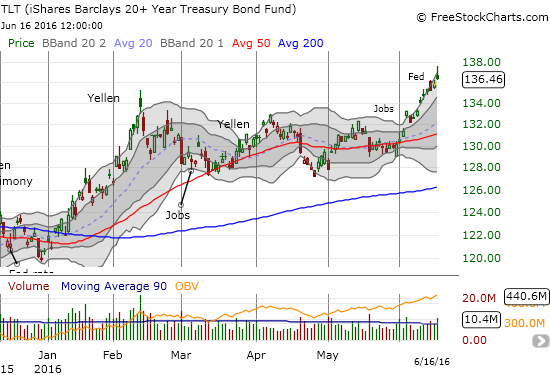
- The iShares 20+ Year Treasury Bond (TLT) topped out by failing a retest of an earlier intraday high
Surprisingly enough, oil did not participate in this synchronization. United States Oil (USO) sold off for at least half the day, including right through the 10:30am turnstyle, and never managed much of an intraday rally. So, I will start the chartfest with USO. Dollar up or dollar down, USO has sold off steadily since its last high on June 8th – the same day the S&P 500 last peaked. The breakout above the 200-day moving average (DMA) is starting to look like a fake-out, especially given the S&P 500 finally had a day where it distinctly diverged from oil prices. This moment is very important; before this breakout, USO last traded above its 20DMA about two years ago.
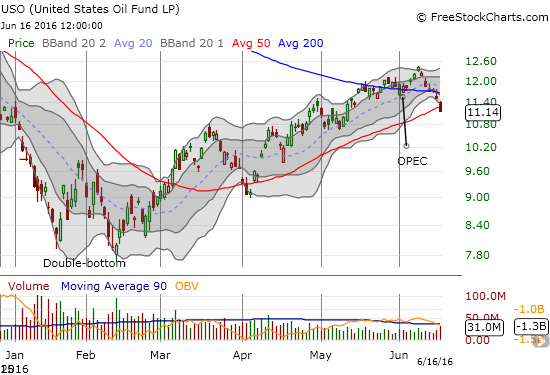
I am not sure yet what to make of the divergence, but this development has to be important to monitor given the tight correlation that has existed for so long between oil and the stock market.
The S&P 500’s intraday bottom and divergence from oil ended a 5-day losing streak. The index gained 0.3%. At its low of the day, the S&P 500 reversed all of the run-up that started with the 50DMA breakout on May 24th.
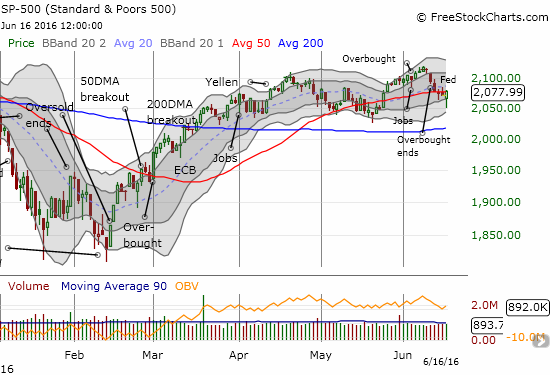
The baton of proof now goes to buyers who need to close the index above 50DMA resistance. Such a move would restore a bullish position for the S&P 500 and put a retest of the recent highs into play (can anyone say chopfest?).
T2108 essentially retested its low from May. This view should encourage the bulls. Moreover, T2107, the percentage of stocks trading above their respective 200DMAs, looks like it made a healthy dip in the middle of a bullish run-up.
The volatility index put on a major fade. At its high, the VIX traded at 22.9. It ended the day with a 3.8% loss and a close below the threshold of “heightened fear” at 20. The counterpunch to the above bullish setups is a VIX that is still in breakout mode above its 200DMA.
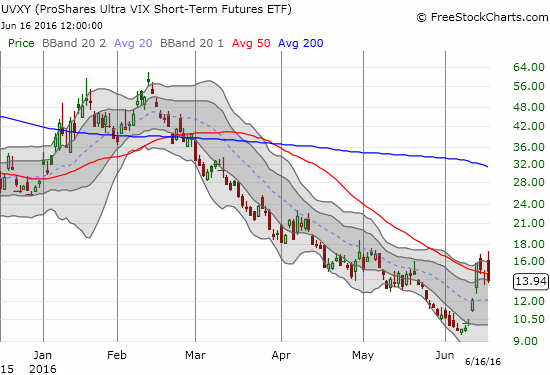
The whiplash in the VIX had an undesirable impact on my volatility trade. As I noted earlier, I sold my put options on ProShares Ultra VIX Short-Term Futures (UVXY) as a part of my anti-volatility pre-Fed trade. I held my shares in ProShares Short VIX Short-Term Futures (SVXY) in the hopes volatility could keep fading. Unfortunately, on the way to that fade, my position in SVXY stopped out soon after the open. To add salt to the wounds, UVXY just kept tumbling as I executed my phased switch to position bullishly into volatility.
The dollar index swung wide and far. At its high, it looked like the U.S. dollar was serving as a safety currency. The dollar managed to close above 50DMA support. I continue to expect a lot of chop ahead.
The Japanese yen is the conventional safety currency. After the Bank of Japan (BoJ) stood still on monetary policy, traders rushed for yet more yen. U.S. trading changed the momentum on a dime. However, the bounce could prove very temporary given the yen is still pulling down hard and relentlessly on currency pairs.
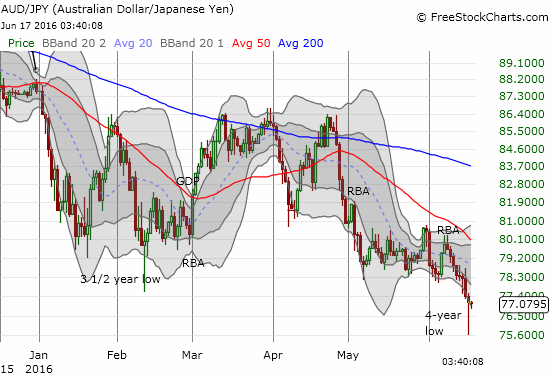
Speaking of divergences, the Australian dollar versus the Japanese yen, AUD/JPY, has fared very poorly in recent weeks. Yet, the S&P 500 has fought through a lot of AUD/JPY heaviness. The index has even survived a new 4-year low just fine. Still, I add the current breakdown to the list of bearish signals for the market.
Finally, TLT’s contribution to the synchronized whiplash ended well in-line with its prevailing short-term trend. After TLT topped out, it closed just off its upper-BB and maintained the steep uptrend along this line.
This mix of bullish tidings and bearish signals suggests a chopfest is on its way as traders bounce from fear to bargain-hunting. I am keeping the trading call at bearish given the S&P 500 did not break through 50DMA resistance. Even if/when this breakout occurs, I will not switch bullish and likely go cautiously bearish. Only a break above the all-time high signals a bullish change. I am also looking for at least one more run-up in volatility going into next week’s Brexit vote.
— – —
Reference Charts (click for view of last 6 months from Stockcharts.com):
S&P 500 or SPY
U.S. Dollar Index (U.S. dollar)
EEM (iShares MSCI Emerging Markets)
VIX (volatility index)
VXX (iPath S&P 500 VIX Short-Term Futures ETN)
EWG (iShares MSCI Germany Index Fund)
CAT (Caterpillar).
IBB (iShares Nasdaq Biotechnology).
Daily T2108 vs the S&P 500
")
Black line: T2108 (measured on the right); Green line: S&P 500 (for comparative purposes)
Red line: T2108 Overbought (70%); Blue line: T2108 Oversold (20%)
Weekly T2108

*All charts created using freestockcharts.com unless otherwise stated
The charts above are the my LATEST updates independent of the date of this given T2108 post. For my latest T2108 post click here.
Related links:
The T2108 Resource Page
Be careful out there!
Full disclosure: long GLD, net long the U.S. dollar, a mix of positions against the Japanese yen, long UVXY shares and put options, hedged USO position of calls and puts (long and short)