
In early May, 2016, the SPDR Gold Shares (GLD) hit a new 15-month high. At that time, I considered the prospects for a blow-off top in GLD. I concluded that a top had not yet arrived but would likely come “sometime” over the horizon. I used Google Trends, one of my favorite tools for analyzing gold sentiment, as well as the positioning of speculators in futures contracts. Today, the technicals delivered what looks like a blow-off top in the SPDR Gold Shares (GLD).
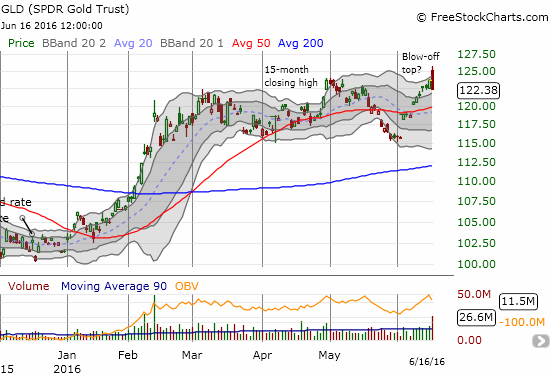
Source: FreeStockCharts.com
This chart has all the characteristics sufficient to describe a blow-off top:
- A breakout or surge to a new intraday high – in this case, at its high of the day, GLD hit a near 2-year high that just topped 2015’s high.
- A subsequent sell-off (or “fade”) form the day’s high that ends the day with a loss and breaks the low of the previous day.
- A surge in trading volume, preferably an extreme – in this case, GLD traded at 2.5x the 90-day average volume and hit levels not seen since February 11th. (Recall Feb 11th as THE bottom for the big sell-off that delivered a nasty start to the year). Volume is a key element of the blow-off top because it indicates that the run-up finally exhausted buyers. After the “last” buyer eagerly rushes in, only motivated sellers are left to dominate the trading action.
The only thing left is confirmation.
Most importantly, will sellers continue to drag GLD downward? A break of support at the 50-day moving average (DMA) would confirm a top. A subsequent rally that ends at the intraday high as resistance would confirm a top.
From a sentiment standpoint, I will be watching for a surge in “buy gold” in Google Trends. Regular readers know that such a surge is a sufficient condition to predict or confirm a change in direction for GLD, but it is not necessary. On a daily basis, the sentiment has indeed increased along with the GLD run-up. The last data point in the chart below is from Tuesday, June 14th.
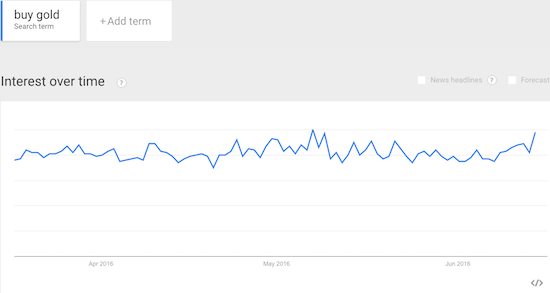
Source: Google Trends
While the daily trend is suggestive, my sentiment model for Google Trends does not use such granular moves. I have effectively used more aggregate views: weekly and monthly. Both views are early since the data do not include today’s potential blow-off event. The weekly is suggestive but the monthly is far too incomplete.
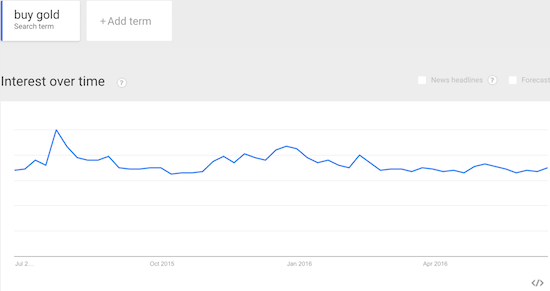
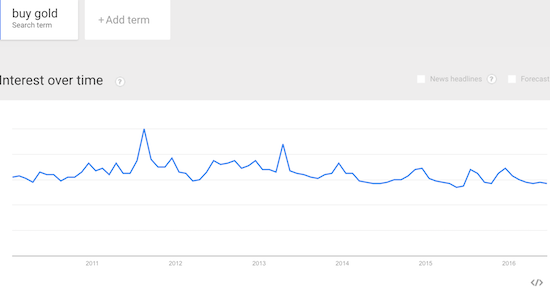
Source: Google Trends
The CFTC’s data on speculator positioning arrives Friday evening. I eagerly await that report to see whether speculators made major moves as of last Tuesday in gold (or even silver).
This potential blow-off top shifts my trading strategy for GLD. Normally, I would short such a chart, but as a rule, I do not short gold. So, my approach here is just to sit on my core GLD position and stay away from any further short-term trades on gold-related positions.
I hope to have a definitive call on a top for GLD within a week. That analysis will also include changes in the U.S. dollar index and the market’s expectations for the next rate hike from the U.S. Federal Reserve.
Full disclosure: long GLD