
(T2108 measures the percentage of stocks trading above their respective 40-day moving averages [DMAs]. It helps to identify extremes in market sentiment that are likely to reverse. To learn more about it, see my T2108 Resource Page. You can follow real-time T2108 commentary on twitter using the #T2108 hashtag. T2108-related trades and other trades are occasionally posted on twitter using the #120trade hashtag. T2107 measures the percentage of stocks trading above their respective 200DMAs)
T2108 Status: 82.3%
T2107 Status: 59.0% (highest since September, 2014)
VIX Status: 13.3
General (Short-term) Trading Call: cautiously bullish
Active T2108 periods: Day #48 over 20%, Day #47 over 30%, Day #44 over 40%, Day #41 over 50%, Day #37 over 60%, Day #36 over 70% (overbought), Day #6 over 80%
Commentary
T2107, the percentage of stocks trading above their respective 200-day moving averages (DMAs), remains the new star of the show. Today, this technical indicator moved to heights last seen in September, 2014.
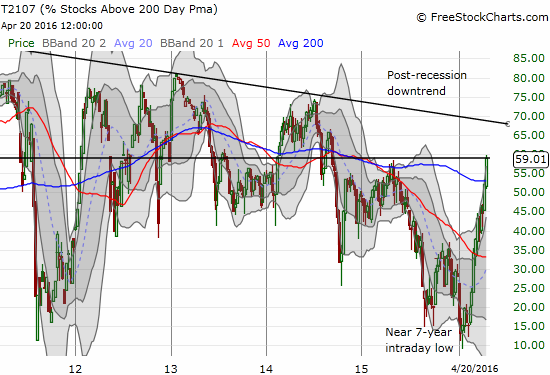
I drew out the longer-term chart as a reminder that the post-recession downtrend looms as a serious threat to the health of the market’s advance. The market still has a ways to go before hitting the worry-meter, but I have to imagine that once/if T2107 hits this downtrend, the market may finally run out of room for pushing stocks higher. Note that such a test of resistance will happen with T2108 about as high as it can go in an extremely extended overbought position. Stay tuned on this one.
The S&P 500 (SPY) is powering along with T2107. Much to my surprise, the hardy index has easily hurtled most of the resistance from the November to December, 2015 warning period.
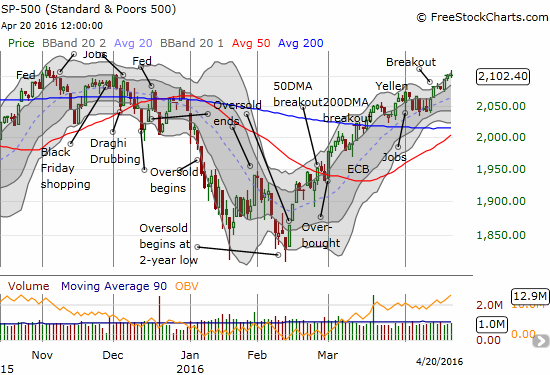
The last all-time high was set on May 21, 2015 at 2130. I have to blink twice to consider the potential for fresh all-time highs given what we have suffered through this year!
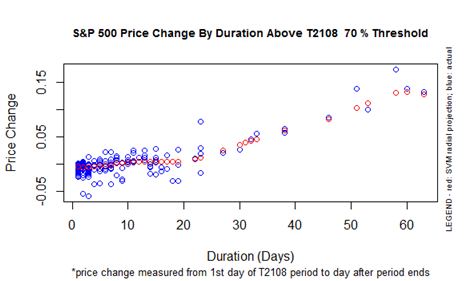
At the same time, T2108, the percentage of stocks trading above their respective 40-day moving averages (DMAs), is churning along in the 80s again. At this height, T2108’s movement is not nearly as relevant as T2107. However, it IS important to note that the overbought period has stretched to 36 days. This is clear lift-off territory. The S&P 500 is up 6.3% for this overbought period – right around the expected performance IF the overbought period ended today. Note how few overbought periods have lasted as long as this one.
Given the market’s growing strength, I am not surprised that the VIX is scraping recent lows. I AM surprised the VIX bounced strongly off intraday lows and ended the day with a slight gain. I am not sure what to make of the move especially since the Federal Reserve is meeting next week. Perhaps the market was bracing for some big company’s earnings? Regardless, the Fed meeting should be yet another market-soothing event.
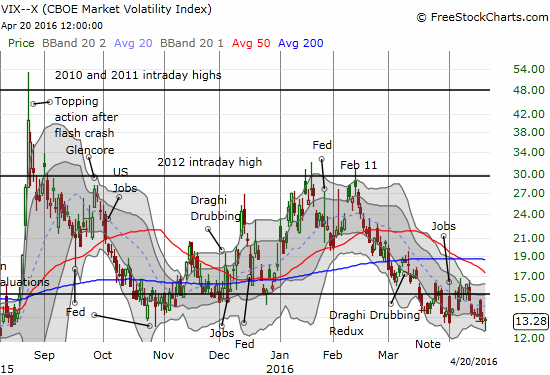
The super-low VIX keeps my bullishness at a cautious level. In fact, I cannot imagine a condition where I get more bullish than my current bias. The market’s underlying strength is impressive, but ultra-low volatility leaves the market very vulnerable to shocks. Without fail, low volatility leads to high volatility and high volatility leads to low volatility. This is a classic market truism.
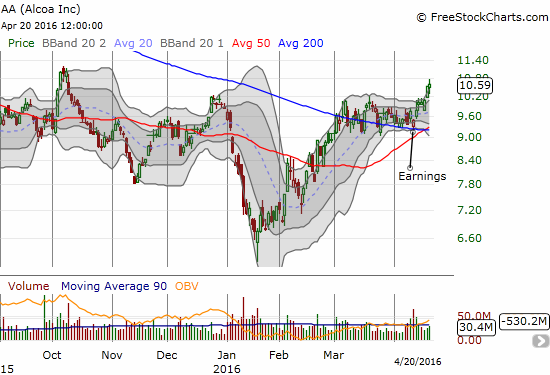
Earnings season started last week with Alcoa (AA). The stock gapped down but closed off its lows. The stock has since broken out and confirmed support at its 200DMA. AA demonstrates the eagerness of buyers AND the on-going strength of commodities that will not be denied. (Note I FINALLY wrote an update on my opinion on commodities in “Rio Vs. BHP: A Very Attractive Pairs Trade Opportunity“).
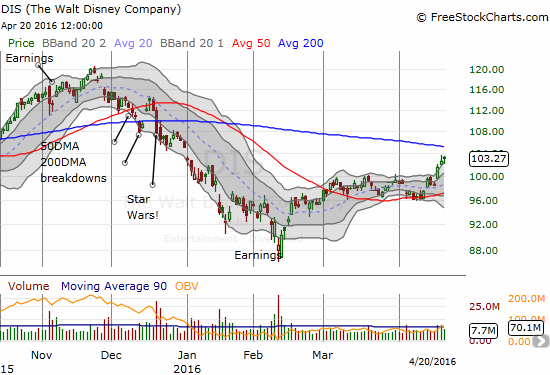
Disney (DIS) has a LOT of catching up to do. That process may have finally begun with its brekaout this week from a 6-week consolidation. The 200DMA looms overhead to create the next hurdle for a stock that I think is VERY under-valued.
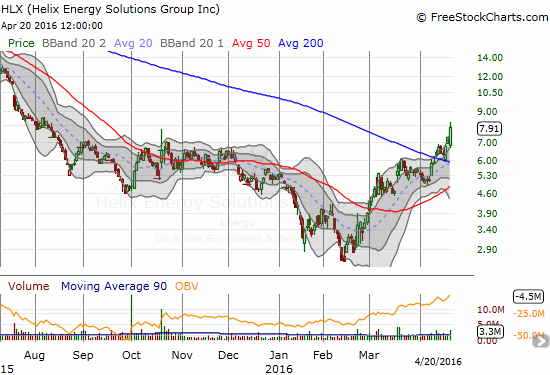
$HLX post-earnings surge is confirming 200DMA breakout
— Dr. Duru (@DrDuru) April 20, 2016
Helix Energy Solutions Group, Inc. (HLX) is the latest commodities play, this time oil and gas, that I have thrown into the hopper. This is one impressive 200DMA breakout.
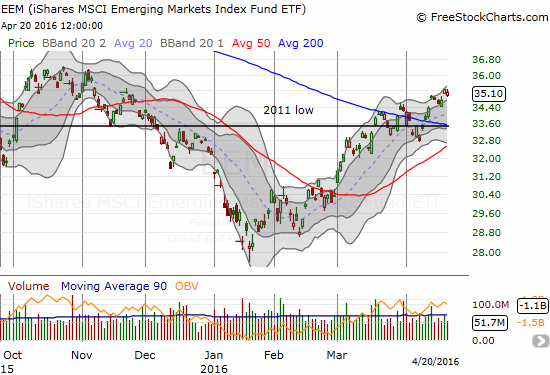
I am so captured by all these bullish 200DMA breakouts that I even got back into iShares MSCI Emerging Markets (EEM) options..on the call side..with no hedge.
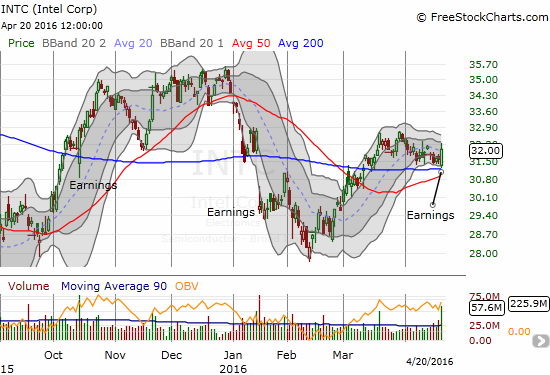
Intel (INTC) reported earnings and was down over 2% at one point in after-market trading. The stock gapped down right to its 200DMA support and never looked back. Noticing a pattern yet? While INTC has not yet confirmed this support with a close above the current consolidation, the stock is doing its best to hang in there. I am watching these developments very closely.
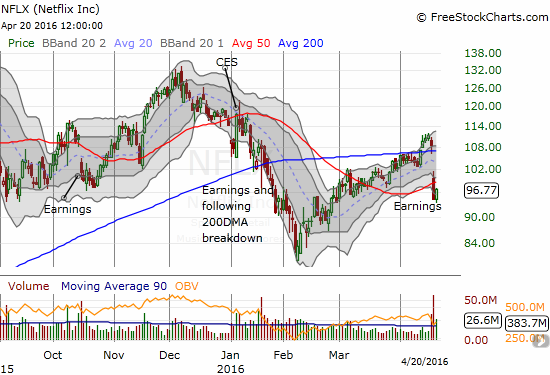
Since I am cautiously bullish, I have to post a bearish chart. Here is Netflix (NFLX) which suffered a post-earnings 50DMA breakdown. I faded today’s pop with put options: I am anticipating NFLX’s failure to break through 50DMA resistance.
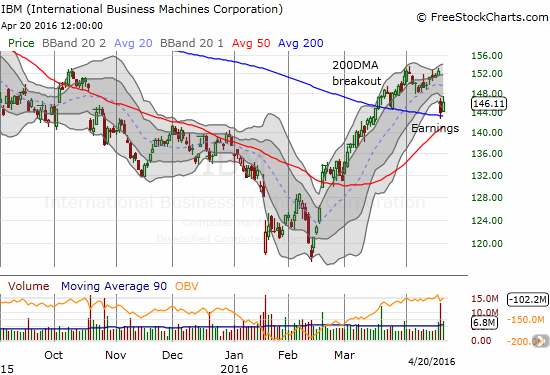
And just in case you are STILL not convinced of the importance of the 200DMA, here is (formerly?) lowly International Business Machines Corporation (IBM) which just reported yet another decline in revenue. The stock gapped down, traded ever so briefly below its 200DMA, and the next day rallied. The quickly rising 50DMA suggests IBM has a good chance to hold support. Still, it needs to quickly break free of the descending channel created by the lower Bollinger Bands (BBs).
— – —
For readers interested in reviewing my trading rules for an oversold T2108, please see my post in the wake of the August Angst, “How To Profit From An EPIC Oversold Period“, and/or review my T2108 Resource Page.
Reference Charts (click for view of last 6 months from Stockcharts.com):
S&P 500 or SPY
U.S. Dollar Index (U.S. dollar)
EEM (iShares MSCI Emerging Markets)
VIX (volatility index)
VXX (iPath S&P 500 VIX Short-Term Futures ETN)
EWG (iShares MSCI Germany Index Fund)
CAT (Caterpillar).
IBB (iShares Nasdaq Biotechnology).
(Reload page and/or click on the image, if it is not correct. At time of writing, server is having cache issues)
Daily T2108 vs the S&P 500
")
Black line: T2108 (measured on the right); Green line: S&P 500 (for comparative purposes)
Red line: T2108 Overbought (70%); Blue line: T2108 Oversold (20%)
Weekly T2108

*All charts created using freestockcharts.com unless otherwise stated
The charts above are the my LATEST updates independent of the date of this given T2108 post. For my latest T2108 post click here.
Related links:
The T2108 Resource Page
Expanded daily chart of T2108 versus the S&P 500
Expanded weekly chart of T2108
Be careful out there!
Full disclosure: long DIS call options, long EEM call options, long IBM put options, long HLX shares, long NFLX put options