
(T2108 measures the percentage of stocks trading above their respective 40-day moving averages [DMAs]. It helps to identify extremes in market sentiment that are likely to reverse. To learn more about it, see my T2108 Resource Page. You can follow real-time T2108 commentary on twitter using the #T2108 hashtag. T2108-related trades and other trades are occasionally posted on twitter using the #120trade hashtag. T2107 measures the percentage of stocks trading above their respective 200DMAs)
T2108 Status: 28.8%
T2107 Status: 17.7%
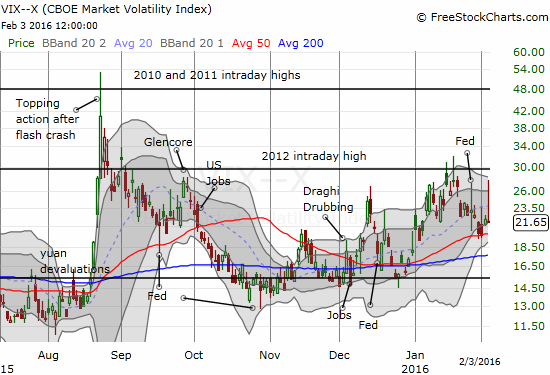
VIX Status: 21.7 (faded from a high of 27.7!)
General (Short-term) Trading Call: bullish
Active T2108 periods: Day #4 over 20% (overperiod), Day #22 under 30% (underperiod), Day #38 under 40%, Day #42 below 50%, Day #57 under 60%, Day #398 under 70%
Commentary
@maoxian – today's stock market was a waterfall followed by a whale jumping in the pool!
— Dr. Duru (@DrDuru) February 4, 2016
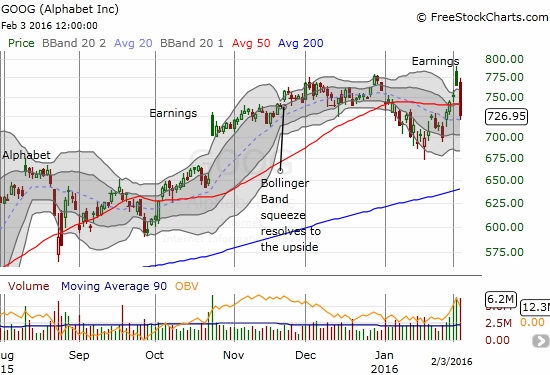
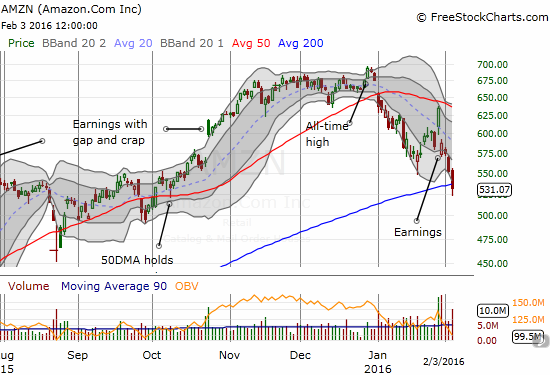
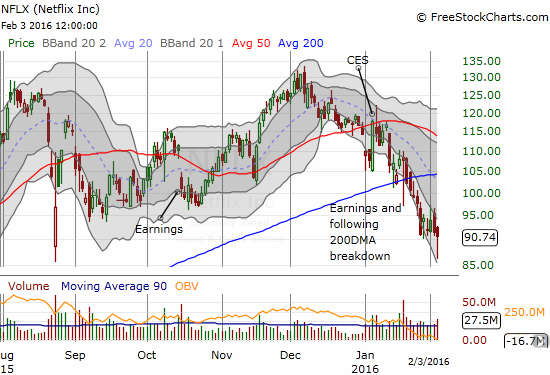
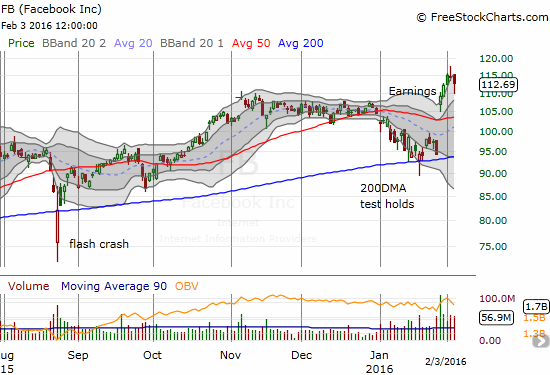
Wednesday was a wacky day of trading. The “waterfall” came in the form of the typical market leaders continuing a cascade of weakness that is out-of-step with the stock market’s emergence from oversold trading conditions. Google (GOOG) has already reversed all its post-earnings gain. Amazon.com (AMZN) closed below its 200-day moving average (DMA) for the first time since January, 2015. Netflix (NFLX), which has continued to sell off after a wild post-earnings day, touched its flash crash lows before rallying to a smaller loss on the day. “Full Bull” Facebook (FB) was down as much as 3% before rallying to cut that loss in about half. (Amazing how we have come full circle to put our faith in a small group of out-performing internet-related stocks!)
A whale jumped into the pool around 2pm: sellers went scrambling for cover and buyers rushed in to enjoy the uplift of water from the bottom and onto safe ground at the close. The 5-minute chart of the S&P 500 (SPY) shows that one 5-minute block completely changed the feel and sentiment of the market.
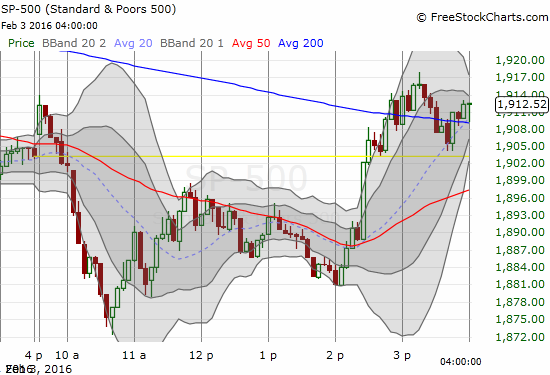
The S&P 500 (SPY) has struggled to generate follow-through bullishness ever since its convincing exit from oversold conditions last Friday. Monday was a stalemate day. Tuesday generated a loss that almost reversed all of Friday’s gain. And today, Wednesday, took the S&P 500 all the way back to the bottom of the base that preceded the breakout. At THAT point, buyers finally showed up and were carried into the close by the whale…
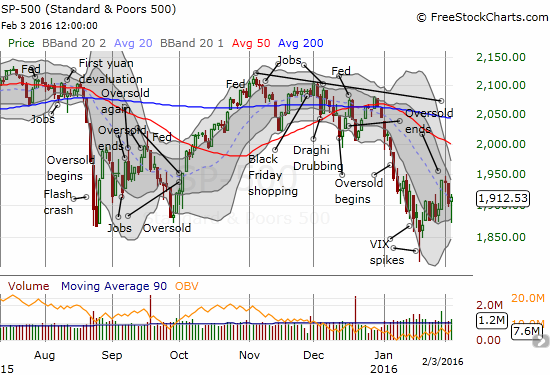
Note that the S&P 500’s move created a bullish hammer candlestick pattern that was replicated across many stocks. Follow-through buying should set the index back on course for the rendezvous I expected with overhead resistance at the 50DMA. As a reminder, I am expecting this retest before the next oversold period begins. Astute traders will notice a Bollinger Band squeeze is developing on the S&P 500. Resolution of this squeeze should form the next major move for the index.
More potentially good news: through all of this churn, T2108, the percentage of stocks trading above their 40-day moving averages, somehow managed to avoid returning to oversold conditions. In fact, with a close at 28.8% near the recent highs, T2108 is actually relatively stronger than the S&P 500. This slight divergence is once again showing that more stocks are starting to participate in the buying action. Think again of the waterfall of leaders getting pushed out the way by the whale or the bulk of the market.
The volatility index, the VIX, put on quite a show, almost the exact opposite of the S&P 500. The VIX surged as high as 27.7, but overhead resistance once again exerted its powers of rejection. The VIX not only turned around but also closed just about where it started. This move almost looks like another exhaustion of panic and fear.
I can best describe the wackiness of the trading by providing a bullet list of all the explanations provided in one article for the action on the day. Multiple catalysts converged on traders to send heads spinning and necks twisting. The following are all quotes from various pundits, analysts, and the author in CNBC’s “Dow, S&P stage sharp turnaround as oil rises 8%” (note that I do not endorse using the Dow Jones Industrial as an indicator of anything real except perhaps market sentiment):
- If you look at the relationship between the the Dow and the S&P, it’s a little off today, meaning that the Dow is leading the S&P…That’s got to do with what’s going on in oil.
- I … believe oil will dictate stock prices…I think it’s safe to say we are highly dependent on oil.
- The lions share of the U.S. economy is services…If we see a slump in [ISM], we’re going to see a sell-off in the market.
- The Dow opened 100 points higher, but fell over 150 points amid the weak ISM reading and the rise in crude inventories. In afternoon trading, however, the blue chips index recovered and closed over 180 points higher.
- We’re in a textbook transition from a bullish environment into a bearish environment…What’s happening now is strength is being sold, not weakness being bought…The inability to make a meaningful bounce off the January lows signals, to me, … we’re in the early stages of a bear market…
- There’s some level that marks the right intersection of where the economy is…The equities market is in the process of finding it.
- …when you start getting more people talking about production cuts…oil has a greater potential to climb back from its lows.
- I think the oil bounce is more of a technical bounce…We’ve had a pretty steep sell-off in oil recently. Equities and oil are very correlated right now, whether right or wrong…At some point, we’re going to have to break from that.
- The problem is that we’ve got generally lousy [earnings] numbers with no hopes of them getting any better
- U.S. futures held near the flatline for most of the morning on Wednesday, before rising on remarks made by New York Fed President William Dudley.
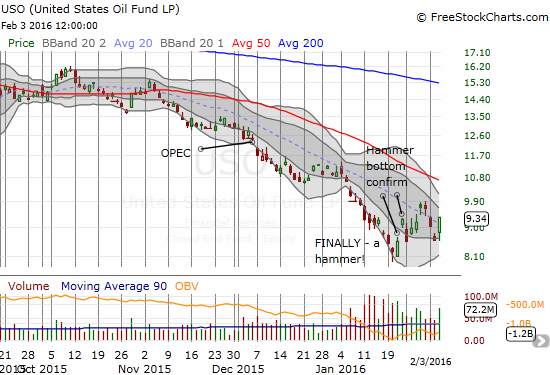
The United States Oil ETF (USO) dipped at first on the oil inventory report but quickly spun around to rally. A close above $10 resumes the rally off the lows and would give me more confidence in my call for a more sustainable bottom.
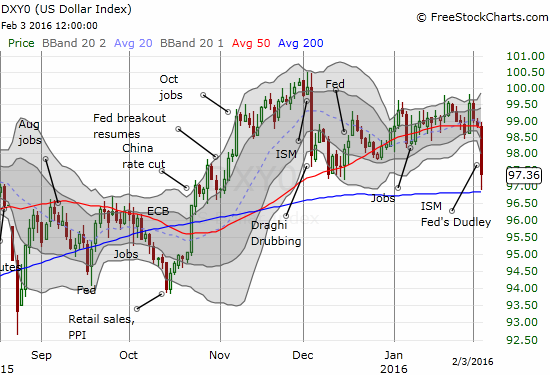
The U.S. dollar index (DXY0) was wild. In one fell swoop, the dollar index made a convincing plunge below its 50DMA and retested its 200DMA.
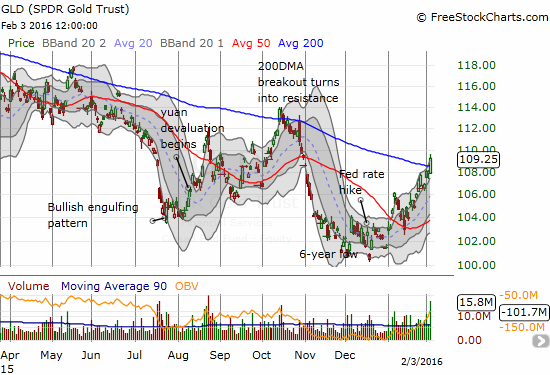
Related to the currency moves, SPDR Gold Shares (GLD) has broken out from 200DMA resistance for the first time since October.
Finally, the market has taken rate hikes completely off the table for 2016. This move is making me rethink my dollar bullishness for the first time in a long while. The market’s reaction to Friday’s U.S. non-farm payrolls may deliver the final tipping point for me.
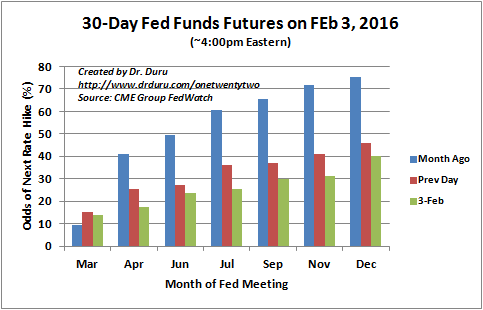
Source: CME Group FedWatch
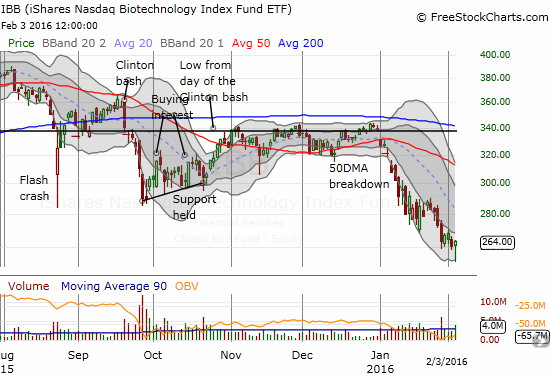
My trading on the day was just as mixed as the market action. I sold my put options on iShares Nasdaq Biotechnology (IBB) in a trade I described in the last T2108 Update. Most of the profit came on the selling this day. Given IBB was not as weak as I expected to start the week, I decided not to hold through Thursday’s Congressional hearing on drug pricing. The good news for bulls and buyers is that IBB managed to print a neat little hammer bottom after the selling ended.
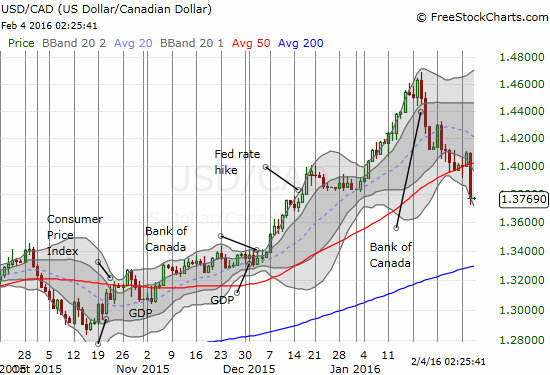
Seeing NFLX break quickly to the downside while the S&P 500 was still up at the open made me rush for put options on NFLX. I have not traded NFLX to the bearish side in a very long time. I took profits quickly on the position. I decided to keep my puts in Caterpillar (CAT) as my main hedge and doubled down near the close. CAT closed at a fresh post-earnings high. I also opened a fresh position in Direxion Daily Russia Bear 3X ETF (RUSS). In forex, I decided to make a play for a rebound in USD/CAD back to the 1.40 pivot. But like my earlier play for USD/CAD to come back down to 1.40, I think I raced too far ahead of the market in my thinking. As the above chart shows, USD/CAD made a substantial breakdown move! On the bullish side, I took advantage of the dip in FB to load up on call options as planned.
In the mistake (so far) column, I tried to play a bounce in AMZN from 200DMA support.
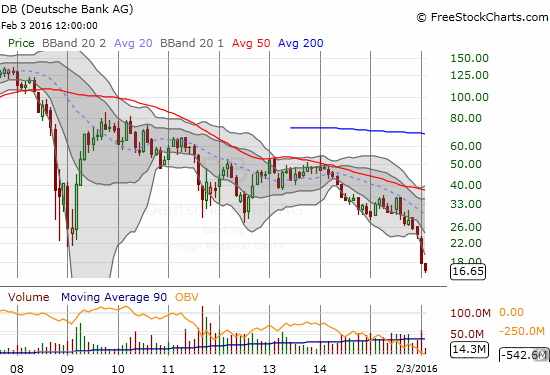
I end with a monthly chart of Deutsche Bank AG (DB). I heard several times during the day about the trouble in financial stocks in the U.S. and in Europe. My antennae are up again as I see that DB is now trading BELOW its 2008-2009 crisis levels – in fact, this is an all-time low!
— – —
For readers interested in reviewing my trading rules for T2108, please see my post in the wake of the August Angst, “How To Profit From An EPIC Oversold Period“, and/or review my T2108 Resource Page.
Reference Charts (click for view of last 6 months from Stockcharts.com):
S&P 500 or SPY
U.S. Dollar Index (U.S. dollar)
EEM (iShares MSCI Emerging Markets)
VIX (volatility index)
VXX (iPath S&P 500 VIX Short-Term Futures ETN)
EWG (iShares MSCI Germany Index Fund)
CAT (Caterpillar).
IBB (iShares Nasdaq Biotechnology).
Daily T2108 vs the S&P 500
")
Black line: T2108 (measured on the right); Green line: S&P 500 (for comparative purposes)
Red line: T2108 Overbought (70%); Blue line: T2108 Oversold (20%)
Weekly T2108

*All charts created using freestockcharts.com unless otherwise stated
The charts above are the my LATEST updates independent of the date of this given T2108 post. For my latest T2108 post click here.
Related links:
The T2108 Resource Page
Expanded daily chart of T2108 versus the S&P 500
Expanded weekly chart of T2108
Be careful out there!
Full disclosure: long SSO call options, long SSO shares, long SVXY shares, short and long UVXY puts, long CAT puts, long FB calls and short shares, long RUSS, long AMZN calls, net long the U.S. dollar, long GLD, short put options and long and short call options on USO, long FXC