
(T2108 measures the percentage of stocks trading above their respective 40-day moving averages [DMAs]. It helps to identify extremes in market sentiment that are likely to reverse. To learn more about it, see my T2108 Resource Page. You can follow real-time T2108 commentary on twitter using the #T2108 hashtag. T2108-related trades and other trades are occasionally posted on twitter using the #120trade hashtag. T2107 measures the percentage of stocks trading above their respective 200DMAs)
T2108 Status: 23.8%
T2107 Status: 23.8% (I don’t think I have ever seen T2107 = T2108)
VIX Status: 20.6
General (Short-term) Trading Call: bullish with a “very short leash”
Active T2108 periods: Day #15 over 20%, Day #3 under 30% (underperiod), Day #19 under 40%, Day #23 below 50%, Day #38 under 60%, Day #379 under 70%
Reference Charts (click for view of last 6 months from Stockcharts.com):
S&P 500 or SPY
SDS (ProShares UltraShort S&P500)
U.S. Dollar Index (volatility index)
EEM (iShares MSCI Emerging Markets)
VIX (volatility index)
VXX (iPath S&P 500 VIX Short-Term Futures ETN)
EWG (iShares MSCI Germany Index Fund)
CAT (Caterpillar).
IBB (iShares Nasdaq Biotechnology).
Commentary
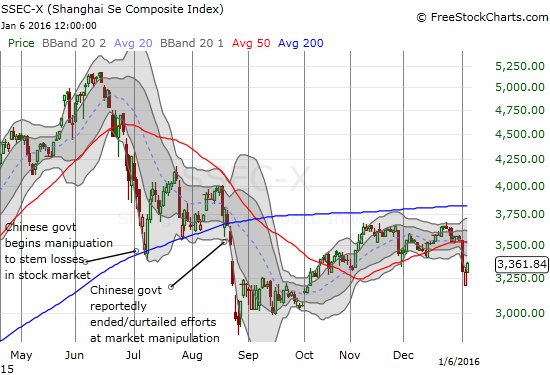
Once again, my summary of the trading action is interrupted by events in China. At some point, the U.S. market will get even more timid and ever more bearish toward closing time as traders and investors fear what could possibly happen next outside of U.S. trading hours. From Yahoo Finance (rearranged for clarity):
“China accelerated the devaluation of the yuan on Thursday…The People’s Bank of China again surprised markets by setting the official midpoint rate on the currency at 6.5646 yuan per dollar, the lowest since March 2011.
That was 0.5 percent weaker than the day before and the biggest daily drop since last August, when an abrupt near 2 percent devaluation of the currency also roiled markets…
Shanghai stocks slid 7 percent to trigger [a] halt in trading…for the second time this week, as a new circuit-breaking mechanism was tripped less than half an hour after the open.”
The impact on currency trading was immediate, but has had little follow-through so far. If the Japanese yen (FXY) holds, any gap down to start U.S. trading could be quickly bought. Similarly, if the yen finds fresh strength ahead of the open – look out.
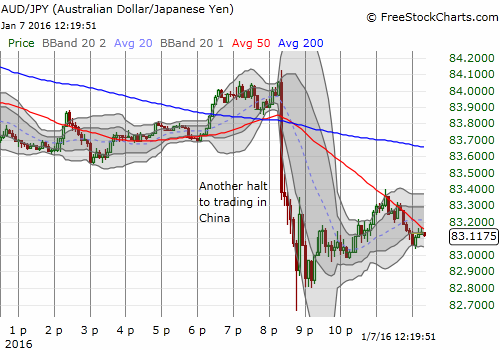
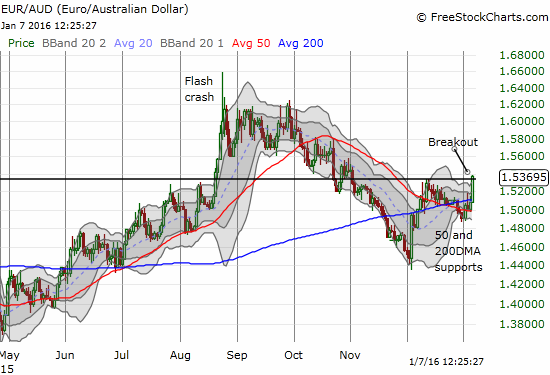
While I prefer to use AUD/JPY as a proxy for market sentiment (risk-on versus risk-off), EUR/AUD is intriguing again. The euro (FXE) versus the Australian dollar broke out and seems to have confirmed support at the 50 and 200-day moving averages (DMAs). This move could confirm an end to the latest wave of carry trades trying to take advantage of euro weakness and Australian yields.
Note again that currency trading is revealing underlying sentiment and helping me to interpret the moves in my favorite technical indicator, T2108, the percentage of stocks trading above their respective 40DMAs.
I was surprised T2108 never dropped into oversold territory. T2108 went as low as 21.9% and closed at 23.8%. I set a low-ball order to buy call options for ProShares Ultra S&P500 (SSO) that I thought would trigger only during oversold conditions. Instead, they triggered around the lows of the day. These call options should of course dive into the red on Thursday’s open.
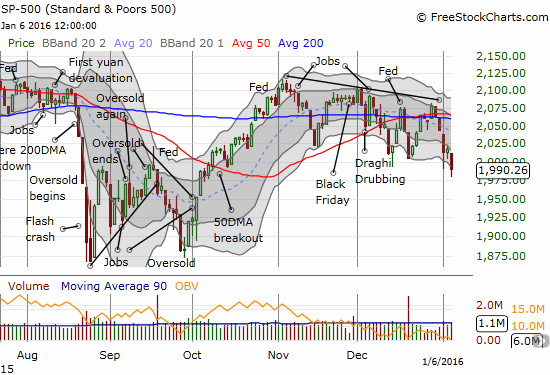
Surprisingly, the new low did not cause volatility to spike significantly. In fact, the VIX closed the day on a fade from its intraday high.
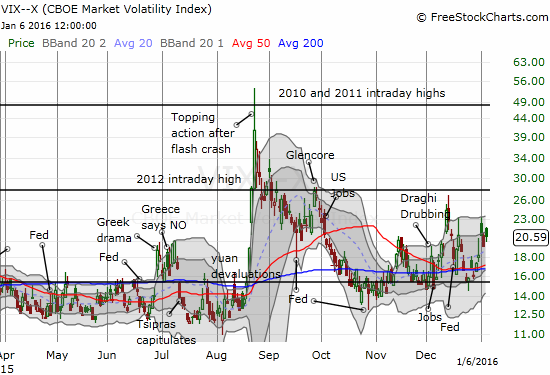
The fresh sag in the S&P 500 without oversold trading conditions or a fresh surge and strong close in the VIX has set up another interesting divergence. Technically, I cannot call this divergence bullish since T2108 fell 13%. Moreover, the action in the currency market is still flashing red. Instead, this divergence is interesting because it did NOT reflect a change in market leadership. The traditional big guys managed to close flat on the day or better. Apple (AAPL) was again the sore thumb in the bunch with another gut-wrenching slide. This time it was a gap down, an attempted rally, and then a fresh fade to a new 14+ month closing low.
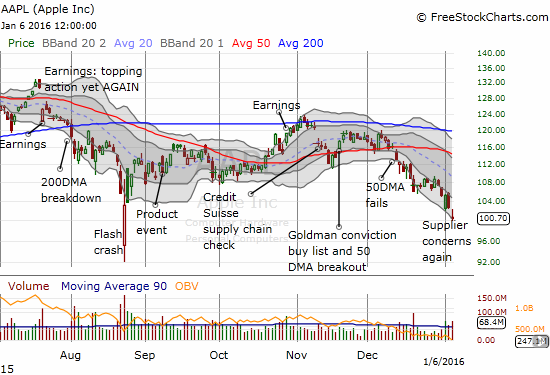
I doubled down on my call options for a final bullish move on AAPL. After this point, I will have to see buyers prove themselves again – like take AAPL out of the downward trending channel that has defined the action since last month’s breakdown from 50DMA support.
$NFLX first of the "big boys" to turn green. Relief bounce off intraday low moving fast and furious. $AMZN right behind.
— Dr. Duru (@DrDuru) January 6, 2016
Netflix (NFLX) was the big standout of the leadership stocks. Sometimes it is better to be lucky than good. As I mentioned in the last T2108 Update, I doubled down on my NFLX call options the previous trading day. I was quite surprised by the relative weakness. I had no idea that NFLX was making a major presentation at the Consumer Electronics Show (CES) in Las Vegas, Nevada. Even if I had, I would not have guessed the company could have news to send its stock soaring 9.3% right back to its 50DMA.
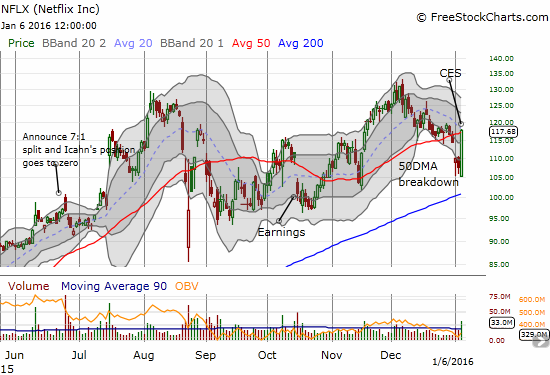
NFLX posted the announcement under a presentation from the CFO at the Citi 26th Annual Global Internet, Media and Telecommunications Conference. NFLX has greatly expanded its footprint to now cover 130 countries. The excitement generated by this announcement increased the value of my call options by 7x. I already had in place a limit order to sell that envisioned NFLX approaching the 50DMA but not testing it. I went out after a 4x increase.
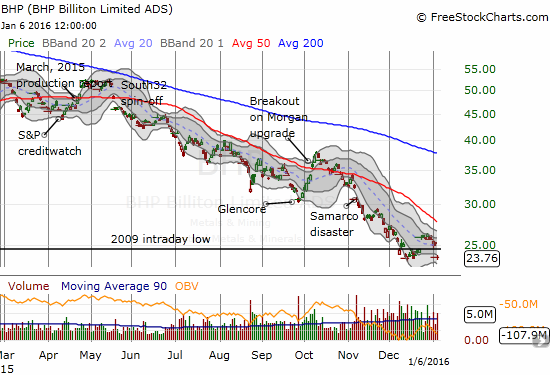
In the last T2108 Update I mentioned that I was holding onto my put options on iron ore players. I sold those today as BHP Billiton Limited (BHP) suffered a massive gap down. This experience has firmed my strategy to continue fading rallies in these stocks while the industry remains locked into a destructive feedback loop. Even without knowing the poor fundamentals, the trend should tell you ALL you need to know…
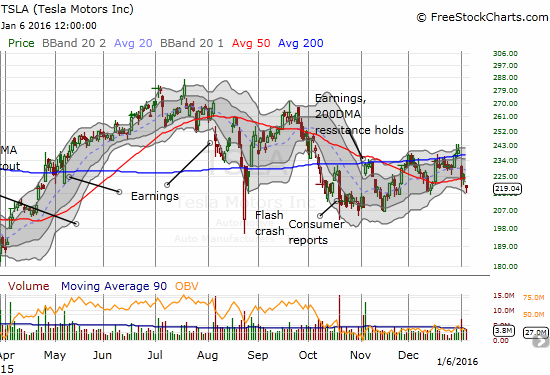
I also mentioned earlier that I am approaching this latest rendezvous with oversold conditions a little differently than those in the past – partly because of the warnings I see in the currency market. I am basically giving a little more deference to downside risks. If I see a traditional setup for a short play, I will consider taking it. Tesla Motors (TSLA) caught my eye today as it gapped down below its 50DMA support.
$TSLA pivot around 50DMA continues with today's breakdown.Last break a month ago and lasted just 2 days.
— Dr. Duru (@DrDuru) January 6, 2016
The put options on TSLA looked VERY cheap to me so I suspect the market does not believe the 50DMA breakdown signals a new bearish turn. I took the bet anyway. I am counting it as a fresh hedge against my otherwise bullish approach to (near) oversold trading conditions.
Daily T2108 vs the S&P 500
")
Black line: T2108 (measured on the right); Green line: S&P 500 (for comparative purposes)
Red line: T2108 Overbought (70%); Blue line: T2108 Oversold (20%)
Weekly T2108

*All charts created using freestockcharts.com unless otherwise stated
The charts above are the my LATEST updates independent of the date of this given T2108 post. For my latest T2108 post click here.
Related links:
The T2108 Resource Page
Expanded daily chart of T2108 versus the S&P 500
Expanded weekly chart of T2108
Be careful out there!
Full disclosure: long UVXY call options, long AAPL call options, net short the Australian dollar and euro, long TSLA put options